Mid-Coast Council Airbnb Market Analysis 2026: Short Term Rental Data & Vacation Rental Statistics in New South Wales, Australia
Is Airbnb profitable in Mid-Coast Council in 2026? Explore comprehensive Airbnb analytics for Mid-Coast Council, New South Wales, Australia to uncover income potential. This 2026 STR market report for Mid-Coast Council, based on AirROI data from February 2025 to January 2026, reveals key trends in the market of 303 active listings.
Whether you're considering an Airbnb investment in Mid-Coast Council, optimizing your existing vacation rental, or exploring rental arbitrage opportunities, understanding the Mid-Coast Council Airbnb data is crucial. Navigating the high regulation landscape is key to maximizing your short term rental income potential. Let's dive into the specifics.
Key Mid-Coast Council Airbnb Performance Metrics Overview
Monthly Airbnb Revenue Variations & Income Potential in Mid-Coast Council (2026)
Understanding the monthly revenue variations for Airbnb listings in Mid-Coast Council is key to maximizing your short term rental income potential. Seasonality significantly impacts earnings. Our analysis, based on data from the past 12 months, shows that the peak revenue month for STRs in Mid-Coast Council is typically October, while August often presents the lowest earnings, highlighting opportunities for strategic pricing adjustments during shoulder and low seasons. Explore the typical Airbnb income in Mid-Coast Council across different performance tiers:
- Best-in-class properties (Top 10%) achieve $5,271+ monthly, often utilizing dynamic pricing and superior guest experiences.
- Strong performing properties (Top 25%) earn $3,260 or more, indicating effective management and desirable locations/amenities.
- Typical properties (Median) generate around $1,880 per month, representing the average market performance.
- Entry-level properties (Bottom 25%) see earnings around $902, often with potential for optimization.
Average Monthly Airbnb Earnings Trend in Mid-Coast Council
Mid-Coast Council Airbnb Occupancy Rate Trends (2026)
Maximize your bookings by understanding the Mid-Coast Council STR occupancy trends. Seasonal demand shifts significantly influence how often properties are booked. Typically, Aprilsees the highest demand (peak season occupancy), while August experiences the lowest (low season). Effective strategies, like adjusting minimum stays or offering promotions, can boost occupancy during slower periods. Here's how different property tiers perform in Mid-Coast Council:
- Best-in-class properties (Top 10%) achieve 74%+ occupancy, indicating high desirability and potentially optimized availability.
- Strong performing properties (Top 25%) maintain 54% or higher occupancy, suggesting good market fit and guest satisfaction.
- Typical properties (Median) have an occupancy rate around 30%.
- Entry-level properties (Bottom 25%) average 15% occupancy, potentially facing higher vacancy.
Average Monthly Occupancy Rate Trend in Mid-Coast Council
Average Daily Rate (ADR) Airbnb Trends in Mid-Coast Council (2026)
Effective short term rental pricing strategy in Mid-Coast Council involves understanding monthly ADR fluctuations. The Average Daily Rate (ADR) for Airbnb in Mid-Coast Council typically peaks in January and dips lowest during March. Leveraging Airbnb dynamic pricing tools or strategies based on this seasonality can significantly boost revenue. Here's a look at the typical nightly rates achieved:
- Best-in-class properties (Top 10%) command rates of $427+ per night, often due to premium features or locations.
- Strong performing properties (Top 25%) achieve nightly rates of $282 or more.
- Typical properties (Median) charge around $185 per night.
- Entry-level properties (Bottom 25%) earn around $133 per night.
Average Daily Rate (ADR) Trend by Month in Mid-Coast Council
Get Live Mid-Coast Council Market Intelligence 👇

Explore Real-time Analytics
Airbnb Seasonality Analysis & Trends in Mid-Coast Council (2026)
Peak Season (October, December, April)
- Revenue averages $3,063 per month
- Occupancy rates average 40.5%
- Daily rates average $239
Shoulder Season
- Revenue averages $2,598 per month
- Occupancy maintains around 35.8%
- Daily rates hold near $236
Low Season (May, June, August)
- Revenue drops to average $2,140 per month
- Occupancy decreases to average 31.9%
- Daily rates adjust to average $229
Seasonality Insights for Mid-Coast Council
- The Airbnb seasonality in Mid-Coast Council shows moderate seasonality with distinct peak and low periods. While the sections above show seasonal averages, it's also insightful to look at the extremes:
- During the high season, the absolute peak month showcases Mid-Coast Council's highest earning potential, with monthly revenues capable of climbing to $3,201, occupancy reaching a high of 43.2%, and ADRs peaking at $260.
- Conversely, the slowest single month of the year, typically falling within the low season, marks the market's lowest point. In this month, revenue might dip to $2,016, occupancy could drop to 30.6%, and ADRs may adjust down to $224.
- Understanding both the seasonal averages and these monthly peaks and troughs in revenue, occupancy, and ADR is crucial for maximizing your Airbnb profit potential in Mid-Coast Council.
Seasonal Strategies for Maximizing Profit
- Peak Season: Maximize revenue through premium pricing and potentially longer minimum stays. Ensure high availability.
- Low Season: Offer competitive pricing, special promotions (e.g., extended stay discounts), and flexible cancellation policies. Target off-season travelers like remote workers or budget-conscious guests.
- Shoulder Seasons: Implement dynamic pricing that balances peak and low rates. Target weekend travelers or specific events. Offer slightly more flexible terms than peak season.
- Regularly analyze your own performance against these Mid-Coast Council seasonality benchmarks and adjust your pricing and availability strategy accordingly.
Best Areas for Airbnb Investment in Mid-Coast Council (2026)
Exploring the top neighborhoods for short-term rentals in Mid-Coast Council? This section highlights key areas, outlining why they are attractive for hosts and guests, along with notable local attractions. Consider these locations based on your target guest profile and investment strategy.
| Neighborhood / Area | Why Host Here? (Target Guests & Appeal) | Key Attractions & Landmarks |
|---|---|---|
| Eden | Stunning coastal town known for its beautiful beaches and rich marine life. A paradise for nature lovers and tourists looking for outdoor activities such as whale watching and fishing. | Merimbula Lake, Eden Whale Museum, Ben Boyd National Park, Pambula Beach, Snug Cove |
| Bega Valley | Surrounded by stunning landscapes, this area offers a rural charm with a mix of beaches and rolling hills. Popular with families and those seeking a quiet retreat. | Bega Cheese Heritage Centre, Bega Valley Regional Gallery, Mimosa Rocks National Park, Bemboka River, Mount Darragh |
| Merimbula | A popular holiday destination featuring beautiful beaches, a vibrant community, and a range of water sports activities. Ideal for visitors from Canberra and Sydney. | Merimbula Beach, Merimbula Boardwalk, Magic Mountain, Pambula River, Short Point Beach |
| Tathra | A charming coastal village with a relaxed atmosphere, known for its surf beach and historic significance in the Australian whaling industry. Attracts both families and surfers. | Tathra Beach, Tathra Wharf, Magic Mountain, Mimosa Rocks National Park, Tathra Head |
| Bateman's Bay | Known for its stunning estuary and outdoor activities. A region that is popular among families and tourists looking for adventure through hiking and water sports. | Moruya River, Observation Head, Mogo Zoo, Burrewarra Point, Catalina Beach |
| Narooma | Famous for its beautiful coastal scenery, stunning beaches, and abundance of marine life. Popular for snorkeling and diving activities. | Montague Island, Narooma Beach, Dalmeny Beach, Gulaga National Park, Narooma Golf Club |
| Bermagui | Small coastal town known for its fishing and artistic culture. Popular among tourists who seek a quieter beach experience with a touch of local charm. | Bermagui Blue Swim, Wagonga Inlet, Camel Rock, Bermagui Fishermen's Wharf, Bermagui Markets |
| South Durras | A serene coastal village close to national parks and beautiful beaches. Perfect for eco-tourism and attracting nature enthusiasts. | Murramarang National Park, Durras Lake, North Durras Beach, South Durras Beach, Birdland Animal Park |
Understanding Airbnb License Requirements & STR Laws in Mid-Coast Council (2026)
Yes, Mid-Coast Council, New South Wales, Australia enforces high STR regulations. Obtaining a license and ensuring compliance is almost certainly required according to current 2026 STR laws. Always verify the latest short term rental regulations and Airbnb license requirements directly with local government authorities for Mid-Coast Council to ensure full compliance before hosting.
(Source: AirROI data, 2026, based on 97% licensed listings)
Top Performing Airbnb Properties in Mid-Coast Council (2026)
Benchmark your potential! Explore examples of top-performing Airbnb properties in Mid-Coast Councilbased on Trailing Twelve Month (TTM) revenue. Analyze their characteristics, revenue, occupancy rate, and ADR to understand what drives success in this market.
FINNS AT OLD BAR - LUXURY HOLIDAY HOUSE SLEEPS 19
Entire Place • 7 bedrooms

Hillside Estate - Luxury Family Holiday Escape
Entire Place • 6 bedrooms
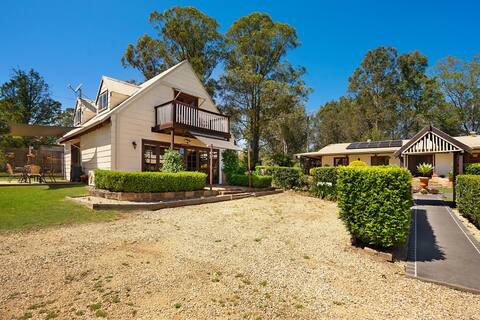
Firefly - Full Resort - House, Cottage and Grounds
Entire Place • 4 bedrooms
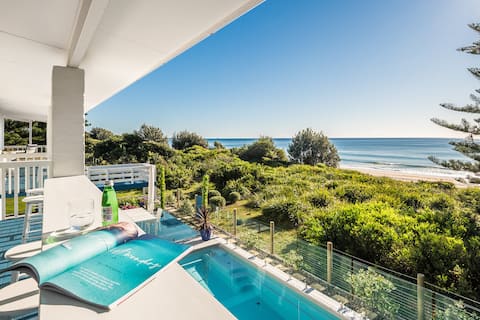
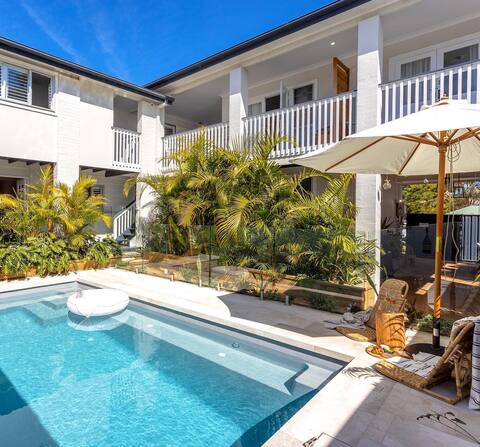
BEACHFRONT oasis with private pool & beach access
Entire Place • 5 bedrooms
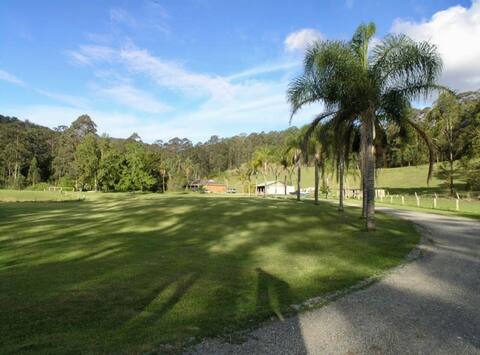
OCT Forest lodge ECO retreat homestead 20 people
Entire Place • 8 bedrooms

Firefly Cottage
Entire Place • 2 bedrooms
Note: Performance varies based on location, size, amenities, seasonality, and management quality. Data reflects the past 12 months.
Top Performing Airbnb Hosts in Mid-Coast Council (2026)
Learn from the best! This table showcases top-performing Airbnb hosts in Mid-Coast Council based on the number of properties managed and estimated total revenue over the past year. Analyze their scale and performance metrics.
| Host Name | Properties | Grossing Revenue | Stay Reviews | Avg Rating |
|---|---|---|---|---|
| Kate | 6 | $361,564 | 264 | 4.82/5.0 |
| MidCoast Holiday Rentals | 20 | $244,020 | 274 | 4.70/5.0 |
| Tom & Liz | 4 | $235,445 | 147 | 4.92/5.0 |
| Shaun | 4 | $232,313 | 477 | 4.95/5.0 |
| Narene | 14 | $219,874 | 53 | 4.63/5.0 |
| Robert | 1 | $161,577 | 71 | 4.99/5.0 |
| Mike | 2 | $150,182 | 68 | 4.82/5.0 |
| Tiny Away | 5 | $126,436 | 449 | 4.82/5.0 |
| Kent | 1 | $98,486 | 101 | 4.70/5.0 |
| Julianne | 5 | $91,329 | 266 | 4.65/5.0 |
Analyzing the strategies of top hosts, such as their property selection, pricing, and guest communication, can offer valuable lessons for optimizing your own Airbnb operations in Mid-Coast Council.
Dive Deeper: Advanced Mid-Coast Council STR Market Data (2026)
Ready to unlock more insights? AirROI provides access to advanced metrics and comprehensive Airbnb data for Mid-Coast Council. Explore detailed analytics beyond this report to refine your investment strategy, optimize pricing, and maximize your vacation rental profits.
Explore Advanced MetricsMid-Coast Council Short-Term Rental Market Composition (2026): Property & Room Types
Room Type Distribution
Property Type Distribution
Market Composition Insights for Mid-Coast Council
- The Mid-Coast Council Airbnb market composition is heavily skewed towards Entire Home/Apt listings, which make up 91.4% of the 303 active rentals. This indicates strong guest preference for privacy and space.
- Looking at the property type distribution in Mid-Coast Council, House properties are the most common (65.7%), reflecting the local real estate landscape.
- Houses represent a significant 65.7% portion, catering likely to families or larger groups.
- Smaller segments like hotel/boutique (combined 3.6%) offer potential for unique stay experiences.
Mid-Coast Council Airbnb Room Capacity Analysis (2026): Bedroom Distribution
Distribution of Listings by Number of Bedrooms
Room Capacity Insights for Mid-Coast Council
- The dominant room capacity in Mid-Coast Council is 1 bedroom listings, making up 29.7% of the market. This suggests a strong demand for properties suitable for couples or solo travelers.
- Together, 1 bedroom and 3 bedrooms properties represent 51.8% of the active Airbnb listings in Mid-Coast Council, indicating a high concentration in these sizes.
- A significant 47.5% of listings offer 3+ bedrooms, catering to larger groups and families seeking more space in Mid-Coast Council.
Mid-Coast Council Vacation Rental Guest Capacity Trends (2026)
Distribution of Listings by Guest Capacity
Guest Capacity Insights for Mid-Coast Council
- The most common guest capacity trend in Mid-Coast Council vacation rentals is listings accommodating 8+ guests (29.4%). This suggests the primary traveler segment is likely larger groups.
- Properties designed for 8+ guests and 2 guests dominate the Mid-Coast Council STR market, accounting for 50.5% of listings.
- 52.5% of properties accommodate 6+ guests, serving the market segment for larger families or group travel in Mid-Coast Council.
- On average, properties in Mid-Coast Council are equipped to host 5.1 guests.
Mid-Coast Council Airbnb Booking Patterns (2026): Available vs. Booked Days
Available Days Distribution
Booked Days Distribution
Booking Pattern Insights for Mid-Coast Council
- The most common availability pattern in Mid-Coast Council falls within the 271-366 days range, representing 56.8% of listings. This suggests many properties have significant open periods on their calendars.
- Approximately 86.2% of listings show high availability (181+ days open annually), indicating potential for increased bookings or specific owner usage patterns.
- For booked days, the 31-90 days range is most frequent in Mid-Coast Council (35.6%), reflecting common guest stay durations or potential owner blocking patterns.
- A notable 14.9% of properties secure long booking periods (181+ days booked per year), highlighting successful long-term rental strategies or significant owner usage.
Mid-Coast Council Airbnb Minimum Stay Requirements Analysis
Distribution of Listings by Minimum Night Requirement
1 Night
49 listings
16.2% of total
2 Nights
111 listings
36.6% of total
3 Nights
13 listings
4.3% of total
4-6 Nights
3 listings
1% of total
7-29 Nights
10 listings
3.3% of total
30+ Nights
117 listings
38.6% of total
Key Insights
- The most prevalent minimum stay requirement in Mid-Coast Council is 30+ Nights, adopted by 38.6% of listings. This highlights the market's preference for longer commitments.
- A significant segment (38.6%) caters to monthly stays (30+ nights) in Mid-Coast Council, pointing to opportunities in the extended-stay market.
Recommendations
- Align with the market by considering a 30+ Nights minimum stay, as 38.6% of Mid-Coast Council hosts use this setting.
- If feasible, allowing 1-night stays, especially midweek or during low season, could capture last-minute bookings, as only 16.2% currently do.
- A 2-night minimum appears standard (36.6%). Consider this for weekends or peak periods.
- Explore offering discounts for stays of 30+ nights to attract the 38.6% of the market seeking extended stays.
- Adjust minimum nights based on seasonality – potentially shorter during low season and longer during peak demand periods in Mid-Coast Council.
Mid-Coast Council Airbnb Cancellation Policy Trends Analysis (2026)
Super Strict 60 Days
1 listings
0.3% of total
Super Strict 30 Days
41 listings
13.5% of total
Limited
7 listings
2.3% of total
Flexible
49 listings
16.2% of total
Moderate
86 listings
28.4% of total
Firm
89 listings
29.4% of total
Strict
30 listings
9.9% of total
Cancellation Policy Insights for Mid-Coast Council
- The prevailing Airbnb cancellation policy trend in Mid-Coast Council is Firm, used by 29.4% of listings.
- There's a relatively balanced mix between guest-friendly (44.6%) and stricter (39.3%) policies, offering choices for different guest needs.
- Strict cancellation policies are quite rare (9.9%), potentially making listings with this policy less competitive unless justified by high demand or property type.
Recommendations for Hosts
- Consider adopting a Firm policy to align with the 29.4% market standard in Mid-Coast Council.
- Using a Strict policy might deter some guests, as only 9.9% of listings use it. Evaluate if potential revenue protection outweighs possible lower booking rates.
- Regularly review your cancellation policy against competitors and market demand shifts in Mid-Coast Council.
Mid-Coast Council STR Booking Lead Time Analysis (2026)
Average Booking Lead Time by Month
Booking Lead Time Insights for Mid-Coast Council
- The overall average booking lead time for vacation rentals in Mid-Coast Council is 55 days.
- Guests book furthest in advance for stays during December (average 92 days), likely coinciding with peak travel demand or local events.
- The shortest booking windows occur for stays in July (average 33 days), indicating more last-minute travel plans during this time.
- Seasonally, Winter (69 days avg.) sees the longest lead times, while Summer (38 days avg.) has the shortest, reflecting typical travel planning cycles.
Recommendations for Hosts
- Use the overall average lead time (55 days) as a baseline for your pricing and availability strategy in Mid-Coast Council.
- For December stays, consider implementing length-of-stay discounts or slightly higher rates for bookings made less than 92 days out to capitalize on advance planning.
- Target marketing efforts for the Winter season well in advance (at least 69 days) to capture early planners.
- Monitor your own booking lead times against these Mid-Coast Council averages to identify opportunities for dynamic pricing adjustments.
Popular & Essential Airbnb Amenities in Mid-Coast Council (2026)
Amenity Prevalence
Amenity Insights for Mid-Coast Council
- Essential amenities in Mid-Coast Council that guests expect include: Smoke alarm. Lacking these (this) could significantly impact bookings.
- Popular amenities like Kitchen, Free parking on premises, Hot water are common but not universal. Offering these can provide a competitive edge.
Recommendations for Hosts
- Ensure your listing includes all essential amenities for Mid-Coast Council: Smoke alarm.
- Prioritize adding missing essentials: Smoke alarm.
- Consider adding popular differentiators like Kitchen or Free parking on premises to increase appeal.
- Highlight unique or less common amenities you offer (e.g., hot tub, dedicated workspace, EV charger) in your listing description and photos.
- Regularly check competitor amenities in Mid-Coast Council to stay competitive.
Mid-Coast Council Airbnb Guest Demographics & Profile Analysis (2026)
Guest Profile Summary for Mid-Coast Council
- The typical guest profile for Airbnb in Mid-Coast Council consists of primarily domestic travelers (93%), often arriving from nearby Sydney, typically belonging to the Post-2000s (Gen Z/Alpha) group (50%), primarily speaking English or French.
- Domestic travelers account for 93.0% of guests.
- Key international markets include Australia (93%) and United Kingdom (2%).
- Top languages spoken are English (68.7%) followed by French (5.4%).
- A significant demographic segment is the Post-2000s (Gen Z/Alpha) group, representing 50% of guests.
Recommendations for Hosts
- Target domestic marketing efforts towards travelers from Sydney and New South Wales.
- Tailor amenities and listing descriptions to appeal to the dominant Post-2000s (Gen Z/Alpha) demographic (e.g., highlight fast WiFi, smart home features, local guides).
- Highlight unique local experiences or amenities relevant to the primary guest profile.
- Consider seasonal promotions aligned with peak travel times for key origin markets.
Nearby Short-Term Rental Market Comparison
How does the Mid-Coast Council Airbnb market stack up against its neighbors? Compare key performance metrics like average monthly revenue, ADR, and occupancy rates in surrounding areas to understand the broader regional STR landscape.
| Market | Active Properties | Monthly Revenue | Daily Rate | Avg. Occupancy |
|---|---|---|---|---|
| Dawes Point | 10 | $5,632 | $415.45 | 62% |
| Millers Point | 16 | $5,345 | $388.13 | 62% |
| Nulkaba | 41 | $4,609 | $574.24 | 31% |
| Broke | 65 | $4,107 | $456.45 | 33% |
| Brightwaters | 10 | $4,086 | $467.19 | 35% |
| Branxton | 14 | $3,981 | $366.56 | 34% |
| Cessnock | 505 | $3,661 | $417.28 | 34% |
| Cessnock City Council | 135 | $3,629 | $448.79 | 34% |
| Dora Creek | 21 | $3,577 | $326.14 | 42% |
| Singleton Council | 155 | $3,549 | $478.73 | 29% |