Green Point Airbnb Market Analysis 2025: Short Term Rental Data & Vacation Rental Statistics in New South Wales, Australia
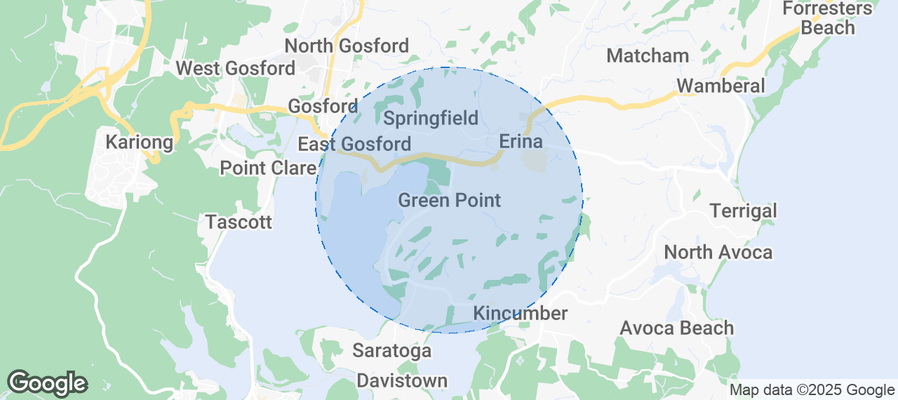
Is Airbnb profitable in Green Point in 2025? Explore comprehensive Airbnb analytics for Green Point, New South Wales, Australia to uncover income potential. This 2025 STR market report for Green Point, based on AirROI data from November 2024 to October 2025, reveals key trends in the niche market of 17 active listings.
Whether you're considering an Airbnb investment in Green Point, optimizing your existing vacation rental, or exploring rental arbitrage opportunities, understanding the Green Point Airbnb data is crucial. Navigating the high regulation landscape is key to maximizing your short term rental income potential. Let's dive into the specifics.
Key Green Point Airbnb Performance Metrics Overview
Monthly Airbnb Revenue Variations & Income Potential in Green Point (2025)
Understanding the monthly revenue variations for Airbnb listings in Green Point is key to maximizing your short term rental income potential. Seasonality significantly impacts earnings. Our analysis, based on data from the past 12 months, shows that the peak revenue month for STRs in Green Point is typically January, while August often presents the lowest earnings, highlighting opportunities for strategic pricing adjustments during shoulder and low seasons. Explore the typical Airbnb income in Green Point across different performance tiers:
- Best-in-class properties (Top 10%) achieve $9,697+ monthly, often utilizing dynamic pricing and superior guest experiences.
- Strong performing properties (Top 25%) earn $5,915 or more, indicating effective management and desirable locations/amenities.
- Typical properties (Median) generate around $3,870 per month, representing the average market performance.
- Entry-level properties (Bottom 25%) see earnings around $2,395, often with potential for optimization.
Average Monthly Airbnb Earnings Trend in Green Point
Green Point Airbnb Occupancy Rate Trends (2025)
Maximize your bookings by understanding the Green Point STR occupancy trends. Seasonal demand shifts significantly influence how often properties are booked. Typically, Januarysees the highest demand (peak season occupancy), while August experiences the lowest (low season). Effective strategies, like adjusting minimum stays or offering promotions, can boost occupancy during slower periods. Here's how different property tiers perform in Green Point:
- Best-in-class properties (Top 10%) achieve 70%+ occupancy, indicating high desirability and potentially optimized availability.
- Strong performing properties (Top 25%) maintain 55% or higher occupancy, suggesting good market fit and guest satisfaction.
- Typical properties (Median) have an occupancy rate around 35%.
- Entry-level properties (Bottom 25%) average 23% occupancy, potentially facing higher vacancy.
Average Monthly Occupancy Rate Trend in Green Point
Average Daily Rate (ADR) Airbnb Trends in Green Point (2025)
Effective short term rental pricing strategy in Green Point involves understanding monthly ADR fluctuations. The Average Daily Rate (ADR) for Airbnb in Green Point typically peaks in January and dips lowest during August. Leveraging Airbnb dynamic pricing tools or strategies based on this seasonality can significantly boost revenue. Here's a look at the typical nightly rates achieved:
- Best-in-class properties (Top 10%) command rates of $525+ per night, often due to premium features or locations.
- Strong performing properties (Top 25%) achieve nightly rates of $427 or more.
- Typical properties (Median) charge around $335 per night.
- Entry-level properties (Bottom 25%) earn around $246 per night.
Average Daily Rate (ADR) Trend by Month in Green Point
Get Live Green Point Market Intelligence 👇
Explore Real-time Analytics
Airbnb Seasonality Analysis & Trends in Green Point (2025)
Peak Season (January, December, November)
- Revenue averages $7,231 per month
- Occupancy rates average 55.9%
- Daily rates average $382
Shoulder Season
- Revenue averages $4,435 per month
- Occupancy maintains around 38.5%
- Daily rates hold near $346
Low Season (May, July, August)
- Revenue drops to average $2,801 per month
- Occupancy decreases to average 27.5%
- Daily rates adjust to average $340
Seasonality Insights for Green Point
- The Airbnb seasonality in Green Point shows highly seasonal trends requiring careful strategy. While the sections above show seasonal averages, it's also insightful to look at the extremes:
- During the high season, the absolute peak month showcases Green Point's highest earning potential, with monthly revenues capable of climbing to $8,239, occupancy reaching a high of 61.1%, and ADRs peaking at $404.
- Conversely, the slowest single month of the year, typically falling within the low season, marks the market's lowest point. In this month, revenue might dip to $2,375, occupancy could drop to 24.8%, and ADRs may adjust down to $333.
- Understanding both the seasonal averages and these monthly peaks and troughs in revenue, occupancy, and ADR is crucial for maximizing your Airbnb profit potential in Green Point.
Seasonal Strategies for Maximizing Profit
- Peak Season: Maximize revenue through premium pricing and potentially longer minimum stays. Ensure high availability.
- Low Season: Offer competitive pricing, special promotions (e.g., extended stay discounts), and flexible cancellation policies. Target off-season travelers like remote workers or budget-conscious guests.
- Shoulder Seasons: Implement dynamic pricing that balances peak and low rates. Target weekend travelers or specific events. Offer slightly more flexible terms than peak season.
- Regularly analyze your own performance against these Green Point seasonality benchmarks and adjust your pricing and availability strategy accordingly.
Best Areas for Airbnb Investment in Green Point (2025)
Exploring the top neighborhoods for short-term rentals in Green Point? This section highlights key areas, outlining why they are attractive for hosts and guests, along with notable local attractions. Consider these locations based on your target guest profile and investment strategy.
| Neighborhood / Area | Why Host Here? (Target Guests & Appeal) | Key Attractions & Landmarks |
|---|---|---|
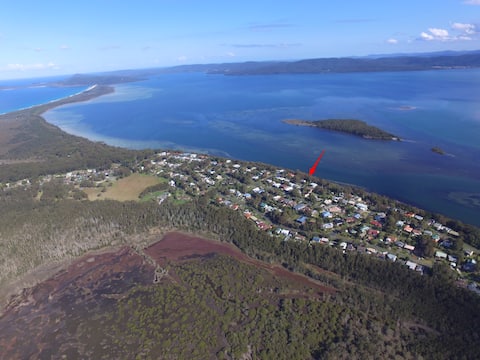
| Green Point | A peaceful residential area located near the water, known for its stunning views and proximity to Sydney. Ideal for families and travelers seeking a quiet retreat with easy access to urban attractions. | Sydney Harbour, North Sydney, Milsons Point, Cremorne Point Reserve, Taronga Zoo |
| Woolloomooloo | A waterfront suburb close to the Sydney city center, offering a mix of dining and cultural attractions. Popular with tourists looking for a vibrant atmosphere near the CBD. | Woolloomooloo Wharf, Art Gallery of New South Wales, The Royal Botanic Garden, Sydney Opera House |
| Balmain | A charming village atmosphere with a mix of historic architecture and trendy cafes. Attractive to travelers desiring a local experience with plenty of dining options. | Balmain Markets, Elkington Park, Sydney Harbour Foreshore, Woolwich Antique Centre |
| Neutral Bay | A picturesque suburb with scenic waterfront views and a relaxed vibe. Perfect for those wanting proximity to the city while enjoying a suburban feel. | Neutral Bay Ferry Wharf, Hayes Street Beach, Kurraba Point, The Oaks Hotel |
| Paddington | Known for its Victorian terraces and vibrant markets, Paddington attracts those looking for eclectic shopping and dining experiences, just a short distance from the city. | Paddington Markets, The Paddington Inn, Oxford Street, Centennial Parklands |
| Kirribilli | An affluent suburb that offers stunning views of the city and harbor. Ideal for travelers wanting to experience the upscale side of Sydney. | Kirribilli House, Blues Point Reserve, Luna Park, Milsons Point |
| Mosman | A prestigious area known for its beautiful beaches and upscale living. Attractive to families and travelers wanting outdoor activities and beach access. | Taronga Zoo, Mosman Beach, Chowder Bay, Clifton Gardens |
| Surry Hills | A hip neighborhood known for its vibrant nightlife and dining spots. Popular with young travelers seeking a dynamic urban experience. | Crown Street, Surry Hills Markets, The Beresford Hotel, Taylor Square |
Understanding Airbnb License Requirements & STR Laws in Green Point (2025)
Yes, Green Point, New South Wales, Australia enforces high STR regulations. Obtaining a license and ensuring compliance is almost certainly required according to current 2025 STR laws. Always verify the latest short term rental regulations and Airbnb license requirements directly with local government authorities for Green Point to ensure full compliance before hosting.
(Source: AirROI data, 2025, based on 82% licensed listings)
Top Performing Airbnb Properties in Green Point (2025)
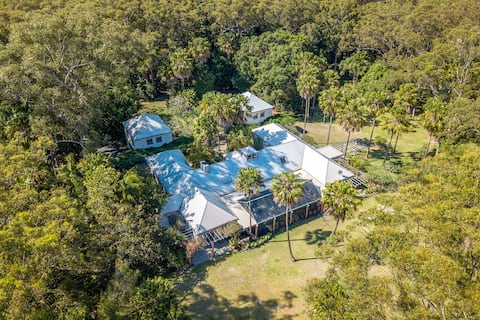
Benchmark your potential! Explore examples of top-performing Airbnb properties in Green Pointbased on Trailing Twelve Month (TTM) revenue. Analyze their characteristics, revenue, occupancy rate, and ADR to understand what drives success in this market.
Turtles Crossing
Entire Place • 5 bedrooms

Bask at Green Point - Between the ocean & the lake
Entire Place • 6 bedrooms

Booti Booti Chateau Lakeside
Entire Place • 4 bedrooms
Wallis Lake Retreat-Between the ocean and the lake
Entire Place • 4 bedrooms
Bluebell
Entire Place • 5 bedrooms

Songbird
Entire Place • 4 bedrooms
Note: Performance varies based on location, size, amenities, seasonality, and management quality. Data reflects the past 12 months.
Top Performing Airbnb Hosts in Green Point (2025)
Learn from the best! This table showcases top-performing Airbnb hosts in Green Point based on the number of properties managed and estimated total revenue over the past year. Analyze their scale and performance metrics.
| Host Name | Properties | Grossing Revenue | Stay Reviews | Avg Rating |
|---|---|---|---|---|
| Ken | 11 | $566,631 | 863 | 4.93/5.0 |
| Jenni | 1 | $136,936 | 30 | 4.93/5.0 |
| Karri | 1 | $33,256 | 26 | 4.77/5.0 |
| Ahoy Forster | 1 | $18,222 | 12 | 4.92/5.0 |
| Forster Accommodation | 1 | $10,821 | 9 | 4.89/5.0 |
| Ros | 1 | $9,858 | 47 | 4.38/5.0 |
| Sussan | 1 | $4,024 | 35 | 5.00/5.0 |
Analyzing the strategies of top hosts, such as their property selection, pricing, and guest communication, can offer valuable lessons for optimizing your own Airbnb operations in Green Point.
Dive Deeper: Advanced Green Point STR Market Data (2025)
Ready to unlock more insights? AirROI provides access to advanced metrics and comprehensive Airbnb data for Green Point. Explore detailed analytics beyond this report to refine your investment strategy, optimize pricing, and maximize your vacation rental profits.
Explore Advanced MetricsGreen Point Short-Term Rental Market Composition (2025): Property & Room Types
Room Type Distribution
Property Type Distribution
Market Composition Insights for Green Point
- The Green Point Airbnb market composition is heavily skewed towards Entire Home/Apt listings, which make up 100% of the 17 active rentals. This indicates strong guest preference for privacy and space.
- Looking at the property type distribution in Green Point, House properties are the most common (94.1%), reflecting the local real estate landscape.
- Houses represent a significant 94.1% portion, catering likely to families or larger groups.
Green Point Airbnb Room Capacity Analysis (2025): Bedroom Distribution
Distribution of Listings by Number of Bedrooms
Room Capacity Insights for Green Point
- The dominant room capacity in Green Point is 4 bedrooms listings, making up 35.3% of the market. This suggests a strong demand for properties suitable for families or small groups.
- Together, 4 bedrooms and 3 bedrooms properties represent 64.7% of the active Airbnb listings in Green Point, indicating a high concentration in these sizes.
- A significant 88.2% of listings offer 3+ bedrooms, catering to larger groups and families seeking more space in Green Point.
Green Point Vacation Rental Guest Capacity Trends (2025)
Distribution of Listings by Guest Capacity
Guest Capacity Insights for Green Point
- The most common guest capacity trend in Green Point vacation rentals is listings accommodating 8+ guests (64.7%). This suggests the primary traveler segment is likely larger groups.
- Properties designed for 8+ guests and 6 guests dominate the Green Point STR market, accounting for 88.2% of listings.
- 88.2% of properties accommodate 6+ guests, serving the market segment for larger families or group travel in Green Point.
- On average, properties in Green Point are equipped to host 6.9 guests.
Green Point Airbnb Booking Patterns (2025): Available vs. Booked Days
Available Days Distribution
Booked Days Distribution
Booking Pattern Insights for Green Point
- The most common availability pattern in Green Point falls within the 181-270 days range, representing 47.1% of listings. This suggests many properties have significant open periods on their calendars.
- Approximately 82.4% of listings show high availability (181+ days open annually), indicating potential for increased bookings or specific owner usage patterns.
- For booked days, the 91-180 days range is most frequent in Green Point (52.9%), reflecting common guest stay durations or potential owner blocking patterns.
- A notable 17.6% of properties secure long booking periods (181+ days booked per year), highlighting successful long-term rental strategies or significant owner usage.
Green Point Airbnb Minimum Stay Requirements Analysis
Distribution of Listings by Minimum Night Requirement
2 Nights
3 listings
17.6% of total
3 Nights
1 listings
5.9% of total
4-6 Nights
1 listings
5.9% of total
30+ Nights
12 listings
70.6% of total
Key Insights
- The most prevalent minimum stay requirement in Green Point is 30+ Nights, adopted by 70.6% of listings. This highlights the market's preference for longer commitments.
- Very short stays (1-2 nights) are less common (17.6%), suggesting hosts prefer slightly longer bookings to optimize turnover.
- A significant segment (70.6%) caters to monthly stays (30+ nights) in Green Point, pointing to opportunities in the extended-stay market.
Recommendations
- Align with the market by considering a 30+ Nights minimum stay, as 70.6% of Green Point hosts use this setting.
- Explore offering discounts for stays of 30+ nights to attract the 70.6% of the market seeking extended stays.
- Adjust minimum nights based on seasonality – potentially shorter during low season and longer during peak demand periods in Green Point.
Green Point Airbnb Cancellation Policy Trends Analysis (2025)
Flexible
1 listings
5.9% of total
Moderate
2 listings
11.8% of total
Firm
14 listings
82.4% of total
Cancellation Policy Insights for Green Point
- The prevailing Airbnb cancellation policy trend in Green Point is Firm, used by 82.4% of listings.
- A majority (82.4%) of hosts in Green Point utilize Firm or Strict policies, indicating a market where hosts prioritize booking security.
Recommendations for Hosts
- Consider adopting a Firm policy to align with the 82.4% market standard in Green Point.
- Regularly review your cancellation policy against competitors and market demand shifts in Green Point.
Green Point STR Booking Lead Time Analysis (2025)
Average Booking Lead Time by Month
Booking Lead Time Insights for Green Point
- The overall average booking lead time for vacation rentals in Green Point is 80 days.
- Guests book furthest in advance for stays during October (average 149 days), likely coinciding with peak travel demand or local events.
- The shortest booking windows occur for stays in July (average 40 days), indicating more last-minute travel plans during this time.
- Seasonally, Fall (93 days avg.) sees the longest lead times, while Summer (52 days avg.) has the shortest, reflecting typical travel planning cycles.
Recommendations for Hosts
- Use the overall average lead time (80 days) as a baseline for your pricing and availability strategy in Green Point.
- For October stays, consider implementing length-of-stay discounts or slightly higher rates for bookings made less than 149 days out to capitalize on advance planning.
- Target marketing efforts for the Fall season well in advance (at least 93 days) to capture early planners.
- Monitor your own booking lead times against these Green Point averages to identify opportunities for dynamic pricing adjustments.
Popular & Essential Airbnb Amenities in Green Point (2025)
Amenity Prevalence
Amenity Insights for Green Point
- Essential amenities in Green Point that guests expect include: Free parking on premises, Iron, Dishes and silverware, Refrigerator, BBQ grill, Smoke alarm, Kitchen. Lacking these (any) could significantly impact bookings.
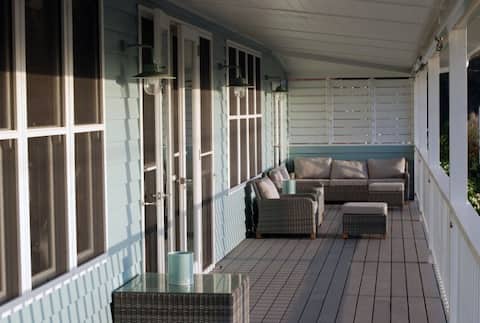
- Popular amenities like Outdoor furniture, Heating, Backyard are common but not universal. Offering these can provide a competitive edge.
Recommendations for Hosts
- Ensure your listing includes all essential amenities for Green Point: Free parking on premises, Iron, Dishes and silverware, Refrigerator, BBQ grill, Smoke alarm, Kitchen.
- Consider adding popular differentiators like Outdoor furniture or Heating to increase appeal.
- Highlight unique or less common amenities you offer (e.g., hot tub, dedicated workspace, EV charger) in your listing description and photos.
- Regularly check competitor amenities in Green Point to stay competitive.
Green Point Airbnb Guest Demographics & Profile Analysis (2025)
Guest Profile Summary for Green Point
- The typical guest profile for Airbnb in Green Point consists of primarily domestic travelers (97%), often arriving from nearby Sydney, typically belonging to the Post-2000s (Gen Z/Alpha) group (50%), primarily speaking English or French.
- Domestic travelers account for 97.3% of guests.
- Key international markets include Australia (97.3%) and United States (1.4%).
- Top languages spoken are English (79.2%) followed by French (8.3%).
- A significant demographic segment is the Post-2000s (Gen Z/Alpha) group, representing 50% of guests.
Recommendations for Hosts
- Target domestic marketing efforts towards travelers from Sydney and New South Wales.
- Tailor amenities and listing descriptions to appeal to the dominant Post-2000s (Gen Z/Alpha) demographic (e.g., highlight fast WiFi, smart home features, local guides).
- Highlight unique local experiences or amenities relevant to the primary guest profile.
- Consider seasonal promotions aligned with peak travel times for key origin markets.
Nearby Short-Term Rental Market Comparison
How does the Green Point Airbnb market stack up against its neighbors? Compare key performance metrics like average monthly revenue, ADR, and occupancy rates in surrounding areas to understand the broader regional STR landscape.
| Market | Active Properties | Monthly Revenue | Daily Rate | Avg. Occupancy |
|---|---|---|---|---|
| Nulkaba | 38 | $4,528 | $499.08 | 32% |
| Brightwaters | 10 | $4,392 | $486.06 | 34% |
| Branxton | 14 | $4,339 | $373.12 | 34% |
| Broke | 63 | $4,256 | $482.49 | 33% |
| Dora Creek | 21 | $4,107 | $357.35 | 44% |
| Singleton Council | 160 | $4,055 | $500.78 | 30% |
| Cessnock | 513 | $4,042 | $434.13 | 35% |
| Coomba Park | 31 | $3,979 | $489.42 | 37% |
| Seal Rocks | 18 | $3,934 | $435.37 | 36% |
| Cessnock City Council | 138 | $3,771 | $455.35 | 33% |