Carnmenellis, England Airbnb Market Data 2026: STR Report & Statistics
How much can you earn on Airbnb in Carnmenellis, England? Based on AirROI's 2026 dataset (March 2025 – February 2026), the short answer is $31,812 per year — at a $274 nightly rate, 44.2% occupancy, and a N/A RevPAR.
With just 19 active listings, Carnmenellis is a micro-market where moderate demand with room for well-positioned listings to outperform. Supply has held steady as the market finds a new equilibrium. For hosts in Carnmenellis, this is the ideal moment to sharpen guest experience, refresh listing photos, and implement dynamic pricing — incremental improvements compound quickly when competition is stable.
Regulation is low with minimal registration requirements, pointing to an operator-friendly environment. In a market this size, differentiated listings with strong reviews can capture outsized returns relative to the competition.
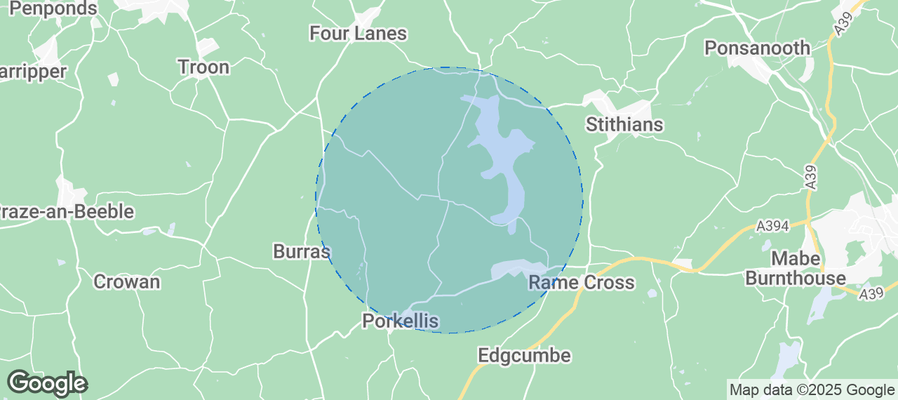
Table of Contents [hide] [show]
What Are the Key Airbnb Metrics in Carnmenellis?
In Carnmenellis, the headline Airbnb metrics are $31,812 in average annual revenue,44.2% occupancy, $274 ADR, and $0 in RevPAR, and guests book about 57 days in advance.
How Much Do Airbnb Hosts Earn Monthly in Carnmenellis?
Understanding the monthly revenue variations for Airbnb listings in Carnmenellis is key to maximizing your short term rental income potential. Seasonality significantly impacts earnings. Our analysis, based on data from the past 12 months, shows that the peak revenue month for STRs in Carnmenellis is typically August, while February often presents the lowest earnings, highlighting opportunities for strategic pricing adjustments during shoulder and low seasons. Explore the typical Airbnb income in Carnmenellis across different performance tiers:
- Best-in-class properties (Top 10%) achieve $6,121+ monthly, often utilizing dynamic pricing and superior guest experiences.
- Strong performing properties (Top 25%) earn $4,284 or more, indicating effective management and desirable locations/amenities.
- Typical properties (Median) generate around $3,233 per month, representing the average market performance.
- Entry-level properties (Bottom 25%) see earnings around $1,846, often with potential for optimization.
Average Monthly Airbnb Earnings Trend in Carnmenellis
What Is the Monthly Airbnb Occupancy Rate in Carnmenellis?
Maximize your bookings by understanding the Carnmenellis STR occupancy trends. Seasonal demand shifts significantly influence how often properties are booked. Typically, Augustsees the highest demand (peak season occupancy), while February experiences the lowest (low season). Effective strategies, like adjusting minimum stays or offering promotions, can boost occupancy during slower periods. Here's how different property tiers perform in Carnmenellis:
- Best-in-class properties (Top 10%) achieve 68%+ occupancy, indicating high desirability and potentially optimized availability.
- Strong performing properties (Top 25%) maintain 56% or higher occupancy, suggesting good market fit and guest satisfaction.
- Typical properties (Median) have an occupancy rate around 41%.
- Entry-level properties (Bottom 25%) average 29% occupancy, potentially facing higher vacancy.
Average Monthly Occupancy Rate Trend in Carnmenellis
What Is the Average Airbnb Nightly Rate in Carnmenellis?
Effective short term rental pricing strategy in Carnmenellis involves understanding monthly ADR fluctuations. The Average Daily Rate (ADR) for Airbnb in Carnmenellis typically peaks in August and dips lowest during December. Leveraging Airbnb dynamic pricing tools or strategies based on this seasonality can significantly boost revenue. Here's a look at the typical nightly rates achieved:
- Best-in-class properties (Top 10%) command rates of $346+ per night, often due to premium features or locations.
- Strong performing properties (Top 25%) achieve nightly rates of $296 or more.
- Typical properties (Median) charge around $247 per night.
- Entry-level properties (Bottom 25%) earn around $193 per night.
Average Daily Rate (ADR) Trend by Month in Carnmenellis
What Is the RevPAR for Airbnb in Carnmenellis?
RevPAR in Carnmenellis is currently N/A. Because RevPAR combines nightly rates with realized occupancy, it is one of the cleanest ways to compare how efficiently listings turn demand into revenue across the market.
- Entry-level properties (Bottom 25%) see N/A RevPAR.
- Typical properties (Median) generate N/A RevPAR.
- Strong performers (Top 25%) earn N/A RevPAR.
- Best-in-class (Top 10%) achieve N/A RevPAR.
Average Monthly RevPAR Trend in Carnmenellis
RevPAR Insights for Carnmenellis
- RevPAR peaks in Jan and bottoms out in Jan, mirroring the broader seasonal demand pattern and suggesting opportunities for dynamic pricing.
Recommendations for Hosts
- Track your own RevPAR monthly against these Carnmenellis benchmarks. If your RevPAR falls below the median of N/A, examine whether low occupancy or low ADR is the primary drag.
- Use RevPAR rather than revenue alone when comparing properties of different sizes — it normalizes for available nights and gives a more accurate picture of performance.
Get Live Carnmenellis Market Intelligence 👇
Explore Real-time Analytics
When Is the Peak Season for Airbnb in Carnmenellis?
Carnmenellis's peak Airbnb season falls in August, July, September, while the softest stretch is February, November, December. Overall, the market shows highly seasonal trends requiring careful strategy, which should guide pricing, minimum stays, and cash-flow planning.
Peak Season (August, July, September)
- Revenue averages $6,768 per month
- Occupancy rates average 63.0%
- Daily rates average $308
Shoulder Season
- Revenue averages $3,420 per month
- Occupancy maintains around 41.3%
- Daily rates hold near $260
Low Season (February, November, December)
- Revenue drops to average $1,674 per month
- Occupancy decreases to average 29.1%
- Daily rates adjust to average $230
Seasonality Insights for Carnmenellis
- Airbnb seasonality in Carnmenellis is pronounced. Revenue swings sharply between peak and low months, which means pricing strategy, minimum-stay settings, and cash reserves all need to account for extended slower periods.
- During the high season, the absolute peak month showcases Carnmenellis's highest earning potential, with monthly revenues climbing to $7,944, occupancy reaching 71.5%, and ADRs peaking at $330.
- Conversely, the slowest single month marks the market's lowest point — revenue may dip to $1,147, occupancy could drop to 20.0%, and ADRs may adjust to $222.
- Understanding both the seasonal averages and these monthly peaks and troughs in revenue, occupancy, and ADR is crucial for maximizing your Airbnb profit potential in Carnmenellis.
Seasonal Strategies for Maximizing Profit
- Peak Season: Maximize revenue through premium pricing and potentially longer minimum stays. Ensure high availability and consider tightening cancellation policies to reduce last-minute gaps.
- Low Season: Offer competitive pricing, extended-stay discounts, and flexible cancellation policies. Target off-season travelers like remote workers, budget-conscious guests, and travelers with flexible schedules.
- Shoulder Seasons: Implement dynamic pricing that bridges peak and low rates. Target weekend travelers, local events, and business visitors. Slightly more flexible terms than peak season can help maintain occupancy without deep discounting.
- In a highly seasonal market like Carnmenellis, building a cash reserve during the top months is essential for covering fixed costs during the slow period. Automated pricing tools can help capture demand shifts in real time.
Do You Need a License for Airbnb in Carnmenellis?
Low regulation and minimal registration activity in Carnmenellis, England, United Kingdom point to an operator-friendly environment. That said, even low-regulation markets may have tax collection requirements, safety standards, or HOA rules that affect short-term rental operations. Always verify the latest short-term rental regulations and Airbnb license requirements directly with local government authorities for Carnmenellis to ensure full compliance before hosting.
(Source: AirROI data, 2026, finding no licensed listings among those analyzed)
What Are the Best Neighborhoods for Airbnb in Carnmenellis?
With a compact short-term rental market, Carnmenellis gives early-mover hosts an advantage in the right neighborhoods. The areas listed below are where guest demand and local attractions converge — a useful lens for investors evaluating whether to enter this market and where to position their listing.
| Neighborhood / Area | Why Host Here? (Target Guests & Appeal) | Key Attractions & Landmarks |
|---|---|---|
| Redruth | A historic mining town, Redruth is undergoing revitalization and is close to stunning coastal scenery. Ideal for guests interested in local history and nature. | Cornish Mining World Heritage Site, Gwennap Pit, Portreath Beach, Redruth Town Centre, Kenneggy Downs |
| Truro | The capital of Cornwall, Truro boasts a vibrant cultural scene, shopping, and dining. A great base for exploring Cornwall and attracting both tourists and business travelers. | Truro Cathedral, Royal Cornwall Museum, High Cross, Hall for Cornwall, Prima Lenca |
| Falmouth | Known for its maritime heritage and beautiful beaches, Falmouth is popular with tourists for sailing and beach activities, offering a lively atmosphere with arts and culture. | National Maritime Museum, Falmouth Harbour, Gyllyngvase Beach, Pendennis Castle, Falmouth Art Gallery |
| St Ives | A picturesque coastal town, St Ives is famous for its art scene and beautiful beaches. A popular destination for tourists looking for a seaside getaway. | St Ives Harbour, Tate St Ives, Porthmeor Beach, Barbara Hepworth Museum and Sculpture Garden, Leach Pottery |
| Penzance | A charming town with a rich history, Penzance is the gateway to the Scilly Isles and offers stunning sea views and cultural attractions. | The Minack Theatre, Penzance Promenade, Mouseshole, St Michael's Mount, Penlee House Gallery and Museum |
| Newquay | Famous for its surfing beaches and vibrant nightlife, Newquay attracts a younger crowd and beach lovers, with a wide range of accommodation options. | Fistral Beach, Newquay Zoo, Blue Reef Aquarium, Watergate Bay, The Drang |
| Helston | Known for the famous Flora Day and close to the Lizard Peninsula, Helston is perfect for travelers seeking cultural experiences and stunning landscape. | Flambards Theme Park, Helston Folk Museum, The Lizard, Goonhilly Downs, Porthleven Beach |
| Marazion | A small town with stunning views of St Michael's Mount, Marazion is a sought-after location for those seeking a coastal retreat. | St Michael's Mount, Marazion Beach, RSPB Marazion Marsh, Marazion Castle, The Mounts Bay |
With 8 distinct neighborhoods showing meaningful short-term rental activity, Carnmenellis offers diversification within a single market. Investors can tailor their strategy — from high-turnover tourist zones to quieter residential areas that attract longer stays and remote workers.
What Types of Properties Are on Airbnb in Carnmenellis?
Room Type Distribution
Property Type Distribution
Market Composition Insights for Carnmenellis
- The Carnmenellis Airbnb market composition is heavily skewed towards Entire Home/Apt listings, which make up 78.9% of the 19 active rentals. This indicates strong guest preference for privacy and space.
- Looking at the property type distribution in Carnmenellis, House properties are the most common (52.6%), reflecting the local real estate landscape.
- Houses represent a significant 52.6% portion, catering likely to families or larger groups.
Carnmenellis Airbnb Room Capacity Analysis (2026): Bedroom Distribution
Distribution of Listings by Number of Bedrooms
Room Capacity Insights for Carnmenellis
- The dominant room capacity in Carnmenellis is 2 bedrooms listings, making up 26.3% of the market. This suggests a strong demand for properties suitable for couples or solo travelers.
- Together, 2 bedrooms and 1 bedroom properties represent 52.6% of the active Airbnb listings in Carnmenellis, indicating a high concentration in these sizes.
- A significant 26.4% of listings offer 3+ bedrooms, catering to larger groups and families seeking more space in Carnmenellis.
Carnmenellis Vacation Rental Guest Capacity Trends (2026)
Distribution of Listings by Guest Capacity
Guest Capacity Insights for Carnmenellis
- The most common guest capacity trend in Carnmenellis vacation rentals is listings accommodating 6 guests (31.6%). This suggests the primary traveler segment is likely larger groups.
- Properties designed for 6 guests and 4 guests dominate the Carnmenellis STR market, accounting for 63.2% of listings.
- 36.9% of properties accommodate 6+ guests, serving the market segment for larger families or group travel in Carnmenellis.
- On average, properties in Carnmenellis are equipped to host 4.2 guests.
What Amenities Do Airbnb Guests Expect in Carnmenellis?
Amenity Prevalence
Amenity Insights for Carnmenellis
- Popular amenities like Smoke alarm, Heating, Kitchen are common but not universal. Offering these can provide a competitive edge.
- Warning: Wifi is not universally provided but is considered essential globally. Ensure reliable Wifi is offered.
Recommendations for Hosts
- Consider adding popular differentiators like Smoke alarm or Heating to increase appeal.
- Highlight unique or less common amenities you offer (e.g., hot tub, dedicated workspace, EV charger) in your listing description and photos.
- Regularly check competitor amenities in Carnmenellis to stay competitive.
Dive Deeper: Advanced Carnmenellis STR Market Data (2026)
Ready to unlock more insights? AirROI provides access to advanced metrics and comprehensive Airbnb data for Carnmenellis. Explore detailed analytics beyond this report to refine your investment strategy, optimize pricing, and maximize your vacation rental profits.
Explore Advanced MetricsCarnmenellis Airbnb Guest Demographics & Profile Analysis (2026)
Guest Profile Summary for Carnmenellis
- The typical guest profile for Airbnb in Carnmenellis consists of primarily domestic travelers (91%), often arriving from nearby England, typically belonging to the Post-2000s (Gen Z/Alpha) group (50%), primarily speaking English or Afrikaans.
- Domestic travelers account for 90.9% of guests.
- Key international markets include United Kingdom (90.9%) and Netherlands (1.8%).
- Top languages spoken are English (76.7%) followed by Afrikaans (3.3%).
- A significant demographic segment is the Post-2000s (Gen Z/Alpha) group, representing 50% of guests.
Recommendations for Hosts
- Target domestic marketing efforts towards travelers from England and London.
- Tailor amenities and listing descriptions to appeal to the dominant Post-2000s (Gen Z/Alpha) demographic (e.g., highlight fast WiFi, smart home features, local guides).
- Highlight unique local experiences or amenities relevant to the primary guest profile.
- Consider seasonal promotions aligned with peak travel times for key origin markets.
Carnmenellis Airbnb Booking Patterns (2026): Available vs. Booked Days
Available Days Distribution
Booked Days Distribution
Booking Pattern Insights for Carnmenellis
- The most common availability pattern in Carnmenellis falls within the 271-366 days range, representing 52.6% of listings. This suggests many properties have significant open periods on their calendars.
- Approximately 89.4% of listings show high availability (181+ days open annually), indicating potential for increased bookings or specific owner usage patterns.
- For booked days, the 91-180 days range is most frequent in Carnmenellis (42.1%), reflecting common guest stay durations or potential owner blocking patterns.
- A notable 10.5% of properties secure long booking periods (181+ days booked per year), highlighting successful long-term rental strategies or significant owner usage.
How Far in Advance Do Guests Book Airbnb in Carnmenellis?
Average Booking Lead Time by Month
Booking Lead Time Insights for Carnmenellis
- The overall average booking lead time for vacation rentals in Carnmenellis is 57 days.
- Guests book furthest in advance for stays during April (average 89 days), likely coinciding with peak travel demand or local events.
- The shortest booking windows occur for stays in January (average 30 days), indicating more last-minute travel plans during this time.
- Seasonally, Spring (73 days avg.) sees the longest lead times, while Winter (51 days avg.) has the shortest, reflecting typical travel planning cycles.
Recommendations for Hosts
- Use the overall average lead time (57 days) as a baseline for your pricing and availability strategy in Carnmenellis.
- For April stays, consider implementing length-of-stay discounts or slightly higher rates for bookings made less than 89 days out to capitalize on advance planning.
- Target marketing efforts for the Spring season well in advance (at least 73 days) to capture early planners.
- Monitor your own booking lead times against these Carnmenellis averages to identify opportunities for dynamic pricing adjustments.
Carnmenellis Airbnb Minimum Stay Requirements Analysis
Distribution of Listings by Minimum Night Requirement
1 Night
13 listings
68.4% of total
3 Nights
2 listings
10.5% of total
30+ Nights
4 listings
21.1% of total
Key Insights
- The most prevalent minimum stay requirement in Carnmenellis is 1 Night, adopted by 68.4% of listings. This highlights the market's preference for shorter, flexible bookings.
- A strong majority (68.4%) of the Carnmenellis Airbnb data shows acceptance of very short stays (1-2 nights), indicating a dynamic, high-turnover market.
- A significant segment (21.1%) caters to monthly stays (30+ nights) in Carnmenellis, pointing to opportunities in the extended-stay market.
Recommendations
- Align with the market by considering a 1 Night minimum stay, as 68.4% of Carnmenellis hosts use this setting.
- Explore offering discounts for stays of 30+ nights to attract the 21.1% of the market seeking extended stays.
- Adjust minimum nights based on seasonality – potentially shorter during low season and longer during peak demand periods in Carnmenellis.
Carnmenellis Airbnb Cancellation Policy Trends Analysis (2026)
Super Strict 60 Days
13 listings
68.4% of total
Flexible
1 listings
5.3% of total
Moderate
2 listings
10.5% of total
Firm
3 listings
15.8% of total
Cancellation Policy Insights for Carnmenellis
- The prevailing Airbnb cancellation policy trend in Carnmenellis is Super Strict 60 Days, used by 68.4% of listings.
- There's a relatively balanced mix between guest-friendly (15.8%) and stricter (15.8%) policies, offering choices for different guest needs.
Recommendations for Hosts
- Consider adopting a Super Strict 60 Days policy to align with the 68.4% market standard in Carnmenellis.
- Regularly review your cancellation policy against competitors and market demand shifts in Carnmenellis.
What Do the Top Airbnb Listings in Carnmenellis Look Like?
Benchmark your potential! Explore examples of top-performing Airbnb properties in Carnmenellisbased on Trailing Twelve Month (TTM) revenue. Analyze their characteristics, revenue, occupancy rate, and ADR to understand what drives success in this market.
The Farm House
Entire Place • 6 bedrooms

Kynance
Entire Place • N/A

Log Jam - Secluded Dog-Friendly Treehouse
Entire Place • 1 bedroom

Gylly
Private Room • N/A

Tresco
Entire Place • 3 bedrooms

Bryher
Private Room • 3 bedrooms
Note: Performance varies based on location, size, amenities, seasonality, and management quality. Data reflects the past 12 months.
Who Are the Top Airbnb Hosts in Carnmenellis?
Learn from the best! This table showcases top-performing Airbnb hosts in Carnmenellis based on the number of properties managed and estimated total revenue over the past year. Analyze their scale and performance metrics.
| Host Name | Properties | Grossing Revenue | Stay Reviews | Avg Rating |
|---|---|---|---|---|
| Hoseasons | 11 | $307,997 | 66 | 4.85/5.0 |
| Cottages | 1 | $158,497 | 37 | 4.76/5.0 |
| Huw And Bernice | 3 | $92,582 | 109 | 5.00/5.0 |
| Catherine | 1 | $21,716 | 7 | 5.00/5.0 |
| Paul | 1 | $16,094 | 192 | 4.98/5.0 |
| Paula | 1 | $5,402 | 10 | 5.00/5.0 |
| Holidaycottages.Co.Uk | 1 | $2,148 | 2 | Not Rated |
Analyzing the strategies of top hosts, such as their property selection, pricing, and guest communication, can offer valuable lessons for optimizing your own Airbnb operations in Carnmenellis.
How Does Carnmenellis's Airbnb Market Compare to Nearby Cities?
How does the Carnmenellis Airbnb market stack up against its neighbors? Compare key performance metrics like average monthly revenue, ADR, and occupancy rates in surrounding areas to understand the broader regional STR landscape.
Compared with Kilgetty, Carnmenellis has 15 percentage points lower occupancy and about $50 higher ADR. That helps frame whether this market is winning more on demand, pricing, or both.
| Market | Active Properties | Monthly Revenue | Daily Rate | Avg. Occupancy |
|---|---|---|---|---|
| Angle | 12 | $6,670 | $656.43 | 48% |
| Southgate | 12 | $5,174 | $293.31 | 58% |
| Trenance | 23 | $4,246 | $536.32 | 40% |
| New Polzeath | 18 | $4,003 | $294.01 | 52% |
| Rhossili | 29 | $3,878 | $309.37 | 49% |
| Redberth | 32 | $3,859 | $244.48 | 57% |
| Kilgetty | 11 | $3,632 | $224.60 | 59% |
| Tiers Cross | 16 | $3,615 | $250.76 | 55% |
| Porthcurno | 44 | $3,613 | $336.40 | 46% |
| St Issey | 24 | $3,602 | $379.61 | 38% |
Frequently Asked Questions About Airbnb in Carnmenellis
These quick answers summarize the most common investor and operator questions using AirROI's latest market data for Carnmenellis.
How much do Airbnb hosts make in Carnmenellis?
Carnmenellis hosts earn about $31,812 per year on average, with an average nightly rate of $274 and RevPAR of N/A. Those figures describe the typical revenue environment for active listings in Carnmenellis, England, not the ceiling for the best operators. Source: AirROI 2026 data, Carnmenellis market, March 2025 to February 2026.
What is the average Airbnb occupancy rate in Carnmenellis?
The average Airbnb occupancy rate in Carnmenellis is 44.2%. August is the strongest month and February is the softest, so hosts should expect demand to move meaningfully throughout the year rather than stay flat.
What is the average Airbnb daily rate in Carnmenellis?
Listings in Carnmenellis average $274 per night. The broader pricing spread also matters: lower-performing listings cluster closer to the lower quartiles, while premium homes can price materially above the city average when demand spikes or listing quality stands out.
How many Airbnb listings are active in Carnmenellis?
Carnmenellis currently has about 19 active Airbnb listings in AirROI's market dataset. That supply count helps explain how competitive the market is, how much depth there is for benchmarking, and whether the market behaves like a niche destination or a scaled urban market.
How strict are short-term rental regulations in Carnmenellis?
AirROI currently classifies the short-term rental regulation level in Carnmenellis as Low. The dataset also shows about 0.0% of listings with registration evidence. That is a market signal, not legal advice, so hosts should still confirm current licensing and compliance rules locally before listing.
What is the RevPAR for Airbnb in Carnmenellis?
RevPAR in Carnmenellis is about N/A. That metric combines pricing and occupancy into one efficiency number, so it is often a better quick benchmark than ADR alone when investors want to compare how well listings convert nightly rates into realized revenue.
Is Airbnb profitable in Carnmenellis?
At 44.2% occupancy, Carnmenellis can be profitable — but margins depend heavily on operating costs, property acquisition price, and how well hosts optimize pricing across seasons. Average annual revenue is $31,812, but individual returns depend on property type, location within the city, and the host's operating efficiency.
How far in advance do guests book Airbnb in Carnmenellis?
The average booking lead time in Carnmenellis is about 57 days — a longer planning horizon typical of destination or vacation markets where travelers book well in advance. Hosts who understand their market's booking cadence can adjust minimum stays and pricing windows accordingly.
What are the best neighborhoods for Airbnb in Carnmenellis?
Based on AirROI's analysis, some of the top neighborhoods for short-term rentals in Carnmenellis include Redruth, Truro, Falmouth. Each area attracts different guest profiles — from business travelers to leisure visitors — so the best location depends on the property type and target audience a host is aiming for. See the full neighborhood breakdown above.
What type of property performs best on Airbnb in Carnmenellis?
entire_home listings make up 78.9% of the active supply in Carnmenellis. The most common configuration does not always mean the most profitable — operators who identify underserved property types or bedroom counts can sometimes outperform the market average by filling a gap in local supply.
How does Carnmenellis compare to nearby Airbnb markets?
Among neighboring markets, Angle posts $80,041 in average annual revenue with 48.3% occupancy, compared to Carnmenellis's $31,812 and 44.2%. Comparing nearby markets helps investors understand whether a destination's performance reflects local demand or broader regional trends.
When is the peak season for Airbnb in Carnmenellis?
August is the highest-revenue month in Carnmenellis, while February is the softest. The revenue spread between them indicates a highly seasonal market — revenue in the peak month is more than double the low month, so cash-flow planning and pricing automation are critical.
About AirROI Market Data
AirROI tracks over 20 million properties across 190+ countries and maintains 15+ years of historical performance data, making it one of the deepest Airbnb and STR intelligence platforms available. The analytics pipeline aggregates listing-level data monthly — revenue, occupancy, nightly rates, RevPAR, guest demographics, booking patterns, and competitive supply — so investors and operators can benchmark any market against its own history and against neighboring destinations.
Real estate investors, property managers, financial institutions, hedge funds, tourism boards, hospitality consultants, tech platforms, and academic researchers rely on AirROI data to underwrite acquisitions, optimize pricing, model macro trends, and conduct peer-reviewed research. Data is available through in-depth market reports like this one and the Airbnb API with 22 endpoints and an Airbnb MCP Server for AI agents.
AirROI proprietary analytics as of 2026-02-28. Metrics reflect trailing twelve-month aggregates from active listings. Revenue figures are market averages, not projections. Neighborhood descriptions are AI-generated and reviewed for accuracy. For full methodology, see the data methodology page.