Yeongheung-myeon, Ongjin-gun Airbnb Market Data 2025: STR Report & Statistics
How much can you earn on Airbnb in Yeongheung-myeon, Ongjin-gun? Based on AirROI's 2025 dataset (June 2024 – May 2025), the short answer is $4,819 per year — at a $218 nightly rate, 12.2% occupancy, and a N/A RevPAR.
With just 20 active listings, Yeongheung-myeon is a micro-market where selective demand that rewards strong listing quality and pricing strategy.
Regulation is high and 95% of listings show active registration — compliance is the cost of entry. In a market this size, differentiated listings with strong reviews can capture outsized returns relative to the competition.

Table of Contents [hide] [show]
What Are the Key Airbnb Metrics in Yeongheung-myeon?
In Yeongheung-myeon, the headline Airbnb metrics are $4,819 in average annual revenue,12.2% occupancy, $218 ADR, and $0 in RevPAR, and guests book about 16 days in advance.
How Much Do Airbnb Hosts Earn Monthly in Yeongheung-myeon?
Understanding the monthly revenue variations for Airbnb listings in Yeongheung-myeon is key to maximizing your short term rental income potential. Seasonality significantly impacts earnings. Our analysis, based on data from the past 12 months, shows that the peak revenue month for STRs in Yeongheung-myeon is typically May, while November often presents the lowest earnings, highlighting opportunities for strategic pricing adjustments during shoulder and low seasons. Explore the typical Airbnb income in Yeongheung-myeon across different performance tiers:
- Best-in-class properties (Top 10%) achieve $1,671+ monthly, often utilizing dynamic pricing and superior guest experiences.
- Strong performing properties (Top 25%) earn $1,265 or more, indicating effective management and desirable locations/amenities.
- Typical properties (Median) generate around $723 per month, representing the average market performance.
- Entry-level properties (Bottom 25%) see earnings around $412, often with potential for optimization.
Average Monthly Airbnb Earnings Trend in Yeongheung-myeon
What Is the Monthly Airbnb Occupancy Rate in Yeongheung-myeon?
Maximize your bookings by understanding the Yeongheung-myeon STR occupancy trends. Seasonal demand shifts significantly influence how often properties are booked. Typically, Maysees the highest demand (peak season occupancy), while November experiences the lowest (low season). Effective strategies, like adjusting minimum stays or offering promotions, can boost occupancy during slower periods. Here's how different property tiers perform in Yeongheung-myeon:
- Best-in-class properties (Top 10%) achieve 24%+ occupancy, indicating high desirability and potentially optimized availability.
- Strong performing properties (Top 25%) maintain 15% or higher occupancy, suggesting good market fit and guest satisfaction.
- Typical properties (Median) have an occupancy rate around 9%.
- Entry-level properties (Bottom 25%) average 7% occupancy, potentially facing higher vacancy.
Average Monthly Occupancy Rate Trend in Yeongheung-myeon
What Is the Average Airbnb Nightly Rate in Yeongheung-myeon?
Effective short term rental pricing strategy in Yeongheung-myeon involves understanding monthly ADR fluctuations. The Average Daily Rate (ADR) for Airbnb in Yeongheung-myeon typically peaks in January and dips lowest during August. Leveraging Airbnb dynamic pricing tools or strategies based on this seasonality can significantly boost revenue. Here's a look at the typical nightly rates achieved:
- Best-in-class properties (Top 10%) command rates of $337+ per night, often due to premium features or locations.
- Strong performing properties (Top 25%) achieve nightly rates of $270 or more.
- Typical properties (Median) charge around $193 per night.
- Entry-level properties (Bottom 25%) earn around $162 per night.
Average Daily Rate (ADR) Trend by Month in Yeongheung-myeon
What Is the RevPAR for Airbnb in Yeongheung-myeon?
RevPAR in Yeongheung-myeon is currently N/A. Because RevPAR combines nightly rates with realized occupancy, it is one of the cleanest ways to compare how efficiently listings turn demand into revenue across the market.
- Entry-level properties (Bottom 25%) see N/A RevPAR.
- Typical properties (Median) generate N/A RevPAR.
- Strong performers (Top 25%) earn N/A RevPAR.
- Best-in-class (Top 10%) achieve N/A RevPAR.
Average Monthly RevPAR Trend in Yeongheung-myeon
RevPAR Insights for Yeongheung-myeon
- RevPAR peaks in Jan and bottoms out in Jan, mirroring the broader seasonal demand pattern and suggesting opportunities for dynamic pricing.
Recommendations for Hosts
- Track your own RevPAR monthly against these Yeongheung-myeon benchmarks. If your RevPAR falls below the median of N/A, examine whether low occupancy or low ADR is the primary drag.
- Use RevPAR rather than revenue alone when comparing properties of different sizes — it normalizes for available nights and gives a more accurate picture of performance.
Get Live Yeongheung-myeon Market Intelligence 👇
Explore Real-time Analytics
When Is the Peak Season for Airbnb in Yeongheung-myeon?
Yeongheung-myeon's peak Airbnb season falls in May, January, April, while the softest stretch is August, September, October. Overall, the market shows highly seasonal trends requiring careful strategy, which should guide pricing, minimum stays, and cash-flow planning.
Peak Season (May, January, April)
- Revenue averages $1,210 per month
- Occupancy rates average 14.9%
- Daily rates average $251
Shoulder Season
- Revenue averages $408 per month
- Occupancy maintains around 6.2%
- Daily rates hold near $207
Low Season (August, September, October)
- Revenue drops to average $0 per month
- Occupancy decreases to average 0.0%
- Daily rates adjust to average $190
Seasonality Insights for Yeongheung-myeon
- Airbnb seasonality in Yeongheung-myeon is pronounced. Revenue swings sharply between peak and low months, which means pricing strategy, minimum-stay settings, and cash reserves all need to account for extended slower periods.
- During the high season, the absolute peak month showcases Yeongheung-myeon's highest earning potential, with monthly revenues climbing to $1,541, occupancy reaching 18.5%, and ADRs peaking at $273.
- Conversely, the slowest single month marks the market's lowest point — revenue may dip to $0, occupancy could drop to 0.0%, and ADRs may adjust to $187.
- Lower occupancy paired with meaningful seasonality means hosts in Yeongheung-myeon need to maximize every peak-season booking and seriously consider whether off-season pricing adjustments or minimum-stay changes can capture incremental revenue.
Seasonal Strategies for Maximizing Profit
- Peak Season: Maximize revenue through premium pricing. In a high-regulation market like Yeongheung-myeon, ensure your permit covers the number of nights you plan to book — some jurisdictions cap annual rental days.
- Low Season: Offer competitive pricing, extended-stay discounts, and flexible cancellation policies. Target off-season travelers like remote workers, budget-conscious guests, and travelers with flexible schedules.
- Shoulder Seasons: Implement dynamic pricing that bridges peak and low rates. Target weekend travelers, local events, and business visitors. Slightly more flexible terms than peak season can help maintain occupancy without deep discounting.
- In a highly seasonal market like Yeongheung-myeon, building a cash reserve during the top months is essential for covering fixed costs during the slow period. Automated pricing tools can help capture demand shifts in real time.
Do You Need a License for Airbnb in Yeongheung-myeon?
Yes, Yeongheung-myeon, Ongjin-gun, South Korea enforces high STR regulations and 95% of active listings show registration evidence — indicating that enforcement is active and compliance is a prerequisite for operating legally. Hosts entering this market should budget for permit fees, inspections, and potential occupancy tax obligations as part of their startup costs. Always verify the latest short-term rental regulations and Airbnb license requirements directly with local government authorities for Yeongheung-myeon to ensure full compliance before hosting.
(Source: AirROI data, 2026, based on 95% licensed listings)
What Are the Best Neighborhoods for Airbnb in Yeongheung-myeon?
With a compact short-term rental market, Yeongheung-myeon gives early-mover hosts an advantage in the right neighborhoods. The areas listed below are where guest demand and local attractions converge — a useful lens for investors evaluating whether to enter this market and where to position their listing.
| Neighborhood / Area | Why Host Here? (Target Guests & Appeal) | Key Attractions & Landmarks |
|---|---|---|
| Yeongheung Island | Known for its serene beaches and natural beauty, Yeongheung Island attracts tourists seeking a peaceful getaway. It's perfect for those who love nature, walking trails, and seaside relaxation. | Yeongheung Lighthouse, Sunset Beach, Yeongheung Spa, Hiking trails, Fishing spots |
| Ongjin Coast | The Ongjin coastal area is famous for its picturesque views and seafood delicacies. This location is appealing to food lovers and beachgoers, making it ideal for family outings and vacations. | Ongjin Beach, Seafood markets, Tidal flats, Coastal walking paths, Camping sites |
| Heuksando | Heuksando is famous for its beautiful landscapes and tranquil atmosphere. Known for its unspoiled nature, it is an excellent spot for tourists wanting to escape the city. | Heuksando Lighthouse, Fishing spots, Hiking trails, Gyeongpo Beach nearby, Local restaurants |
| Mokdo | Mokdo is a serene island with beautiful nature and rich marine life. It is ideal for outdoor activities, attracting nature lovers and adventurers looking for a quiet retreat. | Mokdo beaches, Diving spots, Marine parks, Bicycle renting, Scenic viewpoints |
| Jangdo | Jangdo has crystal clear waters and is loved for its beautiful beaches and water activities. It's a great spot for water sports enthusiasts and beach lovers. | Jangdo Beach, Water sports rentals, Beachside cafes, Nature trails, Local delicacies |
| Gurumbi Beach | Gurumbi Beach offers a beautiful landscape and is less crowded than other beaches. It's perfect for visitors seeking tranquility and natural beauty. | Gurumbi Beach, Sunset views, Beach camping, Fishing area, Scenic trails |
| Deokjeokdo Island | Deokjeokdo is known for its breathtaking ocean views and is great for hiking. It attracts tourists looking for both relaxation and adventure. | Deokjeokdo Beach, Hiking routes, Island exploration, Marine life watching, Local seafood |
| Sokcho Port | Sokcho Port is not only a busy fishing port but also offers beautiful views and various seafood options. It's an interesting place for tourists who enjoy culture and authentic experiences. | Sokcho Seafood market, Fishing tours, Park near the port, Cultural experiences, Sokcho Beach nearby |
Because Yeongheung-myeon has a high regulation profile, confirming that short-term rental permits are available in your target neighborhood is a critical first step before committing to a property purchase. Regulation can vary at the neighborhood or district level even within the same city.
What Types of Properties Are on Airbnb in Yeongheung-myeon?
Room Type Distribution
Property Type Distribution
Market Composition Insights for Yeongheung-myeon
- The Yeongheung-myeon Airbnb market composition is heavily skewed towards Entire Home/Apt listings, which make up 100% of the 20 active rentals. This indicates strong guest preference for privacy and space.
- Looking at the property type distribution in Yeongheung-myeon, Hotel/Boutique properties are the most common (85%), reflecting the local real estate landscape.
- The presence of 85% Hotel/Boutique listings indicates integration with traditional hospitality.
Yeongheung-myeon Airbnb Room Capacity Analysis (2026): Bedroom Distribution
Distribution of Listings by Number of Bedrooms
Room Capacity Insights for Yeongheung-myeon
- The dominant room capacity in Yeongheung-myeon is 1 bedroom listings, making up 65% of the market. This suggests a strong demand for properties suitable for couples or solo travelers.
- Together, 1 bedroom and 2 bedrooms properties represent 90.0% of the active Airbnb listings in Yeongheung-myeon, indicating a high concentration in these sizes.
- With over half the market (65%) consisting of studios or 1-bedroom units, Yeongheung-myeon is particularly well-suited for individuals or couples.
Yeongheung-myeon Vacation Rental Guest Capacity Trends (2026)
Distribution of Listings by Guest Capacity
Guest Capacity Insights for Yeongheung-myeon
- The most common guest capacity trend in Yeongheung-myeon vacation rentals is listings accommodating 8+ guests (40%). This suggests the primary traveler segment is likely larger groups.
- Properties designed for 8+ guests and 4 guests dominate the Yeongheung-myeon STR market, accounting for 70.0% of listings.
- 70.0% of properties accommodate 6+ guests, serving the market segment for larger families or group travel in Yeongheung-myeon.
- On average, properties in Yeongheung-myeon are equipped to host 6.2 guests.
What Amenities Do Airbnb Guests Expect in Yeongheung-myeon?
Amenity Prevalence
No amenities with partial availability (less than 100%) were found to display in the chart. All essential amenities might be present in all listings. Check insights below.
Amenity Insights for Yeongheung-myeon
- Essential amenities in Yeongheung-myeon that guests expect include: Fire extinguisher, Heating, Hot water, Essentials, Wifi, Carbon monoxide alarm, Kitchen, Hair dryer, Washer, Dryer. Lacking these (any) could significantly impact bookings.
Recommendations for Hosts
- Ensure your listing includes all essential amenities for Yeongheung-myeon: Fire extinguisher, Heating, Hot water, Essentials, Wifi, Carbon monoxide alarm, Kitchen, Hair dryer, Washer, Dryer.
- Highlight unique or less common amenities you offer (e.g., hot tub, dedicated workspace, EV charger) in your listing description and photos.
- Regularly check competitor amenities in Yeongheung-myeon to stay competitive.
Dive Deeper: Advanced Yeongheung-myeon STR Market Data (2026)
Ready to unlock more insights? AirROI provides access to advanced metrics and comprehensive Airbnb data for Yeongheung-myeon. Explore detailed analytics beyond this report to refine your investment strategy, optimize pricing, and maximize your vacation rental profits.
Explore Advanced MetricsYeongheung-myeon Airbnb Guest Demographics & Profile Analysis (2026)
Guest Profile Summary for Yeongheung-myeon
- The typical guest profile for Airbnb in Yeongheung-myeon consists of primarily domestic travelers (100%), often arriving from nearby Seoul.
- Domestic travelers account for 100.0% of guests.
Recommendations for Hosts
- Target domestic marketing efforts towards travelers from Seoul.
- Highlight unique local experiences or amenities relevant to the primary guest profile.
- Consider seasonal promotions aligned with peak travel times for key origin markets.
Yeongheung-myeon Airbnb Booking Patterns (2026): Available vs. Booked Days
Available Days Distribution
Booked Days Distribution
Booking Pattern Insights for Yeongheung-myeon
- The most common availability pattern in Yeongheung-myeon falls within the 271-366 days range, representing 100% of listings. This suggests many properties have significant open periods on their calendars.
- Approximately 100.0% of listings show high availability (181+ days open annually), indicating potential for increased bookings or specific owner usage patterns.
- For booked days, the 1-30 days range is most frequent in Yeongheung-myeon (90%), reflecting common guest stay durations or potential owner blocking patterns.
How Far in Advance Do Guests Book Airbnb in Yeongheung-myeon?
Average Booking Lead Time by Month
Booking Lead Time Insights for Yeongheung-myeon
- The overall average booking lead time for vacation rentals in Yeongheung-myeon is 16 days.
- Guests book furthest in advance for stays during May (average 26 days), likely coinciding with peak travel demand or local events.
- The shortest booking windows occur for stays in October (average 0 days), indicating more last-minute travel plans during this time.
- Seasonally, Spring (20 days avg.) sees the longest lead times, while Summer (0 days avg.) has the shortest, reflecting typical travel planning cycles.
Recommendations for Hosts
- Use the overall average lead time (16 days) as a baseline for your pricing and availability strategy in Yeongheung-myeon.
- During October, focus on last-minute booking availability and promotions, as guests book with very short notice (0 days avg.).
- Target marketing efforts for the Spring season well in advance (at least 20 days) to capture early planners.
- Monitor your own booking lead times against these Yeongheung-myeon averages to identify opportunities for dynamic pricing adjustments.
Yeongheung-myeon Airbnb Minimum Stay Requirements Analysis
Distribution of Listings by Minimum Night Requirement
1 Night
20 listings
100% of total
Key Insights
- The most prevalent minimum stay requirement in Yeongheung-myeon is 1 Night, adopted by 100% of listings. This highlights the market's preference for shorter, flexible bookings.
- A strong majority (100.0%) of the Yeongheung-myeon Airbnb data shows acceptance of very short stays (1-2 nights), indicating a dynamic, high-turnover market.
Recommendations
- Align with the market by considering a 1 Night minimum stay, as 100% of Yeongheung-myeon hosts use this setting.
- Adjust minimum nights based on seasonality – potentially shorter during low season and longer during peak demand periods in Yeongheung-myeon.
Yeongheung-myeon Airbnb Cancellation Policy Trends Analysis (2026)
Moderate
17 listings
85% of total
Strict
3 listings
15% of total
Cancellation Policy Insights for Yeongheung-myeon
- The prevailing Airbnb cancellation policy trend in Yeongheung-myeon is Moderate, used by 85% of listings.
- The market strongly favors guest-friendly terms, with 85.0% of listings offering Flexible or Moderate policies. This suggests guests in Yeongheung-myeon may expect booking flexibility.
Recommendations for Hosts
- Consider adopting a Moderate policy to align with the 85% market standard in Yeongheung-myeon.
- Regularly review your cancellation policy against competitors and market demand shifts in Yeongheung-myeon.
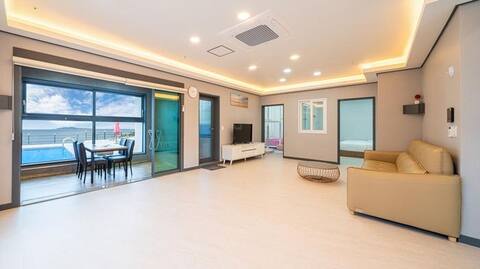
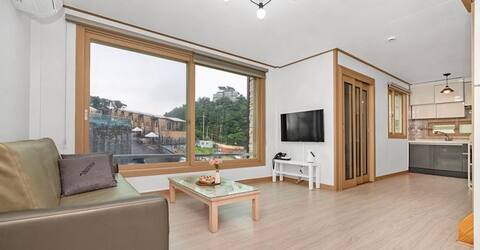
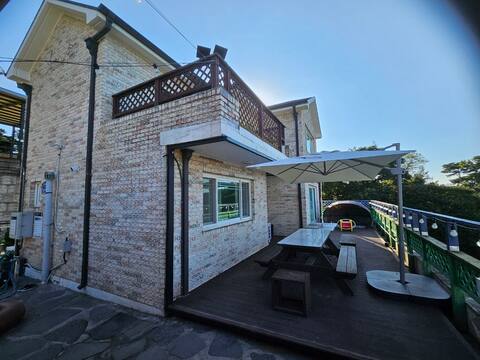
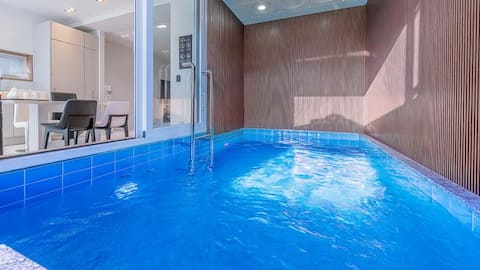
What Do the Top Airbnb Listings in Yeongheung-myeon Look Like?
Benchmark your potential! Explore examples of top-performing Airbnb properties in Yeongheung-myeonbased on Trailing Twelve Month (TTM) revenue. Analyze their characteristics, revenue, occupancy rate, and ADR to understand what drives success in this market.

선재도에서 행복한 추억만드세요 객실, 라온702 (애견동반,개별풀,기준2/최대4인)
Entire Place • N/A
어른과 아이 모두 행복한 객실, 101 (키즈룸,복층,온수풀,기준4/최대6)
Entire Place • 1 bedroom
푸릇푸릇 기분 좋은 풀잎냄새가 가득한 객실, a3
Entire Place • 1 bedroom
Pension ohi (cozy stay ohi)
Entire Place • 3 bedrooms
개별 풀에서 프라이빗한 시간을 보내는 객실, 라온602 (개별풀,기준2/최대4인)
Entire Place • N/A

라온701 (애견동반,개별풀,기준2/최대4인)
Entire Place • N/A
Note: Performance varies based on location, size, amenities, seasonality, and management quality. Data reflects the past 12 months.
Who Are the Top Airbnb Hosts in Yeongheung-myeon?
Learn from the best! This table showcases top-performing Airbnb hosts in Yeongheung-myeon based on the number of properties managed and estimated total revenue over the past year. Analyze their scale and performance metrics.
| Host Name | Properties | Grossing Revenue | Stay Reviews | Avg Rating |
|---|---|---|---|---|
| Host #532329988 | 9 | $51,948 | 0 | Not Rated |
| Host #533178901 | 6 | $20,094 | 1 | Not Rated |
| Host #529821870 | 3 | $9,213 | 3 | Not Rated |
| Host #531718324 | 1 | $8,184 | 0 | Not Rated |
| 광옥 | 1 | $6,943 | 14 | 4.71/5.0 |
Analyzing the strategies of top hosts, such as their property selection, pricing, and guest communication, can offer valuable lessons for optimizing your own Airbnb operations in Yeongheung-myeon.
How Does Yeongheung-myeon's Airbnb Market Compare to Nearby Cities?
How does the Yeongheung-myeon Airbnb market stack up against its neighbors? Compare key performance metrics like average monthly revenue, ADR, and occupancy rates in surrounding areas to understand the broader regional STR landscape.
Compared with Wondeok-ri, Yeongheung-myeon has 26 percentage points lower occupancy and about $16 higher ADR. That helps frame whether this market is winning more on demand, pricing, or both.
| Market | Active Properties | Monthly Revenue | Daily Rate | Avg. Occupancy |
|---|---|---|---|---|
| Wondeok-ri | 13 | $2,237 | $202.05 | 38% |
| Seorak-myeon | 11 | $1,842 | $185.73 | 34% |
| Homyeong-ri | 32 | $1,832 | $286.02 | 25% |
| Dojang-ri | 12 | $1,785 | $194.17 | 31% |
| Mugan-ri | 15 | $1,749 | $217.46 | 24% |
| Seorak | 11 | $1,669 | $205.64 | 29% |
| Yangpyeong-gun | 14 | $1,360 | $246.73 | 27% |
| Seojong | 19 | $1,350 | $193.83 | 25% |
| Yangju | 36 | $1,333 | $214.64 | 25% |
| Bokjang-ri | 40 | $1,236 | $218.28 | 19% |
Frequently Asked Questions About Airbnb in Yeongheung-myeon
These quick answers summarize the most common investor and operator questions using AirROI's latest market data for Yeongheung-myeon.
How much do Airbnb hosts make in Yeongheung-myeon?
Yeongheung-myeon hosts earn about $4,819 per year on average, with an average nightly rate of $218 and RevPAR of N/A. Those figures describe the typical revenue environment for active listings in Yeongheung-myeon, Ongjin-gun, not the ceiling for the best operators. Source: AirROI 2025 data, Yeongheung-myeon market, June 2024 to May 2025.
What is the average Airbnb occupancy rate in Yeongheung-myeon?
The average Airbnb occupancy rate in Yeongheung-myeon is 12.2%. May is the strongest month and November is the softest, so hosts should expect demand to move meaningfully throughout the year rather than stay flat.
What is the average Airbnb daily rate in Yeongheung-myeon?
Listings in Yeongheung-myeon average $218 per night. The broader pricing spread also matters: lower-performing listings cluster closer to the lower quartiles, while premium homes can price materially above the city average when demand spikes or listing quality stands out.
How many Airbnb listings are active in Yeongheung-myeon?
Yeongheung-myeon currently has about 20 active Airbnb listings in AirROI's market dataset. That supply count helps explain how competitive the market is, how much depth there is for benchmarking, and whether the market behaves like a niche destination or a scaled urban market.
How strict are short-term rental regulations in Yeongheung-myeon?
AirROI currently classifies the short-term rental regulation level in Yeongheung-myeon as High. The dataset also shows about 95.0% of listings with registration evidence. That is a market signal, not legal advice, so hosts should still confirm current licensing and compliance rules locally before listing.
What is the RevPAR for Airbnb in Yeongheung-myeon?
RevPAR in Yeongheung-myeon is about N/A. That metric combines pricing and occupancy into one efficiency number, so it is often a better quick benchmark than ADR alone when investors want to compare how well listings convert nightly rates into realized revenue.
Is Airbnb profitable in Yeongheung-myeon?
Occupancy of 12.2% means Yeongheung-myeon is a more selective market. Profitability is achievable but requires careful cost management, premium positioning, or targeting longer stays to reduce turnover. Average annual revenue is $4,819, but individual returns depend on property type, location within the city, and the host's operating efficiency.
How far in advance do guests book Airbnb in Yeongheung-myeon?
The average booking lead time in Yeongheung-myeon is about 16 days — a relatively short booking window, meaning most guests decide within a few weeks of their trip — dynamic pricing can capture late demand. Hosts who understand their market's booking cadence can adjust minimum stays and pricing windows accordingly.
What are the best neighborhoods for Airbnb in Yeongheung-myeon?
Based on AirROI's analysis, some of the top neighborhoods for short-term rentals in Yeongheung-myeon include Yeongheung Island, Ongjin Coast, Heuksando. Each area attracts different guest profiles — from business travelers to leisure visitors — so the best location depends on the property type and target audience a host is aiming for. See the full neighborhood breakdown above.
What type of property performs best on Airbnb in Yeongheung-myeon?
entire_home listings make up 100.0% of the active supply in Yeongheung-myeon. The most common configuration does not always mean the most profitable — operators who identify underserved property types or bedroom counts can sometimes outperform the market average by filling a gap in local supply.
How does Yeongheung-myeon compare to nearby Airbnb markets?
Among neighboring markets, Wondeok-ri posts $26,841 in average annual revenue with 37.6% occupancy, compared to Yeongheung-myeon's $4,819 and 12.2%. Comparing nearby markets helps investors understand whether a destination's performance reflects local demand or broader regional trends.
When is the peak season for Airbnb in Yeongheung-myeon?
May is the highest-revenue month in Yeongheung-myeon, while November is the softest. The revenue spread between them indicates a highly seasonal market — revenue in the peak month is more than double the low month, so cash-flow planning and pricing automation are critical.
About AirROI Market Data
AirROI tracks over 20 million properties across 190+ countries and maintains 15+ years of historical performance data, making it one of the deepest Airbnb and STR intelligence platforms available. The analytics pipeline aggregates listing-level data monthly — revenue, occupancy, nightly rates, RevPAR, guest demographics, booking patterns, and competitive supply — so investors and operators can benchmark any market against its own history and against neighboring destinations.
Real estate investors, property managers, financial institutions, hedge funds, tourism boards, hospitality consultants, tech platforms, and academic researchers rely on AirROI data to underwrite acquisitions, optimize pricing, model macro trends, and conduct peer-reviewed research. Data is available through in-depth market reports like this one and the Airbnb API with 22 endpoints and an Airbnb MCP Server for AI agents.
AirROI proprietary analytics as of 2025-05-31. Metrics reflect trailing twelve-month aggregates from active listings. Revenue figures are market averages, not projections. Neighborhood descriptions are AI-generated and reviewed for accuracy. For full methodology, see the data methodology page.