Victoria, Labuan Airbnb Market Data 2025: STR Report & Statistics
How much can you earn on Airbnb in Victoria, Labuan? Based on AirROI's 2025 dataset (June 2024 – May 2025), the short answer is $2,225 per year — at a $40 nightly rate, 17.9% occupancy, and a N/A RevPAR.
With just 20 active listings, Victoria is a micro-market where selective demand that rewards strong listing quality and pricing strategy. The market trimmed 13.0% of its supply as weaker listings exited. For hosts in Victoria, fewer competitors means an opportunity to capture share through operational excellence, smart pricing, and tapping underserved guest segments before the next growth cycle.
Regulation is low, reducing the compliance barrier — though local ordinances should still be verified. In a market this size, differentiated listings with strong reviews can capture outsized returns relative to the competition.

Table of Contents [hide] [show]
What Are the Key Airbnb Metrics in Victoria?
In Victoria, the headline Airbnb metrics are $2,225 in average annual revenue,17.9% occupancy, $40 ADR, and $0 in RevPAR, and guests book about 11 days in advance.
How Much Do Airbnb Hosts Earn Monthly in Victoria?
Understanding the monthly revenue variations for Airbnb listings in Victoria is key to maximizing your short term rental income potential. Seasonality significantly impacts earnings. Our analysis, based on data from the past 12 months, shows that the peak revenue month for STRs in Victoria is typically December, while March often presents the lowest earnings, highlighting opportunities for strategic pricing adjustments during shoulder and low seasons. Explore the typical Airbnb income in Victoria across different performance tiers:
- Best-in-class properties (Top 10%) achieve $740+ monthly, often utilizing dynamic pricing and superior guest experiences.
- Strong performing properties (Top 25%) earn $457 or more, indicating effective management and desirable locations/amenities.
- Typical properties (Median) generate around $273 per month, representing the average market performance.
- Entry-level properties (Bottom 25%) see earnings around $108, often with potential for optimization.
Average Monthly Airbnb Earnings Trend in Victoria
What Is the Monthly Airbnb Occupancy Rate in Victoria?
Maximize your bookings by understanding the Victoria STR occupancy trends. Seasonal demand shifts significantly influence how often properties are booked. Typically, Julysees the highest demand (peak season occupancy), while March experiences the lowest (low season). Effective strategies, like adjusting minimum stays or offering promotions, can boost occupancy during slower periods. Here's how different property tiers perform in Victoria:
- Best-in-class properties (Top 10%) achieve 37%+ occupancy, indicating high desirability and potentially optimized availability.
- Strong performing properties (Top 25%) maintain 27% or higher occupancy, suggesting good market fit and guest satisfaction.
- Typical properties (Median) have an occupancy rate around 17%.
- Entry-level properties (Bottom 25%) average 10% occupancy, potentially facing higher vacancy.
Average Monthly Occupancy Rate Trend in Victoria
What Is the Average Airbnb Nightly Rate in Victoria?
Effective short term rental pricing strategy in Victoria involves understanding monthly ADR fluctuations. The Average Daily Rate (ADR) for Airbnb in Victoria typically peaks in November and dips lowest during January. Leveraging Airbnb dynamic pricing tools or strategies based on this seasonality can significantly boost revenue. Here's a look at the typical nightly rates achieved:
- Best-in-class properties (Top 10%) command rates of $116+ per night, often due to premium features or locations.
- Strong performing properties (Top 25%) achieve nightly rates of $70 or more.
- Typical properties (Median) charge around $44 per night.
- Entry-level properties (Bottom 25%) earn around $21 per night.
Average Daily Rate (ADR) Trend by Month in Victoria
What Is the RevPAR for Airbnb in Victoria?
RevPAR in Victoria is currently N/A. Because RevPAR combines nightly rates with realized occupancy, it is one of the cleanest ways to compare how efficiently listings turn demand into revenue across the market.
- Entry-level properties (Bottom 25%) see N/A RevPAR.
- Typical properties (Median) generate N/A RevPAR.
- Strong performers (Top 25%) earn N/A RevPAR.
- Best-in-class (Top 10%) achieve N/A RevPAR.
Average Monthly RevPAR Trend in Victoria
RevPAR Insights for Victoria
- RevPAR peaks in Jan and bottoms out in Jan, mirroring the broader seasonal demand pattern and suggesting opportunities for dynamic pricing.
Recommendations for Hosts
- Track your own RevPAR monthly against these Victoria benchmarks. If your RevPAR falls below the median of N/A, examine whether low occupancy or low ADR is the primary drag.
- Use RevPAR rather than revenue alone when comparing properties of different sizes — it normalizes for available nights and gives a more accurate picture of performance.
Get Live Victoria Market Intelligence 👇
Explore Real-time Analytics
When Is the Peak Season for Airbnb in Victoria?
Victoria's peak Airbnb season falls in December, July, February, while the softest stretch is March, June, September. Overall, the market shows highly seasonal trends requiring careful strategy, which should guide pricing, minimum stays, and cash-flow planning.
Peak Season (December, July, February)
- Revenue averages $447 per month
- Occupancy rates average 25.5%
- Daily rates average $68
Shoulder Season
- Revenue averages $340 per month
- Occupancy maintains around 19.1%
- Daily rates hold near $62
Low Season (March, June, September)
- Revenue drops to average $222 per month
- Occupancy decreases to average 13.6%
- Daily rates adjust to average $68
Seasonality Insights for Victoria
- Airbnb seasonality in Victoria is pronounced. Revenue swings sharply between peak and low months, which means pricing strategy, minimum-stay settings, and cash reserves all need to account for extended slower periods.
- During the high season, the absolute peak month showcases Victoria's highest earning potential, with monthly revenues climbing to $474, occupancy reaching 26.8%, and ADRs peaking at $81.
- Conversely, the slowest single month marks the market's lowest point — revenue may dip to $203, occupancy could drop to 10.3%, and ADRs may adjust to $42.
- Lower occupancy paired with meaningful seasonality means hosts in Victoria need to maximize every peak-season booking and seriously consider whether off-season pricing adjustments or minimum-stay changes can capture incremental revenue.
Seasonal Strategies for Maximizing Profit
- Peak Season: Maximize revenue through premium pricing and potentially longer minimum stays. Ensure high availability and consider tightening cancellation policies to reduce last-minute gaps.
- Low Season: Offer competitive pricing, extended-stay discounts, and flexible cancellation policies. Target off-season travelers like remote workers, budget-conscious guests, and travelers with flexible schedules.
- Shoulder Seasons: Implement dynamic pricing that bridges peak and low rates. Target weekend travelers, local events, and business visitors. Slightly more flexible terms than peak season can help maintain occupancy without deep discounting.
- In a highly seasonal market like Victoria, building a cash reserve during the top months is essential for covering fixed costs during the slow period. Automated pricing tools can help capture demand shifts in real time.
Do You Need a License for Airbnb in Victoria?
While Victoria, Labuan, Malaysia currently shows low STR regulations, 5% of listings carry registration evidence — suggesting some hosts proactively register or that certain neighborhoods have their own rules. Checking local zoning and tax obligations before listing is still wise. Always verify the latest short-term rental regulations and Airbnb license requirements directly with local government authorities for Victoria to ensure full compliance before hosting.
(Source: AirROI data, 2026, based on 5% licensed listings)
What Are the Best Neighborhoods for Airbnb in Victoria?
With a compact short-term rental market, Victoria gives early-mover hosts an advantage in the right neighborhoods. The areas listed below are where guest demand and local attractions converge — a useful lens for investors evaluating whether to enter this market and where to position their listing.
| Neighborhood / Area | Why Host Here? (Target Guests & Appeal) | Key Attractions & Landmarks |
|---|---|---|
| Kota Kinabalu | The capital of Sabah is a popular gateway for tourists, with stunning beaches and nearby nature parks. It's an attractive investment location due to its growing tourism sector. | Tunku Abdul Rahman Marine Park, Mount Kinabalu, Gaya Street Sunday Market, Kota Kinabalu City Mosque, Mamutik Island |
| Langkawi | A well-known island destination famous for its beautiful beaches and luxury resorts. It's an ideal location for beach lovers and those seeking adventure. | Langkawi Sky Bridge, Pantai Cenang Beach, Langkawi Cable Car, Kilim Karst Geoforest Park, Underwater World Langkawi |
| George Town | The capital of Penang, known for its historical sites, street art, and diverse cuisine. It's a UNESCO World Heritage site and a hub for cultural tourism. | Street Art of George Town, Penang Hill, Cheong Fatt Tze Mansion, Kek Lok Si Temple, Penang Peranakan Mansion |
| Cameron Highlands | A cool highland area, known for its tea plantations and colonial architecture, attracting tourists seeking respite from the tropical heat. | Boh Tea Plantation, Cameron Lavender Garden, Strawberry Farms, Cameron Highlands Butterfly Garden, Mossy Forest |
| Malacca City | A historically rich city with Portuguese, Dutch, and British influences. Popular with tourists exploring Malaysia's history and culture. | A Famosa, St. Paul's Hill, Jonker Street, Melaka Sultanate Palace, Christ Church |
| Putrajaya | The federal administrative center of Malaysia, showcasing modern architecture and beautiful landscapes. It attracts business travelers and government officials. | Perdana Putra, Putra Mosque, Putrajaya Lake, Putrajaya Botanical Garden, Millennium Monument |
| Kuching | The capital of Sarawak, known for its rich cultural heritage and natural attractions. It serves as a base for exploring Borneo's jungles. | Bako National Park, Sarawak Cultural Village, Kuching Waterfront, Semenggoh Nature Reserve, Cat Statue |
| Ipoh | A city known for its colonial architecture, food scene, and cave temples. It's increasingly popular among domestic tourists looking for weekend getaways. | Gunung Lang Recreational Park, Perak Cave Temple, Kellie's Castle, Concubine Lane, Ipoh Street Art |
With 8 distinct neighborhoods showing meaningful short-term rental activity, Victoria offers diversification within a single market. Investors can tailor their strategy — from high-turnover tourist zones to quieter residential areas that attract longer stays and remote workers.
What Types of Properties Are on Airbnb in Victoria?
Room Type Distribution
Property Type Distribution
Market Composition Insights for Victoria
- The Victoria Airbnb market composition is heavily skewed towards Private Room listings, which make up 50% of the 20 active rentals. This indicates strong guest preference for privacy and space.
- Looking at the property type distribution in Victoria, Hotel/Boutique properties are the most common (55%), reflecting the local real estate landscape.
- Houses represent a significant 25% portion, catering likely to families or larger groups.
- The presence of 55% Hotel/Boutique listings indicates integration with traditional hospitality.
Victoria Airbnb Room Capacity Analysis (2026): Bedroom Distribution
Distribution of Listings by Number of Bedrooms
Room Capacity Insights for Victoria
- The dominant room capacity in Victoria is 1 bedroom listings, making up 45% of the market. This suggests a strong demand for properties suitable for couples or solo travelers.
- Together, 1 bedroom and 2 bedrooms properties represent 70.0% of the active Airbnb listings in Victoria, indicating a high concentration in these sizes.
- A significant 30.0% of listings offer 3+ bedrooms, catering to larger groups and families seeking more space in Victoria.
Victoria Vacation Rental Guest Capacity Trends (2026)
Distribution of Listings by Guest Capacity
Guest Capacity Insights for Victoria
- The most common guest capacity trend in Victoria vacation rentals is listings accommodating 8+ guests (25%). This suggests the primary traveler segment is likely larger groups.
- Properties designed for 8+ guests and 2 guests dominate the Victoria STR market, accounting for 50.0% of listings.
- 45.0% of properties accommodate 6+ guests, serving the market segment for larger families or group travel in Victoria.
- On average, properties in Victoria are equipped to host 5.1 guests.
What Amenities Do Airbnb Guests Expect in Victoria?
Amenity Prevalence
Amenity Insights for Victoria
- Essential amenities in Victoria that guests expect include: Air conditioning, Kitchen, TV, Wifi, Washer. Lacking these (any) could significantly impact bookings.
- Popular amenities like Essentials, Hot water, Carbon monoxide alarm are common but not universal. Offering these can provide a competitive edge.
Recommendations for Hosts
- Ensure your listing includes all essential amenities for Victoria: Air conditioning, Kitchen, TV, Wifi, Washer.
- Prioritize adding missing essentials: Washer.
- Consider adding popular differentiators like Essentials or Hot water to increase appeal.
- Highlight unique or less common amenities you offer (e.g., hot tub, dedicated workspace, EV charger) in your listing description and photos.
- Regularly check competitor amenities in Victoria to stay competitive.
Dive Deeper: Advanced Victoria STR Market Data (2026)
Ready to unlock more insights? AirROI provides access to advanced metrics and comprehensive Airbnb data for Victoria. Explore detailed analytics beyond this report to refine your investment strategy, optimize pricing, and maximize your vacation rental profits.
Explore Advanced MetricsVictoria Airbnb Guest Demographics & Profile Analysis (2026)
Guest Profile Summary for Victoria
- The typical guest profile for Airbnb in Victoria consists of primarily domestic travelers (68%), often arriving from nearby Kota Kinabalu, typically belonging to the Post-2000s (Gen Z/Alpha) group (50%), primarily speaking English or Malay.
- Domestic travelers account for 68.4% of guests.
- Key international markets include Malaysia (68.4%) and Japan (10.5%).
- Top languages spoken are English (38.5%) followed by Malay (34.6%).
- A significant demographic segment is the Post-2000s (Gen Z/Alpha) group, representing 50% of guests.
Recommendations for Hosts
- Target domestic marketing efforts towards travelers from Kota Kinabalu and Kuala Lumpur.
- Tailor amenities and listing descriptions to appeal to the dominant Post-2000s (Gen Z/Alpha) demographic (e.g., highlight fast WiFi, smart home features, local guides).
- Highlight unique local experiences or amenities relevant to the primary guest profile.
- Consider seasonal promotions aligned with peak travel times for key origin markets.
Victoria Airbnb Booking Patterns (2026): Available vs. Booked Days
Available Days Distribution
Booked Days Distribution
Booking Pattern Insights for Victoria
- The most common availability pattern in Victoria falls within the 271-366 days range, representing 85% of listings. This suggests many properties have significant open periods on their calendars.
- Approximately 100.0% of listings show high availability (181+ days open annually), indicating potential for increased bookings or specific owner usage patterns.
- For booked days, the 1-30 days range is most frequent in Victoria (50%), reflecting common guest stay durations or potential owner blocking patterns.
How Far in Advance Do Guests Book Airbnb in Victoria?
Average Booking Lead Time by Month
Booking Lead Time Insights for Victoria
- The overall average booking lead time for vacation rentals in Victoria is 11 days.
- Guests book furthest in advance for stays during January (average 20 days), likely coinciding with peak travel demand or local events.
- The shortest booking windows occur for stays in September (average 7 days), indicating more last-minute travel plans during this time.
- Seasonally, Winter (16 days avg.) sees the longest lead times, while Fall (12 days avg.) has the shortest, reflecting typical travel planning cycles.
Recommendations for Hosts
- Use the overall average lead time (11 days) as a baseline for your pricing and availability strategy in Victoria.
- Target marketing efforts for the Winter season well in advance (at least 16 days) to capture early planners.
- Monitor your own booking lead times against these Victoria averages to identify opportunities for dynamic pricing adjustments.
Victoria Airbnb Minimum Stay Requirements Analysis
Distribution of Listings by Minimum Night Requirement
1 Night
17 listings
89.5% of total
30+ Nights
2 listings
10.5% of total
Key Insights
- The most prevalent minimum stay requirement in Victoria is 1 Night, adopted by 89.5% of listings. This highlights the market's preference for shorter, flexible bookings.
- A strong majority (89.5%) of the Victoria Airbnb data shows acceptance of very short stays (1-2 nights), indicating a dynamic, high-turnover market.
- A significant segment (10.5%) caters to monthly stays (30+ nights) in Victoria, pointing to opportunities in the extended-stay market.
Recommendations
- Align with the market by considering a 1 Night minimum stay, as 89.5% of Victoria hosts use this setting.
- Explore offering discounts for stays of 30+ nights to attract the 10.5% of the market seeking extended stays.
- Adjust minimum nights based on seasonality – potentially shorter during low season and longer during peak demand periods in Victoria.
Victoria Airbnb Cancellation Policy Trends Analysis (2026)
Flexible
4 listings
50% of total
Moderate
2 listings
25% of total
Strict
2 listings
25% of total
Cancellation Policy Insights for Victoria
- The prevailing Airbnb cancellation policy trend in Victoria is Flexible, used by 50% of listings.
- The market strongly favors guest-friendly terms, with 75.0% of listings offering Flexible or Moderate policies. This suggests guests in Victoria may expect booking flexibility.
Recommendations for Hosts
- Consider adopting a Flexible policy to align with the 50% market standard in Victoria.
- Regularly review your cancellation policy against competitors and market demand shifts in Victoria.
What Do the Top Airbnb Listings in Victoria Look Like?
Benchmark your potential! Explore examples of top-performing Airbnb properties in Victoriabased on Trailing Twelve Month (TTM) revenue. Analyze their characteristics, revenue, occupancy rate, and ADR to understand what drives success in this market.
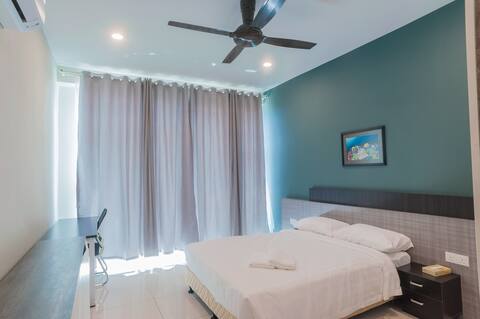
C Residence at Labuan City
Entire Place • 3 bedrooms

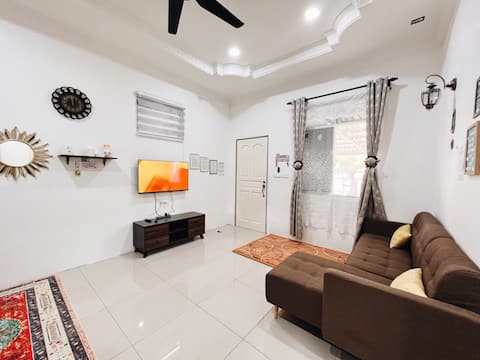
Labuan Cozy Club House
Entire Place • 2 bedrooms
New in Town! 2BR Rad Homestay
Entire Place • 2 bedrooms
C Residence Labuan Town area
Entire Place • 3 bedrooms
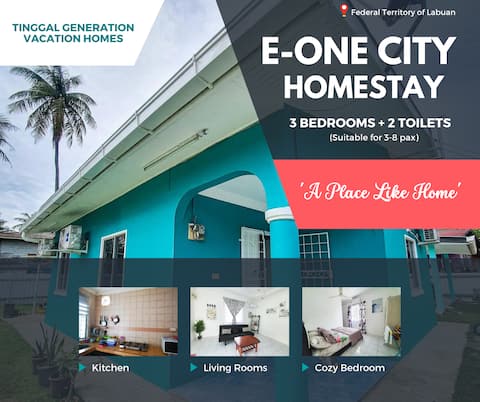
Cozy-Bnb @ Town (3 Rooms) Nearest to Airport/Town
Entire Place • 3 bedrooms
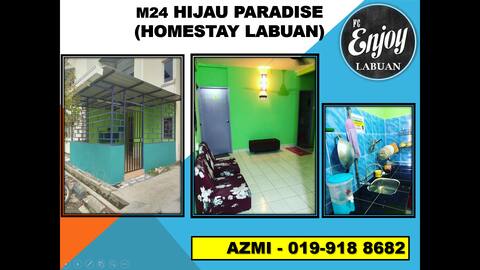
homestay labuan rumah hijau m24 mutiara vvip
Entire Place • 4 bedrooms
Note: Performance varies based on location, size, amenities, seasonality, and management quality. Data reflects the past 12 months.
Who Are the Top Airbnb Hosts in Victoria?
Learn from the best! This table showcases top-performing Airbnb hosts in Victoria based on the number of properties managed and estimated total revenue over the past year. Analyze their scale and performance metrics.
| Host Name | Properties | Grossing Revenue | Stay Reviews | Avg Rating |
|---|---|---|---|---|
| Eric | 2 | $12,736 | 127 | 4.94/5.0 |
| Aeffa | 3 | $12,002 | 49 | 4.70/5.0 |
| Host #66995106 | 1 | $8,069 | 2 | Not Rated |
| Host #484866751 | 2 | $6,544 | 0 | Not Rated |
| Siti Zarina | 11 | $2,788 | 16 | 4.27/5.0 |
| Host #526280597 | 1 | $2,351 | 0 | Not Rated |
Analyzing the strategies of top hosts, such as their property selection, pricing, and guest communication, can offer valuable lessons for optimizing your own Airbnb operations in Victoria.
How Does Victoria's Airbnb Market Compare to Nearby Cities?
How does the Victoria Airbnb market stack up against its neighbors? Compare key performance metrics like average monthly revenue, ADR, and occupancy rates in surrounding areas to understand the broader regional STR landscape.
Compared with Tanjung Aru, Victoria has 19 percentage points lower occupancy and about $22 lower ADR. That helps frame whether this market is winning more on demand, pricing, or both.
| Market | Active Properties | Monthly Revenue | Daily Rate | Avg. Occupancy |
|---|---|---|---|---|
| Kampung Mesilau | 38 | $1,155 | $144.74 | 30% |
| Kundasang | 20 | $1,010 | $138.17 | 31% |
| CINTA MATA | 13 | $870 | $137.69 | 25% |
| Kampung Sembulan Lama | 190 | $693 | $114.41 | 30% |
| Kudat | 19 | $612 | $124.09 | 23% |
| Dumpiring Atas | 11 | $608 | $74.70 | 22% |
| Kota Kinabalu | 1,631 | $605 | $81.81 | 34% |
| Tanjung Aru | 206 | $583 | $61.57 | 37% |
| Api-Api Center | 52 | $463 | $71.24 | 31% |
| Putatan | 11 | $277 | $51.45 | 24% |
Frequently Asked Questions About Airbnb in Victoria
These quick answers summarize the most common investor and operator questions using AirROI's latest market data for Victoria.
How much do Airbnb hosts make in Victoria?
Victoria hosts earn about $2,225 per year on average, with an average nightly rate of $40 and RevPAR of N/A. Those figures describe the typical revenue environment for active listings in Victoria, Labuan, not the ceiling for the best operators. Source: AirROI 2025 data, Victoria market, June 2024 to May 2025.
What is the average Airbnb occupancy rate in Victoria?
The average Airbnb occupancy rate in Victoria is 17.9%. December is the strongest month and March is the softest, so hosts should expect demand to move meaningfully throughout the year rather than stay flat.
What is the average Airbnb daily rate in Victoria?
Listings in Victoria average $40 per night. The broader pricing spread also matters: lower-performing listings cluster closer to the lower quartiles, while premium homes can price materially above the city average when demand spikes or listing quality stands out.
How many Airbnb listings are active in Victoria?
Victoria currently has about 20 active Airbnb listings in AirROI's market dataset. That supply count helps explain how competitive the market is, how much depth there is for benchmarking, and whether the market behaves like a niche destination or a scaled urban market.
How strict are short-term rental regulations in Victoria?
AirROI currently classifies the short-term rental regulation level in Victoria as Low. The dataset also shows about 5.0% of listings with registration evidence. That is a market signal, not legal advice, so hosts should still confirm current licensing and compliance rules locally before listing.
What is the RevPAR for Airbnb in Victoria?
RevPAR in Victoria is about N/A. That metric combines pricing and occupancy into one efficiency number, so it is often a better quick benchmark than ADR alone when investors want to compare how well listings convert nightly rates into realized revenue.
Is Airbnb profitable in Victoria?
Occupancy of 17.9% means Victoria is a more selective market. Profitability is achievable but requires careful cost management, premium positioning, or targeting longer stays to reduce turnover. Average annual revenue is $2,225, but individual returns depend on property type, location within the city, and the host's operating efficiency.
How far in advance do guests book Airbnb in Victoria?
The average booking lead time in Victoria is about 11 days — a relatively short booking window, meaning most guests decide within a few weeks of their trip — dynamic pricing can capture late demand. Hosts who understand their market's booking cadence can adjust minimum stays and pricing windows accordingly.
What are the best neighborhoods for Airbnb in Victoria?
Based on AirROI's analysis, some of the top neighborhoods for short-term rentals in Victoria include Kota Kinabalu, Langkawi, George Town. Each area attracts different guest profiles — from business travelers to leisure visitors — so the best location depends on the property type and target audience a host is aiming for. See the full neighborhood breakdown above.
What type of property performs best on Airbnb in Victoria?
private_room listings make up 50.0% of the active supply in Victoria. The most common configuration does not always mean the most profitable — operators who identify underserved property types or bedroom counts can sometimes outperform the market average by filling a gap in local supply.
How does Victoria compare to nearby Airbnb markets?
Among neighboring markets, Kampung Mesilau posts $13,863 in average annual revenue with 29.9% occupancy, compared to Victoria's $2,225 and 17.9%. Comparing nearby markets helps investors understand whether a destination's performance reflects local demand or broader regional trends.
When is the peak season for Airbnb in Victoria?
December is the highest-revenue month in Victoria, while March is the softest. The revenue spread between them indicates moderate seasonality with a clear peak period, giving hosts opportunities to maximize rates during high demand without facing dramatic off-season drops.
About AirROI Market Data
AirROI tracks over 20 million properties across 190+ countries and maintains 15+ years of historical performance data, making it one of the deepest Airbnb and STR intelligence platforms available. The analytics pipeline aggregates listing-level data monthly — revenue, occupancy, nightly rates, RevPAR, guest demographics, booking patterns, and competitive supply — so investors and operators can benchmark any market against its own history and against neighboring destinations.
Real estate investors, property managers, financial institutions, hedge funds, tourism boards, hospitality consultants, tech platforms, and academic researchers rely on AirROI data to underwrite acquisitions, optimize pricing, model macro trends, and conduct peer-reviewed research. Data is available through in-depth market reports like this one and the Airbnb API with 22 endpoints and an Airbnb MCP Server for AI agents.
AirROI proprietary analytics as of 2025-05-31. Metrics reflect trailing twelve-month aggregates from active listings. Revenue figures are market averages, not projections. Neighborhood descriptions are AI-generated and reviewed for accuracy. For full methodology, see the data methodology page.