Werribee, Victoria Airbnb Market Data 2026: STR Report & Statistics
How much can you earn on Airbnb in Werribee, Victoria? Based on AirROI's 2026 dataset (July 2025 – June 2026), the short answer is $12,768 per year — at a $147 nightly rate, 39.7% occupancy, and a $60 RevPAR that reflects moderate rate-to-revenue efficiency with room to optimize.
With just 25 active listings, Werribee is a micro-market where moderate demand with room for well-positioned listings to outperform.
Regulation is low with minimal registration requirements, pointing to an operator-friendly environment. In a market this size, differentiated listings with strong reviews can capture outsized returns relative to the competition.
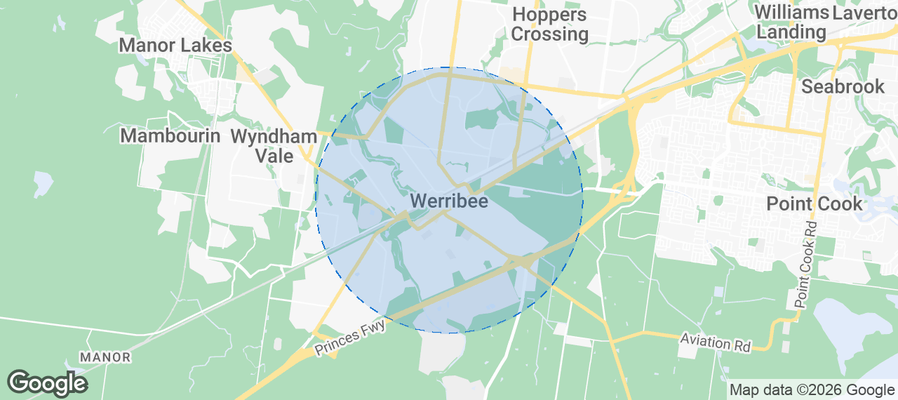
Table of Contents [hide] [show]
What Are the Key Airbnb Metrics in Werribee?
In Werribee, the headline Airbnb metrics are $12,768 in average annual revenue,39.7% occupancy, $147 ADR, and $60 in RevPAR, and guests book about 22 days in advance.
How Much Do Airbnb Hosts Earn Monthly in Werribee?
Understanding the monthly revenue variations for Airbnb listings in Werribee is key to maximizing your short term rental income potential. Seasonality significantly impacts earnings. Our analysis, based on data from the past 12 months, shows that the peak revenue month for STRs in Werribee is typically February, while May often presents the lowest earnings, highlighting opportunities for strategic pricing adjustments during shoulder and low seasons. Explore the typical Airbnb income in Werribee across different performance tiers:
- Best-in-class properties (Top 10%) achieve $3,955+ monthly, often utilizing dynamic pricing and superior guest experiences.
- Strong performing properties (Top 25%) earn $3,034 or more, indicating effective management and desirable locations/amenities.
- Typical properties (Median) generate around $1,685 per month, representing the average market performance.
- Entry-level properties (Bottom 25%) see earnings around $634, often with potential for optimization.
Average Monthly Airbnb Earnings Trend in Werribee
What Is the Monthly Airbnb Occupancy Rate in Werribee?
Maximize your bookings by understanding the Werribee STR occupancy trends. Seasonal demand shifts significantly influence how often properties are booked. Typically, Novembersees the highest demand (peak season occupancy), while May experiences the lowest (low season). Effective strategies, like adjusting minimum stays or offering promotions, can boost occupancy during slower periods. Here's how different property tiers perform in Werribee:
- Best-in-class properties (Top 10%) achieve 80%+ occupancy, indicating high desirability and potentially optimized availability.
- Strong performing properties (Top 25%) maintain 67% or higher occupancy, suggesting good market fit and guest satisfaction.
- Typical properties (Median) have an occupancy rate around 45%.
- Entry-level properties (Bottom 25%) average 19% occupancy, potentially facing higher vacancy.
Average Monthly Occupancy Rate Trend in Werribee
What Is the Average Airbnb Nightly Rate in Werribee?
Effective short term rental pricing strategy in Werribee involves understanding monthly ADR fluctuations. The Average Daily Rate (ADR) for Airbnb in Werribee typically peaks in March and dips lowest during August. Leveraging Airbnb dynamic pricing tools or strategies based on this seasonality can significantly boost revenue. Here's a look at the typical nightly rates achieved:
- Best-in-class properties (Top 10%) command rates of $259+ per night, often due to premium features or locations.
- Strong performing properties (Top 25%) achieve nightly rates of $196 or more.
- Typical properties (Median) charge around $149 per night.
- Entry-level properties (Bottom 25%) earn around $87 per night.
Average Daily Rate (ADR) Trend by Month in Werribee
What Is the RevPAR for Airbnb in Werribee?
RevPAR in Werribee is currently $60. Because RevPAR combines nightly rates with realized occupancy, it is one of the cleanest ways to compare how efficiently listings turn demand into revenue across the market.
- Entry-level properties (Bottom 25%) see $25 RevPAR.
- Typical properties (Median) generate $52 RevPAR.
- Strong performers (Top 25%) earn $85 RevPAR.
- Best-in-class (Top 10%) achieve $117 RevPAR.
Average Monthly RevPAR Trend in Werribee
RevPAR Insights for Werribee
- The average RevPAR in Werribee is $60. This metric combines nightly rates with realized occupancy, making it one of the best single-number indicators of market efficiency.
- The gap between the top 10% ($117) and bottom 25% ($25) is $92, suggesting a relatively compressed market where operational differences yield moderate returns.
- RevPAR peaks in Feb and bottoms out in May, mirroring the broader seasonal demand pattern and suggesting opportunities for dynamic pricing.
Recommendations for Hosts
- Track your own RevPAR monthly against these Werribee benchmarks. If your RevPAR falls below the median of $52, examine whether low occupancy or low ADR is the primary drag.
- Top-quartile listings achieve $85+ RevPAR through a combination of competitive pricing, strong reviews, and strategic amenities. Target this tier through incremental improvements.
- Use RevPAR rather than revenue alone when comparing properties of different sizes — it normalizes for available nights and gives a more accurate picture of performance.
Get Live Werribee Market Intelligence 👇
Explore Real-time Analytics
When Is the Peak Season for Airbnb in Werribee?
Werribee's peak Airbnb season falls in February, March, September, while the softest stretch is April, May, June. Overall, the market shows moderate seasonality with distinct peak and low periods, which should guide pricing, minimum stays, and cash-flow planning.
Peak Season (February, March, September)
- Revenue averages $2,367 per month
- Occupancy rates average 51.3%
- Daily rates average $154
Shoulder Season
- Revenue averages $2,119 per month
- Occupancy maintains around 48.6%
- Daily rates hold near $146
Low Season (April, May, June)
- Revenue drops to average $1,425 per month
- Occupancy decreases to average 34.4%
- Daily rates adjust to average $151
Seasonality Insights for Werribee
- The Airbnb seasonality pattern in Werribee shows moderate seasonality with distinct peak and low periods. While the sections above show seasonal averages, it is also insightful to look at the extremes:
- During the high season, the absolute peak month showcases Werribee's highest earning potential, with monthly revenues climbing to $2,433, occupancy reaching 53.8%, and ADRs peaking at $168.
- Conversely, the slowest single month marks the market's lowest point — revenue may dip to $1,180, occupancy could drop to 31.2%, and ADRs may adjust to $140.
- Lower occupancy paired with meaningful seasonality means hosts in Werribee need to maximize every peak-season booking and seriously consider whether off-season pricing adjustments or minimum-stay changes can capture incremental revenue.
Seasonal Strategies for Maximizing Profit
- Peak Season: Maximize revenue through premium pricing and potentially longer minimum stays. Ensure high availability and consider tightening cancellation policies to reduce last-minute gaps.
- Low Season: Offer competitive pricing, extended-stay discounts, and flexible cancellation policies. Target off-season travelers like remote workers, budget-conscious guests, and travelers with flexible schedules.
- Shoulder Seasons: Implement dynamic pricing that bridges peak and low rates. Target weekend travelers, local events, and business visitors. Slightly more flexible terms than peak season can help maintain occupancy without deep discounting.
- Regularly analyze your own performance against these Werribee seasonality benchmarks and adjust your pricing and availability strategy accordingly.
Do You Need a License for Airbnb in Werribee?
Low regulation and minimal registration activity in Werribee, Victoria, Australia point to an operator-friendly environment. That said, even low-regulation markets may have tax collection requirements, safety standards, or HOA rules that affect short-term rental operations. Always verify the latest short-term rental regulations and Airbnb license requirements directly with local government authorities for Werribee to ensure full compliance before hosting.
(Source: AirROI data, 2026, finding no licensed listings among those analyzed)
What Are the Best Neighborhoods for Airbnb in Werribee?
With a compact short-term rental market, Werribee gives early-mover hosts an advantage in the right neighborhoods. The areas listed below are where guest demand and local attractions converge — a useful lens for investors evaluating whether to enter this market and where to position their listing.
| Neighborhood / Area | Why Host Here? (Target Guests & Appeal) | Key Attractions & Landmarks |
|---|---|---|
| Werribee Park | A historical area known for its stunning gardens and architecture. It attracts visitors interested in culture, history, and the outdoors. | Werribee Mansion, Victoria State Rose Garden, Werribee Open Range Zoo, Point Cook Coastal Park, Werribee River |
| Werribee South | Located along the picturesque coastline, this area offers great views and beach access, perfect for summer getaways and outdoor enthusiasts. | Werribee South Beach, Bona Vista Farm, The Port of Melbourne, K Road Cliffs, Werribee River Park |
| Shadowfax Wines | This vineyard area draws wine enthusiasts and couples looking for a romantic getaway or a unique dining experience in a serene setting. | Shadowfax Winery, Wine Tasting Tours, Lavender Farm, Yering Station, Chateau Yering |
| Werribee City Centre | The bustling heart of Werribee with shops, restaurants, and nightlife, making it ideal for visitors wanting a vibrant urban experience. | Werribee Plaza, Local restaurants and cafes, Werribee railway station, Werribee markets, Street art |
| Etihad Estate | A new residential area close to Werribee with modern amenities and parks, attracting families and long-term visitors. | Parks and playgrounds, Local shops, Community events, Access to Werribee River cycles paths, Nearby schools and facilities |
| Eaglehawk, | N/A |
With 6 distinct neighborhoods showing meaningful short-term rental activity, Werribee offers diversification within a single market. Investors can tailor their strategy — from high-turnover tourist zones to quieter residential areas that attract longer stays and remote workers.
What Types of Properties Are on Airbnb in Werribee?
Room Type Distribution
Property Type Distribution
Market Composition Insights for Werribee
- The Werribee Airbnb market composition is heavily skewed towards Entire Home/Apt listings, which make up 80% of the 25 active rentals. This indicates strong guest preference for privacy and space.
- Looking at the property type distribution in Werribee, House properties are the most common (92%), reflecting the local real estate landscape.
- Houses represent a significant 92% portion, catering likely to families or larger groups.
- The presence of 8% Hotel/Boutique listings indicates integration with traditional hospitality.
Werribee Airbnb Room Capacity Analysis (2026): Bedroom Distribution
Distribution of Listings by Number of Bedrooms
Room Capacity Insights for Werribee
- The dominant room capacity in Werribee is 3 bedrooms listings, making up 40% of the market. This suggests a strong demand for properties suitable for families or small groups.
- Together, 3 bedrooms and 1 bedroom properties represent 64.0% of the active Airbnb listings in Werribee, indicating a high concentration in these sizes.
- A significant 56.0% of listings offer 3+ bedrooms, catering to larger groups and families seeking more space in Werribee.
Werribee Vacation Rental Guest Capacity Trends (2026)
Distribution of Listings by Guest Capacity
Guest Capacity Insights for Werribee
- The most common guest capacity trend in Werribee vacation rentals is listings accommodating 6 guests (32%). This suggests the primary traveler segment is likely larger groups.
- Properties designed for 6 guests and 8+ guests dominate the Werribee STR market, accounting for 52.0% of listings.
- 56.0% of properties accommodate 6+ guests, serving the market segment for larger families or group travel in Werribee.
- On average, properties in Werribee are equipped to host 4.8 guests.
How Do Listings in Werribee Compare on Quality?
Listing quality in Werribee can be approximated through presentation depth, bedroom count, and how often hosts disclose exact locations. These signals show how professionally the local supply base is merchandised.
Listing Quality Insights for Werribee
- At 24.3 photos per listing on average, Werribee hosts invest well in visual presentation. Listings with 20+ photos consistently outperform in search ranking and conversion.
- 24.0% of listings show their exact location. Lower disclosure rates can increase booking hesitation — guests want to know exactly where they are staying.
Recommendations for Hosts
- Enable exact location if possible — it removes a common source of guest uncertainty and can improve your listing's position in map-based searches.
- Use these quality indicators as a self-audit checklist. Listings that exceed the Werribee averages across all three metrics are better positioned for premium pricing.
What Amenities Do Airbnb Guests Expect in Werribee?
Amenity Prevalence
Amenity Insights for Werribee
- Essential amenities in Werribee that guests expect include: Wifi, TV. Lacking these (any) could significantly impact bookings.
- Popular amenities like Heating, Free parking on premises, Air conditioning are common but not universal. Offering these can provide a competitive edge.
Recommendations for Hosts
- Ensure your listing includes all essential amenities for Werribee: Wifi, TV.
- Prioritize adding missing essentials: TV.
- Consider adding popular differentiators like Heating or Free parking on premises to increase appeal.
- Highlight unique or less common amenities you offer (e.g., hot tub, dedicated workspace, EV charger) in your listing description and photos.
- Regularly check competitor amenities in Werribee to stay competitive.
Which Airbnb Amenities Boost Revenue in Werribee?
Not every amenity matters equally. This table focuses on the amenities most associated with higher revenue in Werribee, which makes it more useful for prioritizing upgrades than a simple popularity list alone.
| Amenity | Prevalence | Revenue With | Revenue Without | Revenue Uplift |
|---|---|---|---|---|
Dishes and silverware | 76.0% | $15,735 | $3,370 | 366.9% |
Dining table | 76.0% | $15,622 | $3,729 | 319.0% |
Refrigerator | 80.0% | $14,892 | $4,271 | 248.6% |
Stove | 60.0% | $17,711 | $5,353 | 230.9% |
Essentials | 64.0% | $16,605 | $5,945 | 179.3% |
Freezer | 64.0% | $16,456 | $6,211 | 164.9% |
Dryer | 36.0% | $19,953 | $8,726 | 128.7% |
Clothing storage | 72.0% | $15,147 | $6,649 | 127.8% |
Cooking basics | 64.0% | $15,997 | $7,027 | 127.7% |
Private entrance | 60.0% | $16,411 | $7,302 | 124.7% |
Revenue Impact Insights for Werribee
- Dishes and silverware tops the revenue impact list with a 366.9% uplift — listings with this amenity earn $15,735 vs. $3,370 without it.
Recommendations for Hosts
- Focus your upgrade budget on amenities in the top half of this table. Below-median amenities may improve guest experience but contribute less to revenue growth.
- Highlight revenue-impacting amenities prominently in your listing title, photos, and description — guests can't value what they don't notice.
Dive Deeper: Advanced Werribee STR Market Data (2026)
Ready to unlock more insights? AirROI provides access to advanced metrics and comprehensive Airbnb data for Werribee. Explore detailed analytics beyond this report to refine your investment strategy, optimize pricing, and maximize your vacation rental profits.
Explore Advanced MetricsWerribee Airbnb Guest Demographics & Profile Analysis (2026)
Guest Profile Summary for Werribee
- The typical guest profile for Airbnb in Werribee consists of primarily domestic travelers (80%), often arriving from nearby Melbourne, typically belonging to the Post-2000s (Gen Z/Alpha) group (50%), primarily speaking English or Chinese.
- Domestic travelers account for 80.0% of guests.
- Key international markets include Australia (80%) and New Zealand (3.1%).
- Top languages spoken are English (64.6%) followed by Chinese (5.1%).
- A significant demographic segment is the Post-2000s (Gen Z/Alpha) group, representing 50% of guests.
Recommendations for Hosts
- Target domestic marketing efforts towards travelers from Melbourne and Sydney.
- Tailor amenities and listing descriptions to appeal to the dominant Post-2000s (Gen Z/Alpha) demographic (e.g., highlight fast WiFi, smart home features, local guides).
- Highlight unique local experiences or amenities relevant to the primary guest profile.
- Consider seasonal promotions aligned with peak travel times for key origin markets.
What Are Airbnb Guest Ratings in Werribee?
Listings in Werribee average 4.62 out of 5 overall, with about 21 reviews per active listing and 20.0% of listings carrying the Guest Favorite badge.
Rating Breakdown by Category
Guest Rating Insights for Werribee
- An average rating of 4.62 places Werribee in solid territory. Most guests leave satisfied, though there is room for hosts to push toward the top tier.
- The strongest subcategory is Check-in (4.8), while Cleanliness (4.56) trails behind — a useful signal for hosts looking to prioritize upgrades.
- 20.0% of listings carry the Guest Favorite badge, a strong trust signal that can meaningfully lift click-through and booking rates.
Recommendations for Hosts
- Focus improvement efforts on Cleanliness — even small gains in the weakest subcategory can lift overall ratings and search ranking.
- Encourage guests to leave reviews after checkout. Listings with more reviews rank higher in search results and convert browsers into bookers more effectively.
- With only 20.0% of listings earning Guest Favorite status, hosts who consistently exceed expectations have a clear competitive advantage.
Werribee Airbnb Booking Patterns (2026): Available vs. Booked Days
Available Days Distribution
Booked Days Distribution
Booking Pattern Insights for Werribee
- The most common availability pattern in Werribee falls within the 271-366 days range, representing 68% of listings. This suggests many properties have significant open periods on their calendars.
- Approximately 80.0% of listings show high availability (181+ days open annually), indicating potential for increased bookings or specific owner usage patterns.
- For booked days, the 31-90 days range is most frequent in Werribee (36%), reflecting common guest stay durations or potential owner blocking patterns.
- A notable 20.0% of properties secure long booking periods (181+ days booked per year), highlighting successful long-term rental strategies or significant owner usage.
How Far in Advance Do Guests Book Airbnb in Werribee?
Average Booking Lead Time by Month
Booking Lead Time Insights for Werribee
- The overall average booking lead time for vacation rentals in Werribee is 22 days.
- Guests book furthest in advance for stays during March (average 43 days), likely coinciding with peak travel demand or local events.
- The shortest booking windows occur for stays in June (average 14 days), indicating more last-minute travel plans during this time.
- Seasonally, Spring (29 days avg.) sees the longest lead times, while Summer (15 days avg.) has the shortest, reflecting typical travel planning cycles.
Recommendations for Hosts
- Use the overall average lead time (22 days) as a baseline for your pricing and availability strategy in Werribee.
- For March stays, consider implementing length-of-stay discounts or slightly higher rates for bookings made less than 43 days out to capitalize on advance planning.
- During June, focus on last-minute booking availability and promotions, as guests book with very short notice (14 days avg.).
- Target marketing efforts for the Spring season well in advance (at least 29 days) to capture early planners.
- Monitor your own booking lead times against these Werribee averages to identify opportunities for dynamic pricing adjustments.
What Is the Average Length of Stay for Airbnb in Werribee?
Guests in Werribee stay about 4.9 nights on average, generating roughly 452 reservations and 18.1 bookings per listing in the latest AirROI dataset. The most common check-in time is 3:00 PM and check-out is 10:00 AM.
Monthly Length of Stay in Werribee
Check-in Time Distribution
Check-out Time Distribution
Stay Pattern Insights for Werribee
- A mid-range stay length points to leisure-driven demand — weekend getaways and short vacations. Hosts should optimize for quick turnover efficiency while keeping the guest experience smooth.
- 18.1 bookings per listing is a manageable pace that balances revenue with operational overhead.
- Stay lengths peak in Feb (8.1 nights) and shorten in Oct (2.4 nights). Adjust minimum-night requirements seasonally to match.
Recommendations for Hosts
- With shorter average stays, focus on streamlining turnover. Self-check-in, reliable cleaning crews, and pre-staged amenities can reduce per-booking operational costs.
- Set your check-in time to match or beat the market standard of 3:00 PM. Offering early check-in flexibility can be a low-cost differentiator.
- Monitor length-of-stay seasonality to adjust minimum-night requirements — longer minimums during peak periods maximize revenue while shorter minimums fill gaps in shoulder seasons.
Werribee Airbnb Minimum Stay Requirements Analysis
Distribution of Listings by Minimum Night Requirement
1 Night
7 listings
28% of total
2 Nights
4 listings
16% of total
3 Nights
2 listings
8% of total
4-6 Nights
1 listings
4% of total
7-29 Nights
1 listings
4% of total
30+ Nights
10 listings
40% of total
Key Insights
- The most prevalent minimum stay requirement in Werribee is 30+ Nights, adopted by 40% of listings. This highlights the market's preference for longer commitments.
- A significant segment (40%) caters to monthly stays (30+ nights) in Werribee, pointing to opportunities in the extended-stay market.
Recommendations
- Align with the market by considering a 30+ Nights minimum stay, as 40% of Werribee hosts use this setting.
- If feasible, allowing 1-night stays, especially midweek or during low season, could capture last-minute bookings, as only 28% currently do.
- Explore offering discounts for stays of 30+ nights to attract the 40% of the market seeking extended stays.
- Adjust minimum nights based on seasonality – potentially shorter during low season and longer during peak demand periods in Werribee.
Werribee Airbnb Cancellation Policy Trends Analysis (2026)
Super Strict 30 Days
1 listings
4% of total
Flexible
6 listings
24% of total
Moderate
12 listings
48% of total
Firm
6 listings
24% of total
Cancellation Policy Insights for Werribee
- The prevailing Airbnb cancellation policy trend in Werribee is Moderate, used by 48% of listings.
- The market strongly favors guest-friendly terms, with 72.0% of listings offering Flexible or Moderate policies. This suggests guests in Werribee may expect booking flexibility.
Recommendations for Hosts
- Consider adopting a Moderate policy to align with the 48% market standard in Werribee.
- Regularly review your cancellation policy against competitors and market demand shifts in Werribee.
How Much Are Airbnb Cleaning Fees in Werribee?
Cleaning fees in Werribee are meaningful operating levers, not just pass-through charges. What matters most is how often hosts charge them, how high they run relative to market norms, and how large a share of gross revenue they consume.
Cleaning Fee Insights for Werribee
- 84.0% of listings charge a cleaning fee, making it standard practice in Werribee. Guests expect it and factor it into their booking decisions.
- The gap between the average ($127) and median ($99) cleaning fee indicates some high-end properties are pulling the average up considerably.
- Cleaning fees represent 12.6% of gross revenue on average — a significant line item that impacts total guest cost and competitiveness.
Recommendations for Hosts
- Price your cleaning fee competitively against the Werribee median of $99. Fees significantly above market norms can deter bookings, especially for shorter stays.
- Consider whether bundling the cleaning fee into a slightly higher nightly rate might improve conversion, since many guests filter by total price and separate fees can feel punitive.
- Monitor competitor cleaning fees regularly. Airbnb's search algorithm factors in total price, so a well-calibrated cleaning fee can improve your listing's ranking.
What Do the Top Airbnb Listings in Werribee Look Like?
Benchmark your potential! Explore examples of top-performing Airbnb properties in Werribeebased on Trailing Twelve Month (TTM) revenue. Analyze their characteristics, revenue, occupancy rate, and ADR to understand what drives success in this market.
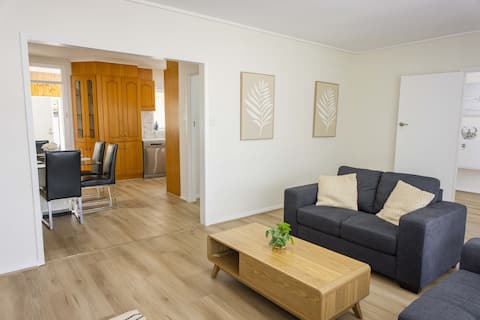
Newly Renovated 3 -Bedroom House in Werribee CBD
Entire Place • 3 bedrooms
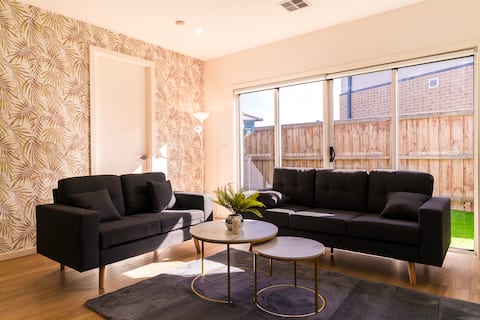
Light-Filled Werribee Escape
Entire Place • 4 bedrooms
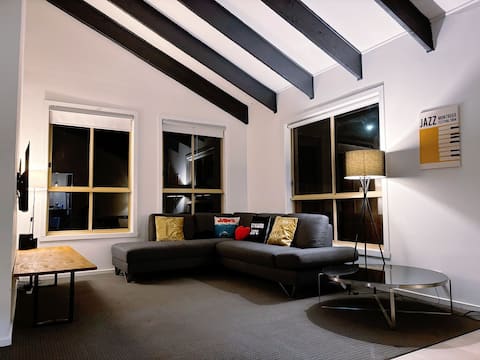
Spacious 3-Bed Home in Werribee!
Entire Place • 3 bedrooms
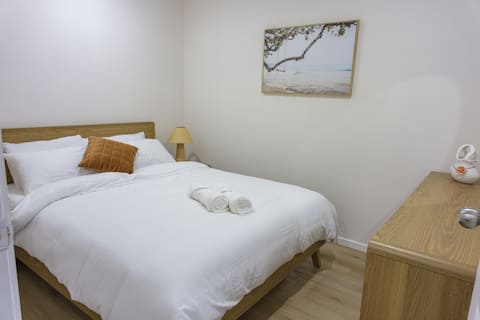
Brand New Backyard Guest House in Werribee CBD
Entire Place • 2 bedrooms
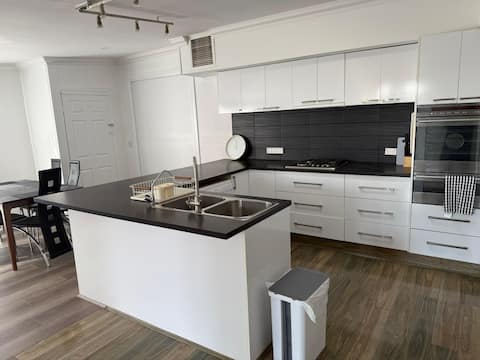
2-Bedroom Family Retreat with Outdoor Verandah
Entire Place • 2 bedrooms
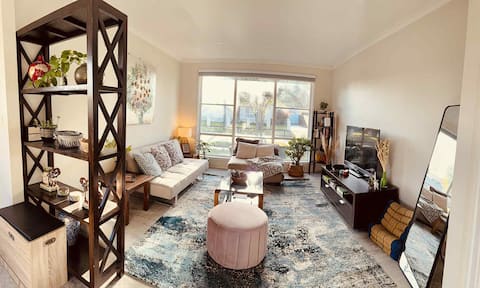
3 BR-Great house - The Willow
Entire Place • 3 bedrooms
Note: Performance varies based on location, size, amenities, seasonality, and management quality. Data reflects the past 12 months.
Who Are the Top Airbnb Hosts in Werribee?
Learn from the best! This table showcases top-performing Airbnb hosts in Werribee based on the number of properties managed and estimated total revenue over the past year. Analyze their scale and performance metrics.
| Host Name | Properties | Grossing Revenue | Stay Reviews | Avg Rating |
|---|---|---|---|---|
| Raj | 2 | $68,893 | 129 | 4.68/5.0 |
| Daniel | 1 | $39,738 | 20 | 4.30/5.0 |
| Chui Shan Tracey | 1 | $26,321 | 14 | 4.50/5.0 |
| Yenny | 2 | $24,533 | 15 | 4.68/5.0 |
| Thu Ba | 1 | $18,743 | 16 | 4.63/5.0 |
| Emily | 1 | $18,281 | 12 | 4.00/5.0 |
| Annika And Amon | 1 | $17,632 | 9 | 4.67/5.0 |
| Mercy | 1 | $16,229 | 17 | 4.94/5.0 |
| Maryna | 1 | $14,559 | 44 | 5.00/5.0 |
| Ashraful | 1 | $11,706 | 8 | 4.13/5.0 |
Analyzing the strategies of top hosts, such as their property selection, pricing, and guest communication, can offer valuable lessons for optimizing your own Airbnb operations in Werribee.
Who Are the Airbnb Hosts in Werribee?
Werribee has a relatively balanced host base.
Host Profile Insights for Werribee
- Only 24.0% of hosts hold Superhost status, suggesting a relatively young or casual market where quality improvements can pay outsized dividends.
- 28.0% of listings are professionally managed, reflecting a market still dominated by individual hosts.
- 4.0% of listings have Instant Book enabled. Lower Instant Book adoption means many guests must request approval, which can slow conversions.
- 76.0% of listings use Airbnb's simplified pricing (host-only fee), where the host pays the entire platform service fee and the guest sees one all-in price with no separate Airbnb service charge. High adoption signals a professional, PMS-connected host base — Airbnb mandates simplified pricing for software-connected listings.
Recommendations for Hosts
- Earning Superhost status can significantly improve search ranking and guest trust. Focus on maintaining high response rates, low cancellations, and strong reviews.
- Consider enabling Instant Book — it reduces booking friction and Airbnb's algorithm tends to favor Instant Book listings in search results.
- With 28.0% cohosted listings, there may be a growing local market for property management services.
- Benchmark your host metrics against these Werribee averages regularly and adjust your hosting strategy based on what top performers do differently.
Top Professional Management Companies in Werribee
These are the highest-grossing professional property management operations in Werribee, ranked by total revenue across their portfolio. Their performance metrics offer a benchmark for what institutional-level hosting looks like in this market.
| Company | Listings | Revenue | ADR | Occ. | Rating |
|---|---|---|---|---|---|
| Raj | 2 | $68,893 | $143 | 65.9% | 4.68/5 |
| Yenny | 2 | $24,533 | $130 | 59.8% | 4.68/5 |
| Annika And Amon | 1 | $17,632 | $308 | 32.1% | 4.67/5 |
| Ashraful | 1 | $11,706 | $192 | 32.8% | 4.13/5 |
| Audrey | 1 | $9,398 | $292 | 58.1% | 5.00/5 |
Management Company Insights for Werribee
- The leading management company, Raj, operates 2 listings with $68,893 in gross revenue — a useful benchmark for what scale looks like in Werribee.
- Top managers average 1 properties each, suggesting professional management in Werribee still operates at a relatively boutique scale.
- Professionally managed listings in the top tier average 4.63/5 in guest ratings — suggesting room for quality improvement even among larger operators.
Recommendations
- Study how top management companies price, position, and maintain their portfolios — their ADR and occupancy rates reflect strategies refined across dozens of listings.
- If you're considering hiring a property manager, compare their portfolio performance against these benchmarks before committing.
How Does Werribee's Airbnb Market Compare to Nearby Cities?
How does the Werribee Airbnb market stack up against its neighbors? Compare key performance metrics like average monthly revenue, ADR, and occupancy rates in surrounding areas to understand the broader regional STR landscape.
Compared with Lancefield, Werribee has 0 percentage points higher occupancy and about $97 lower ADR. That helps frame whether this market is winning more on demand, pricing, or both.
| Market | Active Properties | Monthly Revenue | Daily Rate | Avg. Occupancy |
|---|---|---|---|---|
| Portsea | 10 | $3,789 | $537.68 | 35% |
| Macedon | 11 | $3,741 | $461.36 | 36% |
| Mount Martha | 40 | $3,554 | $601.80 | 36% |
| Lancefield | 18 | $3,176 | $244.81 | 40% |
| Leopold | 11 | $3,147 | $505.05 | 33% |
| Shire of Strathbogie | 34 | $3,132 | $344.18 | 36% |
| Sorrento | 42 | $2,800 | $492.42 | 31% |
| Daylesford | 461 | $2,791 | $298.17 | 36% |
| Shire of Hepburn | 255 | $2,776 | $314.58 | 35% |
| Neerim South | 10 | $2,758 | $266.32 | 37% |
Frequently Asked Questions About Airbnb in Werribee
These quick answers summarize the most common investor and operator questions using AirROI's latest market data for Werribee.
How much do Airbnb hosts make in Werribee?
Werribee hosts earn about $12,768 per year on average, with an average nightly rate of $147 and RevPAR of $60. Those figures describe the typical revenue environment for active listings in Werribee, Victoria, not the ceiling for the best operators. Source: AirROI 2026 data, Werribee market, July 2025 to June 2026.
What is the average Airbnb occupancy rate in Werribee?
The average Airbnb occupancy rate in Werribee is 39.7%. February is the strongest month and May is the softest, so hosts should expect demand to move meaningfully throughout the year rather than stay flat.
What is the average Airbnb daily rate in Werribee?
Listings in Werribee average $147 per night. The broader pricing spread also matters: lower-performing listings cluster closer to the lower quartiles, while premium homes can price materially above the city average when demand spikes or listing quality stands out.
How many Airbnb listings are active in Werribee?
Werribee currently has about 25 active Airbnb listings in AirROI's market dataset. That supply count helps explain how competitive the market is, how much depth there is for benchmarking, and whether the market behaves like a niche destination or a scaled urban market.
How strict are short-term rental regulations in Werribee?
AirROI currently classifies the short-term rental regulation level in Werribee as Low. The dataset also shows about 0.0% of listings with registration evidence. That is a market signal, not legal advice, so hosts should still confirm current licensing and compliance rules locally before listing.
What is the RevPAR for Airbnb in Werribee?
RevPAR in Werribee is about $60. That metric combines pricing and occupancy into one efficiency number, so it is often a better quick benchmark than ADR alone when investors want to compare how well listings convert nightly rates into realized revenue.
Is Airbnb profitable in Werribee?
Occupancy of 39.7% means Werribee is a more selective market. Profitability is achievable but requires careful cost management, premium positioning, or targeting longer stays to reduce turnover. Average annual revenue is $12,768, but individual returns depend on property type, location within the city, and the host's operating efficiency.
How far in advance do guests book Airbnb in Werribee?
The average booking lead time in Werribee is about 22 days — a moderate lead time that gives hosts planning visibility while still benefiting from last-minute bookings. Hosts who understand their market's booking cadence can adjust minimum stays and pricing windows accordingly.
What are the best neighborhoods for Airbnb in Werribee?
Based on AirROI's analysis, some of the top neighborhoods for short-term rentals in Werribee include Werribee Park, Werribee South, Shadowfax Wines. Each area attracts different guest profiles — from business travelers to leisure visitors — so the best location depends on the property type and target audience a host is aiming for. See the full neighborhood breakdown above.
What type of property performs best on Airbnb in Werribee?
entire_home listings make up 80.0% of the active supply in Werribee. The most common configuration does not always mean the most profitable — operators who identify underserved property types or bedroom counts can sometimes outperform the market average by filling a gap in local supply.
How does Werribee compare to nearby Airbnb markets?
Among neighboring markets, Portsea posts $45,466 in average annual revenue with 35.4% occupancy, compared to Werribee's $12,768 and 39.7%. Comparing nearby markets helps investors understand whether a destination's performance reflects local demand or broader regional trends.
What is the average length of stay in Werribee?
The average Airbnb stay length in Werribee is about 4.9 nights. That matters for turnover, cleaning operations, and pricing strategy because shorter stays increase changeovers while longer stays can smooth occupancy and reduce operational friction.
What is the average Airbnb guest rating in Werribee?
Airbnb listings in Werribee average 4.62 out of 5 overall. About 20.0% of listings carry the guest favorite badge, which suggests a meaningful share of inventory is competing on review quality rather than price alone.
Which amenities boost Airbnb revenue in Werribee?
Dishes and silverware and Dining table are among the strongest revenue-linked amenities in Werribee. In AirROI's latest dataset, listings with these amenities outperform those without on average revenue, which makes amenities analysis useful for prioritizing investment and listing upgrades.
Do Airbnb hosts charge cleaning fees in Werribee?
Yes. About 84.0% of active Airbnb listings in Werribee charge a cleaning fee, and the average fee is $127. The more important operating benchmark is how much of gross revenue that fee consumes, not just the absolute dollar amount.
What percentage of Airbnb hosts are Superhosts in Werribee?
At 24.0%, there is a healthy mix of experienced and newer hosts — earning Superhost status can still provide a meaningful visibility boost.
About AirROI Market Data
AirROI tracks over 20 million properties across 190+ countries and maintains 15+ years of historical performance data, making it one of the deepest Airbnb and STR intelligence platforms available. The analytics pipeline aggregates listing-level data monthly — revenue, occupancy, nightly rates, RevPAR, guest demographics, booking patterns, and competitive supply — so investors and operators can benchmark any market against its own history and against neighboring destinations.
Real estate investors, property managers, financial institutions, hedge funds, tourism boards, hospitality consultants, tech platforms, and academic researchers rely on AirROI data to underwrite acquisitions, optimize pricing, model macro trends, and conduct peer-reviewed research. Data is available through in-depth market reports like this one and the Airbnb API with 22 endpoints and an Airbnb MCP Server for AI agents.
AirROI proprietary analytics as of 2026-06-30. Metrics reflect trailing twelve-month aggregates from active listings. Revenue figures are market averages, not projections. Neighborhood descriptions are AI-generated and reviewed for accuracy. For full methodology, see the data methodology page.