Masvingo Airbnb Market Analysis 2026: Short Term Rental Data & Vacation Rental Statistics in Masvingo Province, Zimbabwe
Is Airbnb profitable in Masvingo in 2026? Explore comprehensive Airbnb analytics for Masvingo, Masvingo Province, Zimbabwe to uncover income potential. This 2026 STR market report for Masvingo, based on AirROI data from February 2025 to January 2026, reveals key trends in the niche market of 32 active listings.
Whether you're considering an Airbnb investment in Masvingo, optimizing your existing vacation rental, or exploring rental arbitrage opportunities, understanding the Masvingo Airbnb data is crucial. Leveraging the low regulation environment is key to maximizing your short term rental income potential. Let's dive into the specifics.
Key Masvingo Airbnb Performance Metrics Overview
Monthly Airbnb Revenue Variations & Income Potential in Masvingo (2026)
Understanding the monthly revenue variations for Airbnb listings in Masvingo is key to maximizing your short term rental income potential. Seasonality significantly impacts earnings. Our analysis, based on data from the past 12 months, shows that the peak revenue month for STRs in Masvingo is typically August, while November often presents the lowest earnings, highlighting opportunities for strategic pricing adjustments during shoulder and low seasons. Explore the typical Airbnb income in Masvingo across different performance tiers:
- Best-in-class properties (Top 10%) achieve $1,128+ monthly, often utilizing dynamic pricing and superior guest experiences.
- Strong performing properties (Top 25%) earn $678 or more, indicating effective management and desirable locations/amenities.
- Typical properties (Median) generate around $397 per month, representing the average market performance.
- Entry-level properties (Bottom 25%) see earnings around $211, often with potential for optimization.
Average Monthly Airbnb Earnings Trend in Masvingo
Masvingo Airbnb Occupancy Rate Trends (2026)
Maximize your bookings by understanding the Masvingo STR occupancy trends. Seasonal demand shifts significantly influence how often properties are booked. Typically, Augustsees the highest demand (peak season occupancy), while July experiences the lowest (low season). Effective strategies, like adjusting minimum stays or offering promotions, can boost occupancy during slower periods. Here's how different property tiers perform in Masvingo:
- Best-in-class properties (Top 10%) achieve 37%+ occupancy, indicating high desirability and potentially optimized availability.
- Strong performing properties (Top 25%) maintain 27% or higher occupancy, suggesting good market fit and guest satisfaction.
- Typical properties (Median) have an occupancy rate around 16%.
- Entry-level properties (Bottom 25%) average 10% occupancy, potentially facing higher vacancy.
Average Monthly Occupancy Rate Trend in Masvingo
Average Daily Rate (ADR) Airbnb Trends in Masvingo (2026)
Effective short term rental pricing strategy in Masvingo involves understanding monthly ADR fluctuations. The Average Daily Rate (ADR) for Airbnb in Masvingo typically peaks in January and dips lowest during July. Leveraging Airbnb dynamic pricing tools or strategies based on this seasonality can significantly boost revenue. Here's a look at the typical nightly rates achieved:
- Best-in-class properties (Top 10%) command rates of $144+ per night, often due to premium features or locations.
- Strong performing properties (Top 25%) achieve nightly rates of $101 or more.
- Typical properties (Median) charge around $77 per night.
- Entry-level properties (Bottom 25%) earn around $59 per night.
Average Daily Rate (ADR) Trend by Month in Masvingo
Get Live Masvingo Market Intelligence 👇
Explore Real-time Analytics
Airbnb Seasonality Analysis & Trends in Masvingo (2026)
Peak Season (August, December, September)
- Revenue averages $782 per month
- Occupancy rates average 26.4%
- Daily rates average $87
Shoulder Season
- Revenue averages $516 per month
- Occupancy maintains around 19.9%
- Daily rates hold near $86
Low Season (January, February, November)
- Revenue drops to average $402 per month
- Occupancy decreases to average 17.3%
- Daily rates adjust to average $91
Seasonality Insights for Masvingo
- The Airbnb seasonality in Masvingo shows highly seasonal trends requiring careful strategy. While the sections above show seasonal averages, it's also insightful to look at the extremes:
- During the high season, the absolute peak month showcases Masvingo's highest earning potential, with monthly revenues capable of climbing to $937, occupancy reaching a high of 30.4%, and ADRs peaking at $96.
- Conversely, the slowest single month of the year, typically falling within the low season, marks the market's lowest point. In this month, revenue might dip to $359, occupancy could drop to 15.5%, and ADRs may adjust down to $84.
- Understanding both the seasonal averages and these monthly peaks and troughs in revenue, occupancy, and ADR is crucial for maximizing your Airbnb profit potential in Masvingo.
Seasonal Strategies for Maximizing Profit
- Peak Season: Maximize revenue through premium pricing and potentially longer minimum stays. Ensure high availability.
- Low Season: Offer competitive pricing, special promotions (e.g., extended stay discounts), and flexible cancellation policies. Target off-season travelers like remote workers or budget-conscious guests.
- Shoulder Seasons: Implement dynamic pricing that balances peak and low rates. Target weekend travelers or specific events. Offer slightly more flexible terms than peak season.
- Regularly analyze your own performance against these Masvingo seasonality benchmarks and adjust your pricing and availability strategy accordingly.
Best Areas for Airbnb Investment in Masvingo (2026)
Exploring the top neighborhoods for short-term rentals in Masvingo? This section highlights key areas, outlining why they are attractive for hosts and guests, along with notable local attractions. Consider these locations based on your target guest profile and investment strategy.
| Neighborhood / Area | Why Host Here? (Target Guests & Appeal) | Key Attractions & Landmarks |
|---|---|---|
| Vic Falls Extension | Tourist location close to the famous Victoria Falls, ideal for attracting visitors coming to experience one of the Seven Natural Wonders of the World. | Victoria Falls National Park, Victoria Falls Bridge, Zambezi River activities, Forest Walks, Local craft markets |
| Masvingo Town Centre | The heart of Masvingo, with accessibility to amenities, shops, and local attractions, making it a convenient stay for visitors. | Great Zimbabwe National Monument, Lake Mutirikwi, Masvingo Museum, Local restaurants and cafes, Shopping malls |
| Lake Mutirikwi | A picturesque location ideal for nature lovers and those looking to escape into tranquil surroundings, suitable for recreational activities. | Lake Mutirikwi, Fishing and boating, Nature walks, Wildlife viewing, Surrounding lodges and camps |
| Great Zimbabwe | A UNESCO World Heritage site attracting historians, archeologists, and tourists interested in the rich cultural history of Zimbabwe. | Great Zimbabwe ruins, Museum of Great Zimbabwe, Guided tours of the site, Cultural experiences |
| Rujeko | A residential area that offers a local experience, catering to travelers wanting to immerse in the local culture and day-to-day life. | Local markets, Community centers, Hospitality experiences |
| Neshuro | A rural area that showcases traditional Zimbabwean life, perfect for tourists looking for a unique and authentic cultural experience. | Traditional village tours, Local crafts, Cultural performances |
| Chilojo Cliffs | A scenic area providing stunning views and opportunities for outdoor activities, appealing to nature enthusiasts. | Chilojo Cliffs views, Game viewing, Bird watching, Photography opportunities |
| Zaka | A lesser-known gem with beautiful landscapes and traditional Zimbabwean culture, ideal for eco-tourism and cultural immersion. | Nature walks, Cultural experiences, Local wildlife, Village tours |
Understanding Airbnb License Requirements & STR Laws in Masvingo (2026)
While Masvingo, Masvingo Province, Zimbabwe currently shows low STR regulations, specific Airbnb license requirements might still exist or change. Always verify the latest short term rental regulations and Airbnb license requirements directly with local government authorities for Masvingo to ensure full compliance before hosting.
(Source: AirROI data, 2026, finding no licensed listings among those analyzed)
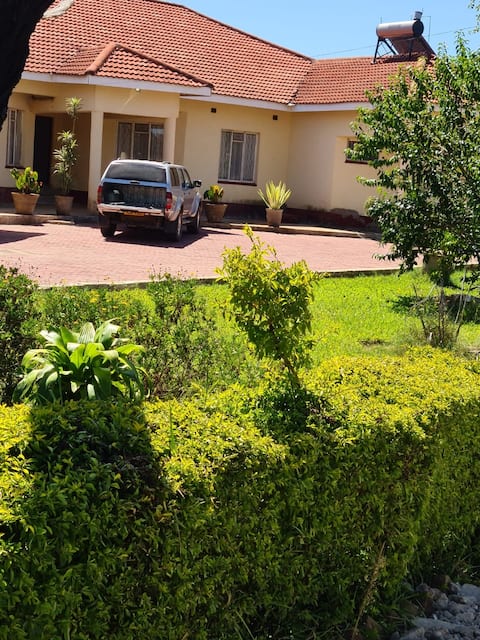
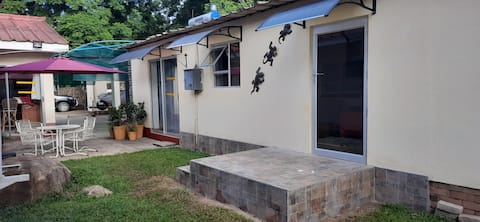
Top Performing Airbnb Properties in Masvingo (2026)
Benchmark your potential! Explore examples of top-performing Airbnb properties in Masvingobased on Trailing Twelve Month (TTM) revenue. Analyze their characteristics, revenue, occupancy rate, and ADR to understand what drives success in this market.

Lacuna Apartments.( The Octopus )with pool
Entire Place • 3 bedrooms
Self-catering Guest Wing. 3 bedrooms, 4 beds.
Entire Place • 3 bedrooms
Flametree Cottage
Entire Place • 2 bedrooms

Lacuna Apartments (The Orca) wth pool ,outdoorshwr
Entire Place • 3 bedrooms

The Residence Apartment 1
Entire Place • 2 bedrooms

Upto 8 people Apartment, Family & Group Travellers
Entire Place • 3 bedrooms
Note: Performance varies based on location, size, amenities, seasonality, and management quality. Data reflects the past 12 months.
Top Performing Airbnb Hosts in Masvingo (2026)
Learn from the best! This table showcases top-performing Airbnb hosts in Masvingo based on the number of properties managed and estimated total revenue over the past year. Analyze their scale and performance metrics.
| Host Name | Properties | Grossing Revenue | Stay Reviews | Avg Rating |
|---|---|---|---|---|
| Taurayi | 2 | $26,554 | 88 | 4.71/5.0 |
| John | 7 | $26,489 | 54 | 4.61/5.0 |
| Rumbidzai | 5 | $23,534 | 153 | 4.76/5.0 |
| Paida | 4 | $18,606 | 51 | 4.90/5.0 |
| Clara | 1 | $12,560 | 26 | 4.77/5.0 |
| Kerry-Lyn | 1 | $11,878 | 100 | 4.95/5.0 |
| Sly | 5 | $4,749 | 27 | 4.64/5.0 |
| Emely | 2 | $2,250 | 11 | 5.00/5.0 |
| Ottilia | 2 | $1,809 | 24 | 4.80/5.0 |
| Wimbayi | 3 | $1,422 | 14 | 4.69/5.0 |
Analyzing the strategies of top hosts, such as their property selection, pricing, and guest communication, can offer valuable lessons for optimizing your own Airbnb operations in Masvingo.
Dive Deeper: Advanced Masvingo STR Market Data (2026)
Ready to unlock more insights? AirROI provides access to advanced metrics and comprehensive Airbnb data for Masvingo. Explore detailed analytics beyond this report to refine your investment strategy, optimize pricing, and maximize your vacation rental profits.
Explore Advanced MetricsMasvingo Short-Term Rental Market Composition (2026): Property & Room Types
Room Type Distribution
Property Type Distribution
Market Composition Insights for Masvingo
- The Masvingo Airbnb market composition is heavily skewed towards Entire Home/Apt listings, which make up 65.6% of the 32 active rentals. This indicates strong guest preference for privacy and space.
- However, a notable 34.4% share for Private Rooms suggests opportunities for budget-conscious travelers or hosts renting out spare rooms.
- Looking at the property type distribution in Masvingo, Apartment/Condo properties are the most common (53.1%), reflecting the local real estate landscape.
- Houses represent a significant 40.6% portion, catering likely to families or larger groups.
- The presence of 6.3% Hotel/Boutique listings indicates integration with traditional hospitality.
Masvingo Airbnb Room Capacity Analysis (2026): Bedroom Distribution
Distribution of Listings by Number of Bedrooms
Room Capacity Insights for Masvingo
- The dominant room capacity in Masvingo is 2 bedrooms listings, making up 46.9% of the market. This suggests a strong demand for properties suitable for couples or solo travelers.
- Together, 2 bedrooms and 1 bedroom properties represent 65.7% of the active Airbnb listings in Masvingo, indicating a high concentration in these sizes.
- A significant 21.8% of listings offer 3+ bedrooms, catering to larger groups and families seeking more space in Masvingo.
Masvingo Vacation Rental Guest Capacity Trends (2026)
Distribution of Listings by Guest Capacity
Guest Capacity Insights for Masvingo
- The most common guest capacity trend in Masvingo vacation rentals is listings accommodating 4 guests (43.8%). This suggests the primary traveler segment is likely small families or groups.
- Properties designed for 4 guests and 2 guests dominate the Masvingo STR market, accounting for 62.6% of listings.
- 18.8% of properties accommodate 6+ guests, serving the market segment for larger families or group travel in Masvingo.
- On average, properties in Masvingo are equipped to host 3.4 guests.
Masvingo Airbnb Booking Patterns (2026): Available vs. Booked Days
Available Days Distribution
Booked Days Distribution
Booking Pattern Insights for Masvingo
- The most common availability pattern in Masvingo falls within the 271-366 days range, representing 78.1% of listings. This suggests many properties have significant open periods on their calendars.
- Approximately 96.9% of listings show high availability (181+ days open annually), indicating potential for increased bookings or specific owner usage patterns.
- For booked days, the 1-30 days range is most frequent in Masvingo (46.9%), reflecting common guest stay durations or potential owner blocking patterns.
- A notable 3.1% of properties secure long booking periods (181+ days booked per year), highlighting successful long-term rental strategies or significant owner usage.
Masvingo Airbnb Minimum Stay Requirements Analysis
Distribution of Listings by Minimum Night Requirement
1 Night
32 listings
100% of total
Key Insights
- The most prevalent minimum stay requirement in Masvingo is 1 Night, adopted by 100% of listings. This highlights the market's preference for shorter, flexible bookings.
- A strong majority (100.0%) of the Masvingo Airbnb data shows acceptance of very short stays (1-2 nights), indicating a dynamic, high-turnover market.
Recommendations
- Align with the market by considering a 1 Night minimum stay, as 100% of Masvingo hosts use this setting.
- Adjust minimum nights based on seasonality – potentially shorter during low season and longer during peak demand periods in Masvingo.
Masvingo Airbnb Cancellation Policy Trends Analysis (2026)
Flexible
22 listings
68.8% of total
Moderate
2 listings
6.3% of total
Firm
6 listings
18.8% of total
Strict
2 listings
6.3% of total
Cancellation Policy Insights for Masvingo
- The prevailing Airbnb cancellation policy trend in Masvingo is Flexible, used by 68.8% of listings.
- The market strongly favors guest-friendly terms, with 75.1% of listings offering Flexible or Moderate policies. This suggests guests in Masvingo may expect booking flexibility.
- Strict cancellation policies are quite rare (6.3%), potentially making listings with this policy less competitive unless justified by high demand or property type.
Recommendations for Hosts
- Consider adopting a Flexible policy to align with the 68.8% market standard in Masvingo.
- Given the high prevalence of Flexible policies (68.8%), offering this can enhance booking appeal, especially during shoulder seasons.
- Using a Strict policy might deter some guests, as only 6.3% of listings use it. Evaluate if potential revenue protection outweighs possible lower booking rates.
- Regularly review your cancellation policy against competitors and market demand shifts in Masvingo.
Masvingo STR Booking Lead Time Analysis (2026)
Average Booking Lead Time by Month
Booking Lead Time Insights for Masvingo
- The overall average booking lead time for vacation rentals in Masvingo is 24 days.
- Guests book furthest in advance for stays during August (average 58 days), likely coinciding with peak travel demand or local events.
- The shortest booking windows occur for stays in October (average 21 days), indicating more last-minute travel plans during this time.
- Seasonally, Summer (44 days avg.) sees the longest lead times, while Fall (24 days avg.) has the shortest, reflecting typical travel planning cycles.
Recommendations for Hosts
- Use the overall average lead time (24 days) as a baseline for your pricing and availability strategy in Masvingo.
- For August stays, consider implementing length-of-stay discounts or slightly higher rates for bookings made less than 58 days out to capitalize on advance planning.
- Target marketing efforts for the Summer season well in advance (at least 44 days) to capture early planners.
- Monitor your own booking lead times against these Masvingo averages to identify opportunities for dynamic pricing adjustments.
Popular & Essential Airbnb Amenities in Masvingo (2026)
Amenity Prevalence
Amenity Insights for Masvingo
- Essential amenities in Masvingo that guests expect include: Free parking on premises, Wifi, TV. Lacking these (any) could significantly impact bookings.
- Popular amenities like Kitchen, Hot water, Cooking basics are common but not universal. Offering these can provide a competitive edge.
Recommendations for Hosts
- Ensure your listing includes all essential amenities for Masvingo: Free parking on premises, Wifi, TV.
- Consider adding popular differentiators like Kitchen or Hot water to increase appeal.
- Highlight unique or less common amenities you offer (e.g., hot tub, dedicated workspace, EV charger) in your listing description and photos.
- Regularly check competitor amenities in Masvingo to stay competitive.
Masvingo Airbnb Guest Demographics & Profile Analysis (2026)
Guest Profile Summary for Masvingo
- The typical guest profile for Airbnb in Masvingo consists of predominantly international visitors (73%), with top international origins including South Africa, typically belonging to the Post-2000s (Gen Z/Alpha) group (50%), primarily speaking English or Spanish.
- Domestic travelers account for 27.1% of guests.
- Key international markets include Zimbabwe (27.1%) and South Africa (14.3%).
- Top languages spoken are English (63.3%) followed by Spanish (8.2%).
- A significant demographic segment is the Post-2000s (Gen Z/Alpha) group, representing 50% of guests.
Recommendations for Hosts
- Focus marketing internationally, particularly towards travelers from South Africa.
- Tailor amenities and listing descriptions to appeal to the dominant Post-2000s (Gen Z/Alpha) demographic (e.g., highlight fast WiFi, smart home features, local guides).
- Highlight unique local experiences or amenities relevant to the primary guest profile.
- Consider seasonal promotions aligned with peak travel times for key origin markets.
Nearby Short-Term Rental Market Comparison
How does the Masvingo Airbnb market stack up against its neighbors? Compare key performance metrics like average monthly revenue, ADR, and occupancy rates in surrounding areas to understand the broader regional STR landscape.
| Market | Active Properties | Monthly Revenue | Daily Rate | Avg. Occupancy |
|---|---|---|---|---|
| Gweru | 23 | $267 | $98.27 | 17% |