Kariba Airbnb Market Analysis 2026: Short Term Rental Data & Vacation Rental Statistics in Mashonaland West Province, Zimbabwe
Is Airbnb profitable in Kariba in 2026? Explore comprehensive Airbnb analytics for Kariba, Mashonaland West Province, Zimbabwe to uncover income potential. This 2026 STR market report for Kariba, based on AirROI data from February 2025 to January 2026, reveals key trends in the niche market of 30 active listings.
Whether you're considering an Airbnb investment in Kariba, optimizing your existing vacation rental, or exploring rental arbitrage opportunities, understanding the Kariba Airbnb data is crucial. Leveraging the low regulation environment is key to maximizing your short term rental income potential. Let's dive into the specifics.
Key Kariba Airbnb Performance Metrics Overview
Monthly Airbnb Revenue Variations & Income Potential in Kariba (2026)
Understanding the monthly revenue variations for Airbnb listings in Kariba is key to maximizing your short term rental income potential. Seasonality significantly impacts earnings. Our analysis, based on data from the past 12 months, shows that the peak revenue month for STRs in Kariba is typically October, while March often presents the lowest earnings, highlighting opportunities for strategic pricing adjustments during shoulder and low seasons. Explore the typical Airbnb income in Kariba across different performance tiers:
- Best-in-class properties (Top 10%) achieve $2,777+ monthly, often utilizing dynamic pricing and superior guest experiences.
- Strong performing properties (Top 25%) earn $2,015 or more, indicating effective management and desirable locations/amenities.
- Typical properties (Median) generate around $960 per month, representing the average market performance.
- Entry-level properties (Bottom 25%) see earnings around $460, often with potential for optimization.
Average Monthly Airbnb Earnings Trend in Kariba
Kariba Airbnb Occupancy Rate Trends (2026)
Maximize your bookings by understanding the Kariba STR occupancy trends. Seasonal demand shifts significantly influence how often properties are booked. Typically, Octobersees the highest demand (peak season occupancy), while January experiences the lowest (low season). Effective strategies, like adjusting minimum stays or offering promotions, can boost occupancy during slower periods. Here's how different property tiers perform in Kariba:
- Best-in-class properties (Top 10%) achieve 37%+ occupancy, indicating high desirability and potentially optimized availability.
- Strong performing properties (Top 25%) maintain 28% or higher occupancy, suggesting good market fit and guest satisfaction.
- Typical properties (Median) have an occupancy rate around 17%.
- Entry-level properties (Bottom 25%) average 10% occupancy, potentially facing higher vacancy.
Average Monthly Occupancy Rate Trend in Kariba
Average Daily Rate (ADR) Airbnb Trends in Kariba (2026)
Effective short term rental pricing strategy in Kariba involves understanding monthly ADR fluctuations. The Average Daily Rate (ADR) for Airbnb in Kariba typically peaks in December and dips lowest during November. Leveraging Airbnb dynamic pricing tools or strategies based on this seasonality can significantly boost revenue. Here's a look at the typical nightly rates achieved:
- Best-in-class properties (Top 10%) command rates of $393+ per night, often due to premium features or locations.
- Strong performing properties (Top 25%) achieve nightly rates of $289 or more.
- Typical properties (Median) charge around $179 per night.
- Entry-level properties (Bottom 25%) earn around $98 per night.
Average Daily Rate (ADR) Trend by Month in Kariba
Get Live Kariba Market Intelligence 👇

Explore Real-time Analytics
Airbnb Seasonality Analysis & Trends in Kariba (2026)
Peak Season (October, December, April)
- Revenue averages $1,744 per month
- Occupancy rates average 24.5%
- Daily rates average $222
Shoulder Season
- Revenue averages $1,328 per month
- Occupancy maintains around 20.8%
- Daily rates hold near $220
Low Season (March, June, September)
- Revenue drops to average $837 per month
- Occupancy decreases to average 15.9%
- Daily rates adjust to average $222
Seasonality Insights for Kariba
- The Airbnb seasonality in Kariba shows highly seasonal trends requiring careful strategy. While the sections above show seasonal averages, it's also insightful to look at the extremes:
- During the high season, the absolute peak month showcases Kariba's highest earning potential, with monthly revenues capable of climbing to $1,809, occupancy reaching a high of 27.4%, and ADRs peaking at $225.
- Conversely, the slowest single month of the year, typically falling within the low season, marks the market's lowest point. In this month, revenue might dip to $731, occupancy could drop to 14.5%, and ADRs may adjust down to $217.
- Understanding both the seasonal averages and these monthly peaks and troughs in revenue, occupancy, and ADR is crucial for maximizing your Airbnb profit potential in Kariba.
Seasonal Strategies for Maximizing Profit
- Peak Season: Maximize revenue through premium pricing and potentially longer minimum stays. Ensure high availability.
- Low Season: Offer competitive pricing, special promotions (e.g., extended stay discounts), and flexible cancellation policies. Target off-season travelers like remote workers or budget-conscious guests.
- Shoulder Seasons: Implement dynamic pricing that balances peak and low rates. Target weekend travelers or specific events. Offer slightly more flexible terms than peak season.
- Regularly analyze your own performance against these Kariba seasonality benchmarks and adjust your pricing and availability strategy accordingly.
Best Areas for Airbnb Investment in Kariba (2026)
Exploring the top neighborhoods for short-term rentals in Kariba? This section highlights key areas, outlining why they are attractive for hosts and guests, along with notable local attractions. Consider these locations based on your target guest profile and investment strategy.
| Neighborhood / Area | Why Host Here? (Target Guests & Appeal) | Key Attractions & Landmarks |
|---|---|---|
| Lake Kariba | A stunning freshwater lake offering fantastic views and opportunities for water sports. An ideal spot for tourists looking to enjoy fishing, boating, and wildlife viewing. | Kariba Dam, Casino, Houseboat Rentals, Fishing Tours, Wildlife Safaris |
| Matusadona National Park | A beautiful national park located on the shores of Lake Kariba, known for its diverse wildlife and beautiful landscapes. Perfect for tourists who want to experience nature and wildlife. | Game Drives, Birdwatching, Scenic Views, Zambezi River Boat Cruise |
| Kariba Town | The town itself offers a unique blend of local culture and access to the lake. Many visitors come to explore local markets and enjoy the vibrant atmosphere. | Kariba Market, Local Cuisine, Cultural Experiences, Fishing on the Lake |
| Chizarira National Park | A remote park known for its rugged beauty and sparse visitor traffic. Great for adventurous travelers seeking solitude and pristine nature. | Hiking Trails, Wildlife Viewing, Camping Areas, Scenic Overlooks |
| Binga | A town on the western shores of Lake Kariba, known for its cultural heritage and beautiful scenery. It attracts visitors looking for a more off-the-beaten-path experience. | Traditional Villages, Craft Markets, Scenic Views, Water Sports |
| Sanyati Gorge | A remote and picturesque area offering stunning landscapes and opportunities for adventure. Ideal for eco-tourists and nature lovers. | Hiking, Wildlife Photography, Canoeing, Birdwatching |
| Zambezi National Park | Known for its incredible wildlife, this park is perfect for safaris and experiencing the beauty of the Zambezi River. Popular with tourists looking to combine luxury and nature. | Safari Drives, Boat Safaris, River Cruises, Cultural Tours |
| Kanyemba | A serene location near the border with Zambia, Kanyemba offers an escape for those looking for calm and relaxation away from the hustle and bustle. | Fishing, Canoeing, Birdwatching, Local Culture |
Understanding Airbnb License Requirements & STR Laws in Kariba (2026)
While Kariba, Mashonaland West Province, Zimbabwe currently shows low STR regulations, specific Airbnb license requirements might still exist or change. Always verify the latest short term rental regulations and Airbnb license requirements directly with local government authorities for Kariba to ensure full compliance before hosting.
(Source: AirROI data, 2026, finding no licensed listings among those analyzed)
Top Performing Airbnb Properties in Kariba (2026)
Benchmark your potential! Explore examples of top-performing Airbnb properties in Karibabased on Trailing Twelve Month (TTM) revenue. Analyze their characteristics, revenue, occupancy rate, and ADR to understand what drives success in this market.
Muuyu lodge
Entire Place • 4 bedrooms
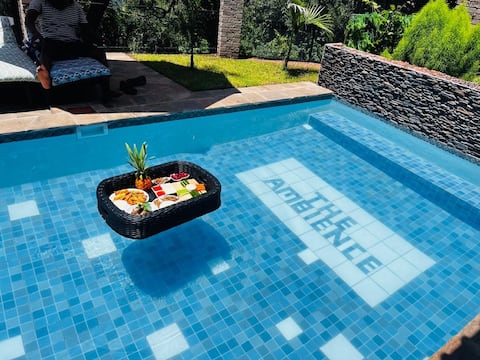
The Ambience
Entire Place • 5 bedrooms
Fisherman's Cove
Entire Place • 8 bedrooms

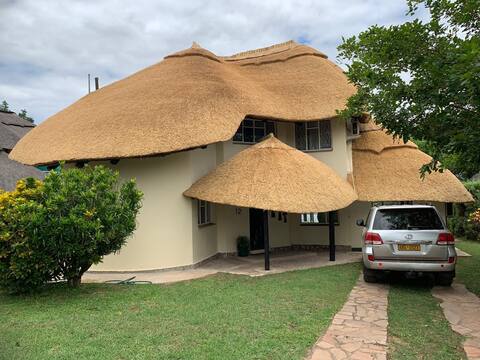
Lodge 16 Wild Heritage Kariba Zimbabwe
Entire Place • 4 bedrooms

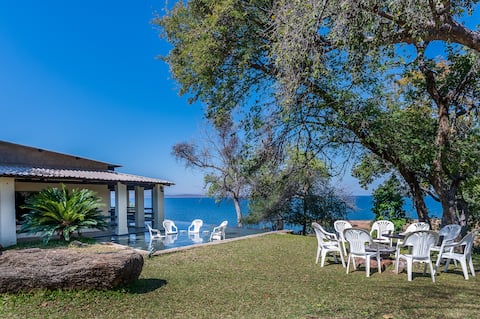
The View
Entire Place • 3 bedrooms

Nature’s Nest
Entire Place • 5 bedrooms
Note: Performance varies based on location, size, amenities, seasonality, and management quality. Data reflects the past 12 months.
Top Performing Airbnb Hosts in Kariba (2026)
Learn from the best! This table showcases top-performing Airbnb hosts in Kariba based on the number of properties managed and estimated total revenue over the past year. Analyze their scale and performance metrics.
| Host Name | Properties | Grossing Revenue | Stay Reviews | Avg Rating |
|---|---|---|---|---|
| Oliver | 1 | $31,549 | 35 | 4.89/5.0 |
| Mark | 2 | $31,353 | 4 | Not Rated |
| Eva | 1 | $28,753 | 9 | 4.78/5.0 |
| Sunera | 2 | $20,114 | 15 | 4.69/5.0 |
| Tendai | 1 | $19,930 | 14 | 4.93/5.0 |
| Tari | 1 | $18,712 | 73 | 4.81/5.0 |
| Bertha | 1 | $15,823 | 1 | Not Rated |
| Fadzayi | 1 | $13,185 | 2 | Not Rated |
| Sarita | 1 | $10,193 | 8 | 4.63/5.0 |
| Garth | 1 | $7,738 | 15 | 4.53/5.0 |
Analyzing the strategies of top hosts, such as their property selection, pricing, and guest communication, can offer valuable lessons for optimizing your own Airbnb operations in Kariba.
Dive Deeper: Advanced Kariba STR Market Data (2026)
Ready to unlock more insights? AirROI provides access to advanced metrics and comprehensive Airbnb data for Kariba. Explore detailed analytics beyond this report to refine your investment strategy, optimize pricing, and maximize your vacation rental profits.
Explore Advanced MetricsKariba Short-Term Rental Market Composition (2026): Property & Room Types
Room Type Distribution
Property Type Distribution
Market Composition Insights for Kariba
- The Kariba Airbnb market composition is heavily skewed towards Entire Home/Apt listings, which make up 76.7% of the 30 active rentals. This indicates strong guest preference for privacy and space.
- Looking at the property type distribution in Kariba, House properties are the most common (50%), reflecting the local real estate landscape.
- Houses represent a significant 50% portion, catering likely to families or larger groups.
- The presence of 16.7% Hotel/Boutique listings indicates integration with traditional hospitality.
- Smaller segments like apartment/condo (combined 3.3%) offer potential for unique stay experiences.
Kariba Airbnb Room Capacity Analysis (2026): Bedroom Distribution
Distribution of Listings by Number of Bedrooms
Room Capacity Insights for Kariba
- The dominant room capacity in Kariba is 1 bedroom listings, making up 30% of the market. This suggests a strong demand for properties suitable for couples or solo travelers.
- Together, 1 bedroom and 3 bedrooms properties represent 53.3% of the active Airbnb listings in Kariba, indicating a high concentration in these sizes.
- A significant 63.3% of listings offer 3+ bedrooms, catering to larger groups and families seeking more space in Kariba.
Kariba Vacation Rental Guest Capacity Trends (2026)
Distribution of Listings by Guest Capacity
Guest Capacity Insights for Kariba
- The most common guest capacity trend in Kariba vacation rentals is listings accommodating 8+ guests (50%). This suggests the primary traveler segment is likely larger groups.
- Properties designed for 8+ guests and 2 guests dominate the Kariba STR market, accounting for 73.3% of listings.
- 60.0% of properties accommodate 6+ guests, serving the market segment for larger families or group travel in Kariba.
- On average, properties in Kariba are equipped to host 5.4 guests.
Kariba Airbnb Booking Patterns (2026): Available vs. Booked Days
Available Days Distribution
Booked Days Distribution
Booking Pattern Insights for Kariba
- The most common availability pattern in Kariba falls within the 271-366 days range, representing 86.7% of listings. This suggests many properties have significant open periods on their calendars.
- Approximately 100.0% of listings show high availability (181+ days open annually), indicating potential for increased bookings or specific owner usage patterns.
- For booked days, the 1-30 days range is most frequent in Kariba (60%), reflecting common guest stay durations or potential owner blocking patterns.
Kariba Airbnb Minimum Stay Requirements Analysis
Distribution of Listings by Minimum Night Requirement
1 Night
19 listings
63.3% of total
2 Nights
5 listings
16.7% of total
3 Nights
1 listings
3.3% of total
30+ Nights
5 listings
16.7% of total
Key Insights
- The most prevalent minimum stay requirement in Kariba is 1 Night, adopted by 63.3% of listings. This highlights the market's preference for shorter, flexible bookings.
- A strong majority (80.0%) of the Kariba Airbnb data shows acceptance of very short stays (1-2 nights), indicating a dynamic, high-turnover market.
- A significant segment (16.7%) caters to monthly stays (30+ nights) in Kariba, pointing to opportunities in the extended-stay market.
Recommendations
- Align with the market by considering a 1 Night minimum stay, as 63.3% of Kariba hosts use this setting.
- Explore offering discounts for stays of 30+ nights to attract the 16.7% of the market seeking extended stays.
- Adjust minimum nights based on seasonality – potentially shorter during low season and longer during peak demand periods in Kariba.
Kariba Airbnb Cancellation Policy Trends Analysis (2026)
Refundable
1 listings
3.3% of total
Limited
1 listings
3.3% of total
Super Strict 30 Days
1 listings
3.3% of total
Flexible
12 listings
40% of total
Moderate
6 listings
20% of total
Firm
8 listings
26.7% of total
Strict
1 listings
3.3% of total
Cancellation Policy Insights for Kariba
- The prevailing Airbnb cancellation policy trend in Kariba is Flexible, used by 40% of listings.
- There's a relatively balanced mix between guest-friendly (60.0%) and stricter (30.0%) policies, offering choices for different guest needs.
- Strict cancellation policies are quite rare (3.3%), potentially making listings with this policy less competitive unless justified by high demand or property type.
Recommendations for Hosts
- Consider adopting a Flexible policy to align with the 40% market standard in Kariba.
- Using a Strict policy might deter some guests, as only 3.3% of listings use it. Evaluate if potential revenue protection outweighs possible lower booking rates.
- Regularly review your cancellation policy against competitors and market demand shifts in Kariba.
Kariba STR Booking Lead Time Analysis (2026)
Average Booking Lead Time by Month
Booking Lead Time Insights for Kariba
- The overall average booking lead time for vacation rentals in Kariba is 54 days.
- Guests book furthest in advance for stays during November (average 86 days), likely coinciding with peak travel demand or local events.
- The shortest booking windows occur for stays in March (average 10 days), indicating more last-minute travel plans during this time.
- Seasonally, Fall (77 days avg.) sees the longest lead times, while Spring (32 days avg.) has the shortest, reflecting typical travel planning cycles.
Recommendations for Hosts
- Use the overall average lead time (54 days) as a baseline for your pricing and availability strategy in Kariba.
- For November stays, consider implementing length-of-stay discounts or slightly higher rates for bookings made less than 86 days out to capitalize on advance planning.
- During March, focus on last-minute booking availability and promotions, as guests book with very short notice (10 days avg.).
- Target marketing efforts for the Fall season well in advance (at least 77 days) to capture early planners.
- Monitor your own booking lead times against these Kariba averages to identify opportunities for dynamic pricing adjustments.
Popular & Essential Airbnb Amenities in Kariba (2026)
Amenity Prevalence
Amenity Insights for Kariba
- Popular amenities like Free parking on premises, BBQ grill, Wifi are common but not universal. Offering these can provide a competitive edge.
- A pool is a highly desired but not standard amenity, making it a key feature for attracting guests seeking leisure in Kariba.
- Warning: Wifi is not universally provided but is considered essential globally. Ensure reliable Wifi is offered.
Recommendations for Hosts
- Consider adding popular differentiators like Free parking on premises or BBQ grill to increase appeal.
- Highlight unique or less common amenities you offer (e.g., hot tub, dedicated workspace, EV charger) in your listing description and photos.
- Regularly check competitor amenities in Kariba to stay competitive.
Kariba Airbnb Guest Demographics & Profile Analysis (2026)
Guest Profile Summary for Kariba
- The typical guest profile for Airbnb in Kariba consists of predominantly international visitors (70%), with top international origins including United Kingdom, typically belonging to the Post-2000s (Gen Z/Alpha) group (50%), primarily speaking English or German.
- Domestic travelers account for 30.0% of guests.
- Key international markets include Zimbabwe (30%) and United Kingdom (26.7%).
- Top languages spoken are English (69.2%) followed by German (7.7%).
- A significant demographic segment is the Post-2000s (Gen Z/Alpha) group, representing 50% of guests.
Recommendations for Hosts
- Focus marketing internationally, particularly towards travelers from United Kingdom.
- Tailor amenities and listing descriptions to appeal to the dominant Post-2000s (Gen Z/Alpha) demographic (e.g., highlight fast WiFi, smart home features, local guides).
- Highlight unique local experiences or amenities relevant to the primary guest profile.
- Consider seasonal promotions aligned with peak travel times for key origin markets.
Nearby Short-Term Rental Market Comparison
How does the Kariba Airbnb market stack up against its neighbors? Compare key performance metrics like average monthly revenue, ADR, and occupancy rates in surrounding areas to understand the broader regional STR landscape.
| Market | Active Properties | Monthly Revenue | Daily Rate | Avg. Occupancy |
|---|---|---|---|---|
| Lusaka | 326 | $342 | $64.85 | 30% |