Tucacas Airbnb Market Analysis 2026: Short Term Rental Data & Vacation Rental Statistics in Falcon State, Venezuela
Is Airbnb profitable in Tucacas in 2026? Explore comprehensive Airbnb analytics for Tucacas, Falcon State, Venezuela to uncover income potential. This 2026 STR market report for Tucacas, based on AirROI data from February 2025 to January 2026, reveals key trends in the niche market of 195 active listings.
Whether you're considering an Airbnb investment in Tucacas, optimizing your existing vacation rental, or exploring rental arbitrage opportunities, understanding the Tucacas Airbnb data is crucial. Leveraging the low regulation environment is key to maximizing your short term rental income potential. Let's dive into the specifics.
Key Tucacas Airbnb Performance Metrics Overview
Monthly Airbnb Revenue Variations & Income Potential in Tucacas (2026)
Understanding the monthly revenue variations for Airbnb listings in Tucacas is key to maximizing your short term rental income potential. Seasonality significantly impacts earnings. Our analysis, based on data from the past 12 months, shows that the peak revenue month for STRs in Tucacas is typically August, while November often presents the lowest earnings, highlighting opportunities for strategic pricing adjustments during shoulder and low seasons. Explore the typical Airbnb income in Tucacas across different performance tiers:
- Best-in-class properties (Top 10%) achieve $1,788+ monthly, often utilizing dynamic pricing and superior guest experiences.
- Strong performing properties (Top 25%) earn $994 or more, indicating effective management and desirable locations/amenities.
- Typical properties (Median) generate around $517 per month, representing the average market performance.
- Entry-level properties (Bottom 25%) see earnings around $257, often with potential for optimization.
Average Monthly Airbnb Earnings Trend in Tucacas
Tucacas Airbnb Occupancy Rate Trends (2026)
Maximize your bookings by understanding the Tucacas STR occupancy trends. Seasonal demand shifts significantly influence how often properties are booked. Typically, Augustsees the highest demand (peak season occupancy), while November experiences the lowest (low season). Effective strategies, like adjusting minimum stays or offering promotions, can boost occupancy during slower periods. Here's how different property tiers perform in Tucacas:
- Best-in-class properties (Top 10%) achieve 45%+ occupancy, indicating high desirability and potentially optimized availability.
- Strong performing properties (Top 25%) maintain 31% or higher occupancy, suggesting good market fit and guest satisfaction.
- Typical properties (Median) have an occupancy rate around 16%.
- Entry-level properties (Bottom 25%) average 9% occupancy, potentially facing higher vacancy.
Average Monthly Occupancy Rate Trend in Tucacas
Average Daily Rate (ADR) Airbnb Trends in Tucacas (2026)
Effective short term rental pricing strategy in Tucacas involves understanding monthly ADR fluctuations. The Average Daily Rate (ADR) for Airbnb in Tucacas typically peaks in August and dips lowest during October. Leveraging Airbnb dynamic pricing tools or strategies based on this seasonality can significantly boost revenue. Here's a look at the typical nightly rates achieved:
- Best-in-class properties (Top 10%) command rates of $263+ per night, often due to premium features or locations.
- Strong performing properties (Top 25%) achieve nightly rates of $168 or more.
- Typical properties (Median) charge around $95 per night.
- Entry-level properties (Bottom 25%) earn around $70 per night.
Average Daily Rate (ADR) Trend by Month in Tucacas
Get Live Tucacas Market Intelligence 👇

Explore Real-time Analytics
Airbnb Seasonality Analysis & Trends in Tucacas (2026)
Peak Season (August, July, April)
- Revenue averages $1,040 per month
- Occupancy rates average 27.5%
- Daily rates average $135
Shoulder Season
- Revenue averages $777 per month
- Occupancy maintains around 20.7%
- Daily rates hold near $134
Low Season (May, October, November)
- Revenue drops to average $599 per month
- Occupancy decreases to average 17.4%
- Daily rates adjust to average $130
Seasonality Insights for Tucacas
- The Airbnb seasonality in Tucacas shows highly seasonal trends requiring careful strategy. While the sections above show seasonal averages, it's also insightful to look at the extremes:
- During the high season, the absolute peak month showcases Tucacas's highest earning potential, with monthly revenues capable of climbing to $1,167, occupancy reaching a high of 30.3%, and ADRs peaking at $136.
- Conversely, the slowest single month of the year, typically falling within the low season, marks the market's lowest point. In this month, revenue might dip to $567, occupancy could drop to 16.4%, and ADRs may adjust down to $128.
- Understanding both the seasonal averages and these monthly peaks and troughs in revenue, occupancy, and ADR is crucial for maximizing your Airbnb profit potential in Tucacas.
Seasonal Strategies for Maximizing Profit
- Peak Season: Maximize revenue through premium pricing and potentially longer minimum stays. Ensure high availability.
- Low Season: Offer competitive pricing, special promotions (e.g., extended stay discounts), and flexible cancellation policies. Target off-season travelers like remote workers or budget-conscious guests.
- Shoulder Seasons: Implement dynamic pricing that balances peak and low rates. Target weekend travelers or specific events. Offer slightly more flexible terms than peak season.
- Regularly analyze your own performance against these Tucacas seasonality benchmarks and adjust your pricing and availability strategy accordingly.
Best Areas for Airbnb Investment in Tucacas (2026)
Exploring the top neighborhoods for short-term rentals in Tucacas? This section highlights key areas, outlining why they are attractive for hosts and guests, along with notable local attractions. Consider these locations based on your target guest profile and investment strategy.
| Neighborhood / Area | Why Host Here? (Target Guests & Appeal) | Key Attractions & Landmarks |
|---|---|---|
| Los Cayos | A popular beach area known for its stunning landscapes and diverse marine life. Ideal for tourists seeking relaxation and water activities, making it a prime location for vacation rentals. | Los Cayos Beach, Island hopping tours, Snorkeling and diving, Fishing expeditions, Beautiful sunsets |
| Boca de Aroa | A tranquil coastal village that offers a more serene experience compared to the bustling tourist spots. Perfect for families and couples looking for a peaceful getaway. | Boca de Aroa Beach, Natural parks nearby, Water sports, Local seafood restaurants, Cultural experiences with local communities |
| Morrocoy National Park | A protected area known for its stunning beaches and diverse ecosystems. An excellent location for eco-tourism and attracting nature lovers and adventure seekers. | Cayo de Agua, Cayo Sal, Birdwatching, Beach camping, Diverse wildlife |
| Chichiriviche | Known as a gateway to Morrocoy National Park, this town offers easy access to beautiful beaches and is a popular spot for day-trippers and eco-tourists. | Chichiriviche Beach, Access to Morrocoy's cays, Local Markets, Fishing opportunities, Nearby excursions |
| Tucacas town | The main town in the Morrocoy region, it's bustling with amenities and services. This area attracts a mix of tourists and locals, making it ideal for renting out spaces. | Local restaurants, Shopping areas, Cultural activities, Access to transportation, Historical sites |
| Puerto Cumarebo | A lesser-known beach location that offers an authentic Venezuelan beach experience with fewer tourists. Ideal for intimate and unique stays. | Cumarebo Beach, Local fishing communities, Relaxed atmosphere, Traditional cuisine, Natural scenery |
| Bahia de Cata | A vibrant beach community known for its lively atmosphere and beautiful beaches. It attracts younger crowds looking for entertainment and fun. | Bahia de Cata Beach, Nightlife options, Water sports, Beachfront restaurants, Music festivals |
| El Cardonal | A quaint fishing village that offers a glimpse into traditional Venezuelan coastal life. Great for tourists looking for cultural immersion and local experiences. | Fishing opportunities, Local markets, Traditional food, Cultural experiences, Natural beauty |
Understanding Airbnb License Requirements & STR Laws in Tucacas (2026)
While Tucacas, Falcon State, Venezuela currently shows low STR regulations, specific Airbnb license requirements might still exist or change. Always verify the latest short term rental regulations and Airbnb license requirements directly with local government authorities for Tucacas to ensure full compliance before hosting.
(Source: AirROI data, 2026, finding no licensed listings among those analyzed)
Top Performing Airbnb Properties in Tucacas (2026)
Benchmark your potential! Explore examples of top-performing Airbnb properties in Tucacasbased on Trailing Twelve Month (TTM) revenue. Analyze their characteristics, revenue, occupancy rate, and ADR to understand what drives success in this market.
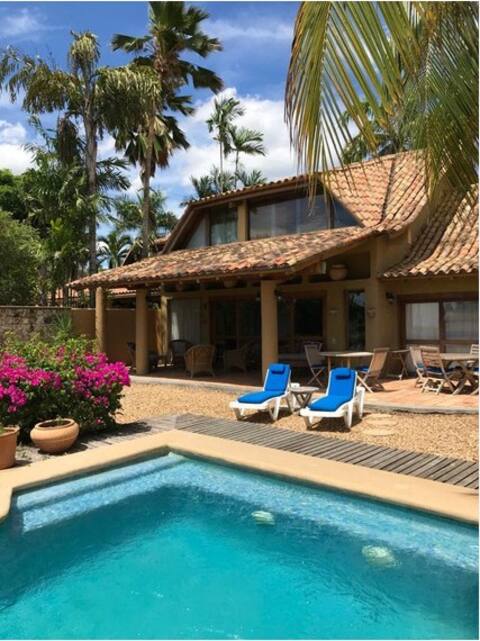
Spectacular house in the Retiro
Entire Place • 4 bedrooms

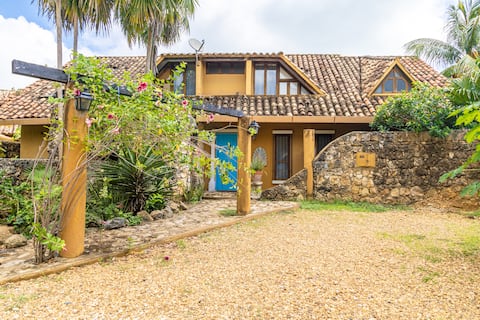
Charming villa, Morrocoy
Entire Place • 3 bedrooms

2 Beach Apartments 18 Guests Power Gen WiFi
Entire Place • 4 bedrooms
Colonial Villa in Tucacas
Entire Place • 5 bedrooms

2 Beach Houses +16 Guests Power Gen WiFi
Entire Place • 5 bedrooms

Amazing house in Morrocoy.
Entire Place • 4 bedrooms
Note: Performance varies based on location, size, amenities, seasonality, and management quality. Data reflects the past 12 months.
Top Performing Airbnb Hosts in Tucacas (2026)
Learn from the best! This table showcases top-performing Airbnb hosts in Tucacas based on the number of properties managed and estimated total revenue over the past year. Analyze their scale and performance metrics.
| Host Name | Properties | Grossing Revenue | Stay Reviews | Avg Rating |
|---|---|---|---|---|
| Tucacasbeachhomes | 8 | $132,158 | 89 | 4.96/5.0 |
| Enderson | 3 | $97,198 | 195 | 4.92/5.0 |
| Julie A | 4 | $52,132 | 108 | 4.78/5.0 |
| Leonardo | 5 | $48,602 | 36 | 4.93/5.0 |
| Hans | 1 | $24,571 | 12 | 4.92/5.0 |
| Gustavo | 2 | $23,210 | 205 | 4.79/5.0 |
| Germany | 3 | $21,362 | 75 | 4.75/5.0 |
| Plamen | 1 | $20,222 | 175 | 4.80/5.0 |
| Sofia | 1 | $19,973 | 64 | 4.88/5.0 |
| Abril | 2 | $19,352 | 176 | 4.78/5.0 |
Analyzing the strategies of top hosts, such as their property selection, pricing, and guest communication, can offer valuable lessons for optimizing your own Airbnb operations in Tucacas.
Dive Deeper: Advanced Tucacas STR Market Data (2026)
Ready to unlock more insights? AirROI provides access to advanced metrics and comprehensive Airbnb data for Tucacas. Explore detailed analytics beyond this report to refine your investment strategy, optimize pricing, and maximize your vacation rental profits.
Explore Advanced MetricsTucacas Short-Term Rental Market Composition (2026): Property & Room Types
Room Type Distribution
Property Type Distribution
Market Composition Insights for Tucacas
- The Tucacas Airbnb market composition is heavily skewed towards Entire Home/Apt listings, which make up 96.9% of the 195 active rentals. This indicates strong guest preference for privacy and space.
- Looking at the property type distribution in Tucacas, Apartment/Condo properties are the most common (67.2%), reflecting the local real estate landscape.
- Houses represent a significant 29.2% portion, catering likely to families or larger groups.
- Smaller segments like hotel/boutique, others (combined 3.6%) offer potential for unique stay experiences.
Tucacas Airbnb Room Capacity Analysis (2026): Bedroom Distribution
Distribution of Listings by Number of Bedrooms
Room Capacity Insights for Tucacas
- The dominant room capacity in Tucacas is 2 bedrooms listings, making up 37.4% of the market. This suggests a strong demand for properties suitable for couples or solo travelers.
- Together, 2 bedrooms and 1 bedroom properties represent 64.6% of the active Airbnb listings in Tucacas, indicating a high concentration in these sizes.
- A significant 33.8% of listings offer 3+ bedrooms, catering to larger groups and families seeking more space in Tucacas.
Tucacas Vacation Rental Guest Capacity Trends (2026)
Distribution of Listings by Guest Capacity
Guest Capacity Insights for Tucacas
- The most common guest capacity trend in Tucacas vacation rentals is listings accommodating 8+ guests (45.1%). This suggests the primary traveler segment is likely larger groups.
- Properties designed for 8+ guests and 6 guests dominate the Tucacas STR market, accounting for 73.3% of listings.
- 83.0% of properties accommodate 6+ guests, serving the market segment for larger families or group travel in Tucacas.
- On average, properties in Tucacas are equipped to host 6.7 guests.
Tucacas Airbnb Booking Patterns (2026): Available vs. Booked Days
Available Days Distribution
Booked Days Distribution
Booking Pattern Insights for Tucacas
- The most common availability pattern in Tucacas falls within the 271-366 days range, representing 86.2% of listings. This suggests many properties have significant open periods on their calendars.
- Approximately 99.5% of listings show high availability (181+ days open annually), indicating potential for increased bookings or specific owner usage patterns.
- For booked days, the 1-30 days range is most frequent in Tucacas (53.3%), reflecting common guest stay durations or potential owner blocking patterns.
- A notable 0.5% of properties secure long booking periods (181+ days booked per year), highlighting successful long-term rental strategies or significant owner usage.
Tucacas Airbnb Minimum Stay Requirements Analysis
Distribution of Listings by Minimum Night Requirement
1 Night
60 listings
30.8% of total
2 Nights
83 listings
42.6% of total
4-6 Nights
1 listings
0.5% of total
7-29 Nights
1 listings
0.5% of total
30+ Nights
50 listings
25.6% of total
Key Insights
- The most prevalent minimum stay requirement in Tucacas is 2 Nights, adopted by 42.6% of listings. This highlights the market's preference for shorter, flexible bookings.
- A strong majority (73.4%) of the Tucacas Airbnb data shows acceptance of very short stays (1-2 nights), indicating a dynamic, high-turnover market.
- A significant segment (25.6%) caters to monthly stays (30+ nights) in Tucacas, pointing to opportunities in the extended-stay market.
Recommendations
- Align with the market by considering a 2 Nights minimum stay, as 42.6% of Tucacas hosts use this setting.
- Explore offering discounts for stays of 30+ nights to attract the 25.6% of the market seeking extended stays.
- Adjust minimum nights based on seasonality – potentially shorter during low season and longer during peak demand periods in Tucacas.
Tucacas Airbnb Cancellation Policy Trends Analysis (2026)
Limited
5 listings
2.6% of total
Flexible
63 listings
32.5% of total
Moderate
57 listings
29.4% of total
Firm
51 listings
26.3% of total
Strict
18 listings
9.3% of total
Cancellation Policy Insights for Tucacas
- The prevailing Airbnb cancellation policy trend in Tucacas is Flexible, used by 32.5% of listings.
- There's a relatively balanced mix between guest-friendly (61.9%) and stricter (35.6%) policies, offering choices for different guest needs.
- Strict cancellation policies are quite rare (9.3%), potentially making listings with this policy less competitive unless justified by high demand or property type.
Recommendations for Hosts
- Consider adopting a Flexible policy to align with the 32.5% market standard in Tucacas.
- Using a Strict policy might deter some guests, as only 9.3% of listings use it. Evaluate if potential revenue protection outweighs possible lower booking rates.
- Regularly review your cancellation policy against competitors and market demand shifts in Tucacas.
Tucacas STR Booking Lead Time Analysis (2026)
Average Booking Lead Time by Month
Booking Lead Time Insights for Tucacas
- The overall average booking lead time for vacation rentals in Tucacas is 18 days.
- Guests book furthest in advance for stays during December (average 34 days), likely coinciding with peak travel demand or local events.
- The shortest booking windows occur for stays in June (average 9 days), indicating more last-minute travel plans during this time.
- Seasonally, Winter (23 days avg.) sees the longest lead times, while Summer (12 days avg.) has the shortest, reflecting typical travel planning cycles.
Recommendations for Hosts
- Use the overall average lead time (18 days) as a baseline for your pricing and availability strategy in Tucacas.
- For December stays, consider implementing length-of-stay discounts or slightly higher rates for bookings made less than 34 days out to capitalize on advance planning.
- During June, focus on last-minute booking availability and promotions, as guests book with very short notice (9 days avg.).
- Target marketing efforts for the Winter season well in advance (at least 23 days) to capture early planners.
- Monitor your own booking lead times against these Tucacas averages to identify opportunities for dynamic pricing adjustments.
Popular & Essential Airbnb Amenities in Tucacas (2026)
Amenity Prevalence
Amenity Insights for Tucacas
- Essential amenities in Tucacas that guests expect include: Air conditioning, Free parking on premises, Kitchen. Lacking these (any) could significantly impact bookings.
- Popular amenities like Wifi, Pool, TV are common but not universal. Offering these can provide a competitive edge.
- A pool is a highly desired but not standard amenity, making it a key feature for attracting guests seeking leisure in Tucacas.
- Warning: Wifi is not universally provided but is considered essential globally. Ensure reliable Wifi is offered.
Recommendations for Hosts
- Ensure your listing includes all essential amenities for Tucacas: Air conditioning, Free parking on premises, Kitchen.
- Prioritize adding missing essentials: Air conditioning, Free parking on premises, Kitchen.
- Consider adding popular differentiators like Wifi or Pool to increase appeal.
- Highlight unique or less common amenities you offer (e.g., hot tub, dedicated workspace, EV charger) in your listing description and photos.
- Regularly check competitor amenities in Tucacas to stay competitive.
Tucacas Airbnb Guest Demographics & Profile Analysis (2026)
Guest Profile Summary for Tucacas
- The typical guest profile for Airbnb in Tucacas consists of a mix of domestic (43%) and international guests, with top international origins including United States, typically belonging to the Post-2000s (Gen Z/Alpha) group (50%), primarily speaking Spanish or English.
- Domestic travelers account for 42.5% of guests.
- Key international markets include Venezuela (42.5%) and United States (13.2%).
- Top languages spoken are Spanish (57.9%) followed by English (30%).
- A significant demographic segment is the Post-2000s (Gen Z/Alpha) group, representing 50% of guests.
Recommendations for Hosts
- Balance marketing efforts between domestic and international channels based on the guest mix.
- Tailor amenities and listing descriptions to appeal to the dominant Post-2000s (Gen Z/Alpha) demographic (e.g., highlight fast WiFi, smart home features, local guides).
- Highlight unique local experiences or amenities relevant to the primary guest profile.
- Consider seasonal promotions aligned with peak travel times for key origin markets.
Nearby Short-Term Rental Market Comparison
How does the Tucacas Airbnb market stack up against its neighbors? Compare key performance metrics like average monthly revenue, ADR, and occupancy rates in surrounding areas to understand the broader regional STR landscape.
| Market | Active Properties | Monthly Revenue | Daily Rate | Avg. Occupancy |
|---|---|---|---|---|
| Chichiriviche | 48 | $413 | $105.37 | 19% |
| Colonia Tovar | 20 | $389 | $173.04 | 16% |
| Barquisimeto | 18 | $367 | $55.73 | 35% |
| Parroquia María de San José | 29 | $356 | $47.60 | 33% |
| Parroquia Santa Rosa | 16 | $354 | $47.81 | 32% |
| El Manzano | 19 | $332 | $46.93 | 31% |
| Urbanización Cata | 11 | $330 | $95.09 | 15% |
| Parroquia San José | 110 | $306 | $41.74 | 33% |
| Boca de Aroa | 18 | $302 | $86.78 | 19% |
| Naguanagua | 51 | $291 | $45.98 | 31% |