Piriápolis Airbnb Market Analysis 2025: Short Term Rental Data & Vacation Rental Statistics in Departamento de Maldonado, Uruguay
Is Airbnb profitable in Piriápolis in 2025? Explore comprehensive Airbnb analytics for Piriápolis, Departamento de Maldonado, Uruguay to uncover income potential. This 2025 STR market report for Piriápolis, based on AirROI data from June 2024 to May 2025, reveals key trends in the niche market of 26 active listings.
Whether you're considering an Airbnb investment in Piriápolis, optimizing your existing vacation rental, or exploring rental arbitrage opportunities, understanding the Piriápolis Airbnb data is crucial. Leveraging the low regulation environment is key to maximizing your short term rental income potential. Let's dive into the specifics.
Key Piriápolis Airbnb Performance Metrics Overview
Monthly Airbnb Revenue Variations & Income Potential in Piriápolis (2025)
Understanding the monthly revenue variations for Airbnb listings in Piriápolis is key to maximizing your short term rental income potential. Seasonality significantly impacts earnings. Our analysis, based on data from the past 12 months, shows that the peak revenue month for STRs in Piriápolis is typically January, while June often presents the lowest earnings, highlighting opportunities for strategic pricing adjustments during shoulder and low seasons. Explore the typical Airbnb income in Piriápolis across different performance tiers:
- Best-in-class properties (Top 10%) achieve $1,920+ monthly, often utilizing dynamic pricing and superior guest experiences.
- Strong performing properties (Top 25%) earn $1,410 or more, indicating effective management and desirable locations/amenities.
- Typical properties (Median) generate around $763 per month, representing the average market performance.
- Entry-level properties (Bottom 25%) see earnings around $351, often with potential for optimization.
Average Monthly Airbnb Earnings Trend in Piriápolis
Piriápolis Airbnb Occupancy Rate Trends (2025)
Maximize your bookings by understanding the Piriápolis STR occupancy trends. Seasonal demand shifts significantly influence how often properties are booked. Typically, Februarysees the highest demand (peak season occupancy), while June experiences the lowest (low season). Effective strategies, like adjusting minimum stays or offering promotions, can boost occupancy during slower periods. Here's how different property tiers perform in Piriápolis:
- Best-in-class properties (Top 10%) achieve 57%+ occupancy, indicating high desirability and potentially optimized availability.
- Strong performing properties (Top 25%) maintain 40% or higher occupancy, suggesting good market fit and guest satisfaction.
- Typical properties (Median) have an occupancy rate around 21%.
- Entry-level properties (Bottom 25%) average 13% occupancy, potentially facing higher vacancy.
Average Monthly Occupancy Rate Trend in Piriápolis
Average Daily Rate (ADR) Airbnb Trends in Piriápolis (2025)
Effective short term rental pricing strategy in Piriápolis involves understanding monthly ADR fluctuations. The Average Daily Rate (ADR) for Airbnb in Piriápolis typically peaks in December and dips lowest during January. Leveraging Airbnb dynamic pricing tools or strategies based on this seasonality can significantly boost revenue. Here's a look at the typical nightly rates achieved:
- Best-in-class properties (Top 10%) command rates of $254+ per night, often due to premium features or locations.
- Strong performing properties (Top 25%) achieve nightly rates of $144 or more.
- Typical properties (Median) charge around $103 per night.
- Entry-level properties (Bottom 25%) earn around $69 per night.
Average Daily Rate (ADR) Trend by Month in Piriápolis
Get Live Piriápolis Market Intelligence 👇

Explore Real-time Analytics
Airbnb Seasonality Analysis & Trends in Piriápolis (2025)
Peak Season (January, February, December)
- Revenue averages $1,750 per month
- Occupancy rates average 47.0%
- Daily rates average $152
Shoulder Season
- Revenue averages $765 per month
- Occupancy maintains around 23.6%
- Daily rates hold near $161
Low Season (May, June, August)
- Revenue drops to average $524 per month
- Occupancy decreases to average 14.9%
- Daily rates adjust to average $161
Seasonality Insights for Piriápolis
- The Airbnb seasonality in Piriápolis shows highly seasonal trends requiring careful strategy. While the sections above show seasonal averages, it's also insightful to look at the extremes:
- During the high season, the absolute peak month showcases Piriápolis's highest earning potential, with monthly revenues capable of climbing to $2,257, occupancy reaching a high of 56.9%, and ADRs peaking at $178.
- Conversely, the slowest single month of the year, typically falling within the low season, marks the market's lowest point. In this month, revenue might dip to $358, occupancy could drop to 11.9%, and ADRs may adjust down to $137.
- Understanding both the seasonal averages and these monthly peaks and troughs in revenue, occupancy, and ADR is crucial for maximizing your Airbnb profit potential in Piriápolis.
Seasonal Strategies for Maximizing Profit
- Peak Season: Maximize revenue through premium pricing and potentially longer minimum stays. Ensure high availability.
- Low Season: Offer competitive pricing, special promotions (e.g., extended stay discounts), and flexible cancellation policies. Target off-season travelers like remote workers or budget-conscious guests.
- Shoulder Seasons: Implement dynamic pricing that balances peak and low rates. Target weekend travelers or specific events. Offer slightly more flexible terms than peak season.
- Regularly analyze your own performance against these Piriápolis seasonality benchmarks and adjust your pricing and availability strategy accordingly.
Best Areas for Airbnb Investment in Piriápolis (2025)
Exploring the top neighborhoods for short-term rentals in Piriápolis? This section highlights key areas, outlining why they are attractive for hosts and guests, along with notable local attractions. Consider these locations based on your target guest profile and investment strategy.
| Neighborhood / Area | Why Host Here? (Target Guests & Appeal) | Key Attractions & Landmarks |
|---|---|---|
| La Brava | Known for its beautiful coastline and excellent surfing conditions, La Brava attracts tourists looking for beach activities and relaxation. | Brava Beach, Punta del Este Lighthouse, Isla Gorriti, Punta Shopping, The Arboretum, La Barra |
| La Mansa | A more tranquil beach area, suitable for families and those looking to enjoy calm waters and scenic views. | Mansa Beach, Punta del Este Port, Rooftop Bars, Shopping del Este, Caminho de Piriápolis |
| Piriápolis Central | A historic town center that offers a blend of culture and beach life, making it attractive for tourists who want convenience. | Hotel Argentino, Cerro del Toro, Piriápolis Castle, Francisco Piria Square, Calzadas de Piriápolis |
| Cerro Verde | A charming area with scenic views and hiking trails, popular for nature lovers and those looking for an outdoor experience. | Cerro del Horno, Rural Hiking Trails, Nature Parks, Mirador de Piriápolis |
| Solanas | A picturesque area known for its beautiful nature and beachfront properties, ideal for eco-tourism. | Solanas Beach, Nature Reserves, Solanas Forest, Nearby Nature Trails |
| San Francisco | A quieter beach area, great for relaxation, attracting families and travelers seeking a laid-back vibe. | San Francisco Beach, Beachfront Bars, Local Markets, Outdoor Activities |
| Argentinos Beach | A secluded beach spot that provides a more private experience, appealing to couples and individual travelers seeking tranquility. | Argentinos Beach, Cliff Walks, Local Seafood Restaurants, Nature Walks |
| Parque de la Luna | A unique park area offering cultural events and open air spaces, attracting visitors interested in local art and community activities. | Cultural Events, Art Installations, Parks and Gardens, Event Spaces |
Understanding Airbnb License Requirements & STR Laws in Piriápolis (2025)
While Piriápolis, Departamento de Maldonado, Uruguay currently shows low STR regulations, specific Airbnb license requirements might still exist or change. Always verify the latest short term rental regulations and Airbnb license requirements directly with local government authorities for Piriápolis to ensure full compliance before hosting.
(Source: AirROI data, 2025, finding no licensed listings among those analyzed)
Top Performing Airbnb Properties in Piriápolis (2025)
Benchmark your potential! Explore examples of top-performing Airbnb properties in Piriápolisbased on Trailing Twelve Month (TTM) revenue. Analyze their characteristics, revenue, occupancy rate, and ADR to understand what drives success in this market.

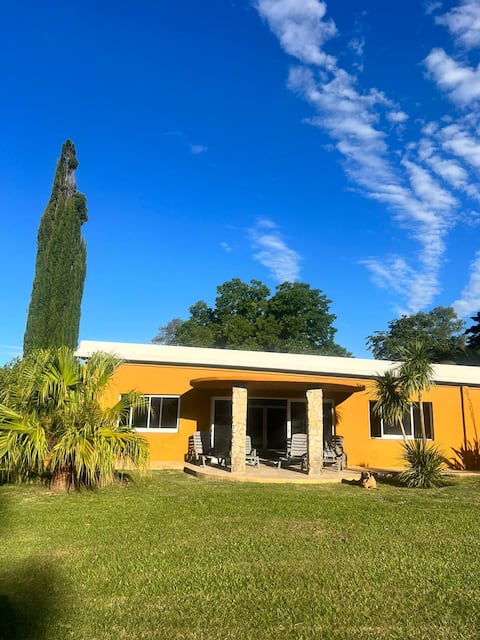
Casa de Campo Vista -Piscina -Todo Incl
Entire Place • 4 bedrooms
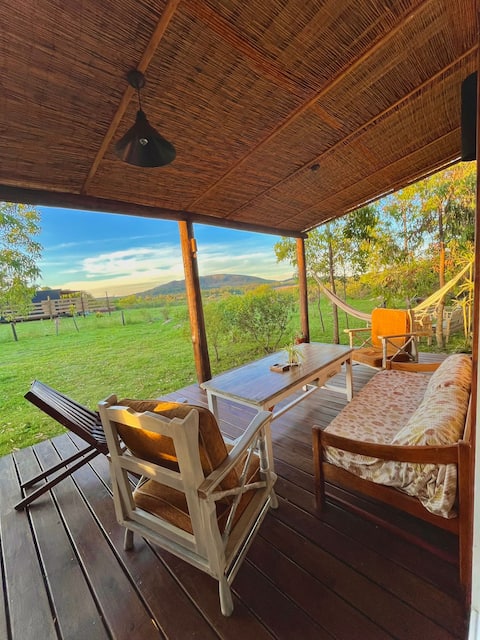
Beautiful cabin with a view of the hills near the sea
Entire Place • 2 bedrooms

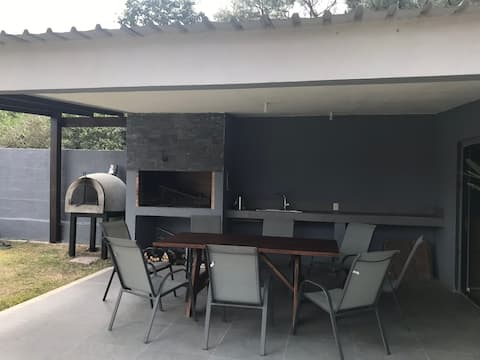
Campo y playa - Punta Colorada.
Entire Place • 3 bedrooms
chacra con piscina climatizada
Entire Place • 3 bedrooms
Entire Place • 3 bedrooms

“Las Raquel” 4 blocks from the beach ,Punta Negra
Entire Place • 1 bedroom
Note: Performance varies based on location, size, amenities, seasonality, and management quality. Data reflects the past 12 months.
Top Performing Airbnb Hosts in Piriápolis (2025)
Learn from the best! This table showcases top-performing Airbnb hosts in Piriápolis based on the number of properties managed and estimated total revenue over the past year. Analyze their scale and performance metrics.
| Host Name | Properties | Grossing Revenue | Stay Reviews | Avg Rating |
|---|---|---|---|---|
| Alejandro | 1 | $29,813 | 27 | 4.93/5.0 |
| Lorena | 3 | $17,110 | 68 | 4.64/5.0 |
| Florencia | 1 | $17,045 | 67 | 4.93/5.0 |
| Ivana | 1 | $16,809 | 35 | 4.66/5.0 |
| Host #398075329 | 1 | $15,744 | 0 | N/A/5.0 |
| Mariana | 1 | $11,812 | 7 | 5.00/5.0 |
| Florencia | 1 | $10,888 | 33 | 4.82/5.0 |
| Paul | 2 | $10,170 | 10 | 5.00/5.0 |
| Caro | 1 | $9,206 | 29 | 4.90/5.0 |
| Dario | 1 | $7,853 | 11 | 4.73/5.0 |
Analyzing the strategies of top hosts, such as their property selection, pricing, and guest communication, can offer valuable lessons for optimizing your own Airbnb operations in Piriápolis.
Dive Deeper: Advanced Piriápolis STR Market Data (2025)
Ready to unlock more insights? AirROI provides access to advanced metrics and comprehensive Airbnb data for Piriápolis. Explore detailed analytics beyond this report to refine your investment strategy, optimize pricing, and maximize your vacation rental profits.
Explore Advanced MetricsPiriápolis Short-Term Rental Market Composition (2025): Property & Room Types
Room Type Distribution
Property Type Distribution
Market Composition Insights for Piriápolis
- The Piriápolis Airbnb market composition is heavily skewed towards Entire Home/Apt listings, which make up 100% of the 26 active rentals. This indicates strong guest preference for privacy and space.
- Looking at the property type distribution in Piriápolis, House properties are the most common (61.5%), reflecting the local real estate landscape.
- Houses represent a significant 61.5% portion, catering likely to families or larger groups.
Piriápolis Airbnb Room Capacity Analysis (2025): Bedroom Distribution
Distribution of Listings by Number of Bedrooms
Room Capacity Insights for Piriápolis
- The dominant room capacity in Piriápolis is 2 bedrooms listings, making up 50% of the market. This suggests a strong demand for properties suitable for couples or solo travelers.
- Together, 2 bedrooms and 1 bedroom properties represent 84.6% of the active Airbnb listings in Piriápolis, indicating a high concentration in these sizes.
Piriápolis Vacation Rental Guest Capacity Trends (2025)
Distribution of Listings by Guest Capacity
Guest Capacity Insights for Piriápolis
- The most common guest capacity trend in Piriápolis vacation rentals is listings accommodating 4 guests (30.8%). This suggests the primary traveler segment is likely small families or groups.
- Properties designed for 4 guests and 5 guests dominate the Piriápolis STR market, accounting for 61.6% of listings.
- 23.1% of properties accommodate 6+ guests, serving the market segment for larger families or group travel in Piriápolis.
- On average, properties in Piriápolis are equipped to host 4.7 guests.
Piriápolis Airbnb Booking Patterns (2025): Available vs. Booked Days
Available Days Distribution
Booked Days Distribution
Booking Pattern Insights for Piriápolis
- The most common availability pattern in Piriápolis falls within the 271-366 days range, representing 76.9% of listings. This suggests many properties have significant open periods on their calendars.
- Approximately 100.0% of listings show high availability (181+ days open annually), indicating potential for increased bookings or specific owner usage patterns.
- For booked days, the 1-30 days range is most frequent in Piriápolis (42.3%), reflecting common guest stay durations or potential owner blocking patterns.
Piriápolis Airbnb Minimum Stay Requirements Analysis
Distribution of Listings by Minimum Night Requirement
1 Night
2 listings
7.7% of total
2 Nights
2 listings
7.7% of total
3 Nights
5 listings
19.2% of total
4-6 Nights
3 listings
11.5% of total
7-29 Nights
2 listings
7.7% of total
30+ Nights
12 listings
46.2% of total
Key Insights
- The most prevalent minimum stay requirement in Piriápolis is 30+ Nights, adopted by 46.2% of listings. This highlights the market's preference for longer commitments.
- Very short stays (1-2 nights) are less common (15.4%), suggesting hosts prefer slightly longer bookings to optimize turnover.
- A significant segment (46.2%) caters to monthly stays (30+ nights) in Piriápolis, pointing to opportunities in the extended-stay market.
Recommendations
- Align with the market by considering a 30+ Nights minimum stay, as 46.2% of Piriápolis hosts use this setting.
- If feasible, allowing 1-night stays, especially midweek or during low season, could capture last-minute bookings, as only 7.7% currently do.
- Explore offering discounts for stays of 30+ nights to attract the 46.2% of the market seeking extended stays.
- Adjust minimum nights based on seasonality – potentially shorter during low season and longer during peak demand periods in Piriápolis.
Piriápolis Airbnb Cancellation Policy Trends Analysis (2025)
Flexible
6 listings
27.3% of total
Moderate
3 listings
13.6% of total
Firm
5 listings
22.7% of total
Strict
8 listings
36.4% of total
Cancellation Policy Insights for Piriápolis
- The prevailing Airbnb cancellation policy trend in Piriápolis is Strict, used by 36.4% of listings.
- A majority (59.1%) of hosts in Piriápolis utilize Firm or Strict policies, indicating a market where hosts prioritize booking security.
Recommendations for Hosts
- Consider adopting a Strict policy to align with the 36.4% market standard in Piriápolis.
- With 36.4% using Strict terms, this is a viable option in Piriápolis, particularly for high-value properties or during peak demand periods.
- Regularly review your cancellation policy against competitors and market demand shifts in Piriápolis.
Piriápolis STR Booking Lead Time Analysis (2025)
Average Booking Lead Time by Month
Booking Lead Time Insights for Piriápolis
- The overall average booking lead time for vacation rentals in Piriápolis is 29 days.
- Guests book furthest in advance for stays during November (average 51 days), likely coinciding with peak travel demand or local events.
- The shortest booking windows occur for stays in June (average 3 days), indicating more last-minute travel plans during this time.
- Seasonally, Fall (45 days avg.) sees the longest lead times, while Summer (12 days avg.) has the shortest, reflecting typical travel planning cycles.
Recommendations for Hosts
- Use the overall average lead time (29 days) as a baseline for your pricing and availability strategy in Piriápolis.
- For November stays, consider implementing length-of-stay discounts or slightly higher rates for bookings made less than 51 days out to capitalize on advance planning.
- During June, focus on last-minute booking availability and promotions, as guests book with very short notice (3 days avg.).
- Target marketing efforts for the Fall season well in advance (at least 45 days) to capture early planners.
- Monitor your own booking lead times against these Piriápolis averages to identify opportunities for dynamic pricing adjustments.
Popular & Essential Airbnb Amenities in Piriápolis (2025)
Amenity Prevalence
Amenity Insights for Piriápolis
- Essential amenities in Piriápolis that guests expect include: Kitchen. Lacking these (this) could significantly impact bookings.
- Popular amenities like TV, Hot water, Dishes and silverware are common but not universal. Offering these can provide a competitive edge.
Recommendations for Hosts
- Ensure your listing includes all essential amenities for Piriápolis: Kitchen.
- Prioritize adding missing essentials: Kitchen.
- Consider adding popular differentiators like TV or Hot water to increase appeal.
- Highlight unique or less common amenities you offer (e.g., hot tub, dedicated workspace, EV charger) in your listing description and photos.
- Regularly check competitor amenities in Piriápolis to stay competitive.
Piriápolis Airbnb Guest Demographics & Profile Analysis (2025)
Guest Profile Summary for Piriápolis
- The typical guest profile for Airbnb in Piriápolis consists of primarily domestic travelers (85%), often arriving from nearby Montevideo, typically belonging to the Post-2000s (Gen Z/Alpha) group (50%), primarily speaking Spanish or English.
- Domestic travelers account for 85.4% of guests.
- Key international markets include Uruguay (85.4%) and Argentina (10.4%).
- Top languages spoken are Spanish (45.6%) followed by English (38.9%).
- A significant demographic segment is the Post-2000s (Gen Z/Alpha) group, representing 50% of guests.
Recommendations for Hosts
- Target domestic marketing efforts towards travelers from Montevideo and Buenos Aires.
- Tailor amenities and listing descriptions to appeal to the dominant Post-2000s (Gen Z/Alpha) demographic (e.g., highlight fast WiFi, smart home features, local guides).
- Highlight unique local experiences or amenities relevant to the primary guest profile.
- Consider seasonal promotions aligned with peak travel times for key origin markets.
Nearby Short-Term Rental Market Comparison
How does the Piriápolis Airbnb market stack up against its neighbors? Compare key performance metrics like average monthly revenue, ADR, and occupancy rates in surrounding areas to understand the broader regional STR landscape.
| Market | Active Properties | Monthly Revenue | Daily Rate | Avg. Occupancy |
|---|---|---|---|---|
| Departamento de Maldonado | 14 | $1,785 | $214.44 | 25% |
| La Barra | 23 | $1,659 | $582.12 | 27% |
| San Rafael - El Placer | 132 | $1,649 | $465.15 | 28% |
| José Ignacio | 267 | $1,629 | $423.26 | 29% |
| La Barra | 203 | $1,577 | $375.36 | 31% |
| Fortín de Santa Rosa | 12 | $1,562 | $224.49 | 29% |
| Punta del Este | 13 | $1,503 | $456.35 | 29% |
| Manantiales | 105 | $1,437 | $408.60 | 31% |
| Punta Ballena | 505 | $1,336 | $204.54 | 33% |
| Pan de Azúcar | 19 | $1,332 | $231.21 | 22% |