Santa Ana Airbnb Market Analysis 2025: Short Term Rental Data & Vacation Rental Statistics in Colonia, Uruguay
Is Airbnb profitable in Santa Ana in 2025? Explore comprehensive Airbnb analytics for Santa Ana, Colonia, Uruguay to uncover income potential. This 2025 STR market report for Santa Ana, based on AirROI data from June 2024 to May 2025, reveals key trends in the niche market of 96 active listings.
Whether you're considering an Airbnb investment in Santa Ana, optimizing your existing vacation rental, or exploring rental arbitrage opportunities, understanding the Santa Ana Airbnb data is crucial. Leveraging the low regulation environment is key to maximizing your short term rental income potential. Let's dive into the specifics.
Key Santa Ana Airbnb Performance Metrics Overview
Monthly Airbnb Revenue Variations & Income Potential in Santa Ana (2025)
Understanding the monthly revenue variations for Airbnb listings in Santa Ana is key to maximizing your short term rental income potential. Seasonality significantly impacts earnings. Our analysis, based on data from the past 12 months, shows that the peak revenue month for STRs in Santa Ana is typically January, while June often presents the lowest earnings, highlighting opportunities for strategic pricing adjustments during shoulder and low seasons. Explore the typical Airbnb income in Santa Ana across different performance tiers:
- Best-in-class properties (Top 10%) achieve $1,266+ monthly, often utilizing dynamic pricing and superior guest experiences.
- Strong performing properties (Top 25%) earn $791 or more, indicating effective management and desirable locations/amenities.
- Typical properties (Median) generate around $478 per month, representing the average market performance.
- Entry-level properties (Bottom 25%) see earnings around $252, often with potential for optimization.
Average Monthly Airbnb Earnings Trend in Santa Ana
Santa Ana Airbnb Occupancy Rate Trends (2025)
Maximize your bookings by understanding the Santa Ana STR occupancy trends. Seasonal demand shifts significantly influence how often properties are booked. Typically, Januarysees the highest demand (peak season occupancy), while June experiences the lowest (low season). Effective strategies, like adjusting minimum stays or offering promotions, can boost occupancy during slower periods. Here's how different property tiers perform in Santa Ana:
- Best-in-class properties (Top 10%) achieve 59%+ occupancy, indicating high desirability and potentially optimized availability.
- Strong performing properties (Top 25%) maintain 41% or higher occupancy, suggesting good market fit and guest satisfaction.
- Typical properties (Median) have an occupancy rate around 25%.
- Entry-level properties (Bottom 25%) average 13% occupancy, potentially facing higher vacancy.
Average Monthly Occupancy Rate Trend in Santa Ana
Average Daily Rate (ADR) Airbnb Trends in Santa Ana (2025)
Effective short term rental pricing strategy in Santa Ana involves understanding monthly ADR fluctuations. The Average Daily Rate (ADR) for Airbnb in Santa Ana typically peaks in February and dips lowest during October. Leveraging Airbnb dynamic pricing tools or strategies based on this seasonality can significantly boost revenue. Here's a look at the typical nightly rates achieved:
- Best-in-class properties (Top 10%) command rates of $103+ per night, often due to premium features or locations.
- Strong performing properties (Top 25%) achieve nightly rates of $79 or more.
- Typical properties (Median) charge around $59 per night.
- Entry-level properties (Bottom 25%) earn around $48 per night.
Average Daily Rate (ADR) Trend by Month in Santa Ana
Get Live Santa Ana Market Intelligence 👇

Explore Real-time Analytics
Airbnb Seasonality Analysis & Trends in Santa Ana (2025)
Peak Season (January, February, December)
- Revenue averages $1,068 per month
- Occupancy rates average 50.0%
- Daily rates average $71
Shoulder Season
- Revenue averages $485 per month
- Occupancy maintains around 24.4%
- Daily rates hold near $67
Low Season (June, August, October)
- Revenue drops to average $345 per month
- Occupancy decreases to average 19.8%
- Daily rates adjust to average $63
Seasonality Insights for Santa Ana
- The Airbnb seasonality in Santa Ana shows highly seasonal trends requiring careful strategy. While the sections above show seasonal averages, it's also insightful to look at the extremes:
- During the high season, the absolute peak month showcases Santa Ana's highest earning potential, with monthly revenues capable of climbing to $1,469, occupancy reaching a high of 64.7%, and ADRs peaking at $75.
- Conversely, the slowest single month of the year, typically falling within the low season, marks the market's lowest point. In this month, revenue might dip to $249, occupancy could drop to 14.8%, and ADRs may adjust down to $63.
- Understanding both the seasonal averages and these monthly peaks and troughs in revenue, occupancy, and ADR is crucial for maximizing your Airbnb profit potential in Santa Ana.
Seasonal Strategies for Maximizing Profit
- Peak Season: Maximize revenue through premium pricing and potentially longer minimum stays. Ensure high availability.
- Low Season: Offer competitive pricing, special promotions (e.g., extended stay discounts), and flexible cancellation policies. Target off-season travelers like remote workers or budget-conscious guests.
- Shoulder Seasons: Implement dynamic pricing that balances peak and low rates. Target weekend travelers or specific events. Offer slightly more flexible terms than peak season.
- Regularly analyze your own performance against these Santa Ana seasonality benchmarks and adjust your pricing and availability strategy accordingly.
Best Areas for Airbnb Investment in Santa Ana (2025)
Exploring the top neighborhoods for short-term rentals in Santa Ana? This section highlights key areas, outlining why they are attractive for hosts and guests, along with notable local attractions. Consider these locations based on your target guest profile and investment strategy.
| Neighborhood / Area | Why Host Here? (Target Guests & Appeal) | Key Attractions & Landmarks |
|---|---|---|
| Centro | The heart of Santa Ana, known for its vibrant culture, historical architecture, and accessibility to various amenities. It's a popular choice for both locals and tourists looking to explore the city's rich heritage. | Museo del Carnaval, Plaza de los Leones, Mercado Municipal, Teatro El Galpón, Parque Rodó |
| Barrio Histórico | This area is famous for its colonial architecture and picturesque streets. It's a UNESCO World Heritage site attracting history enthusiasts and tourists alike. | Casa de la Cultura, Plaza de la Independencia, Iglesia de San Francisco, Museo de la Historia del Arte, Puente de Piedra |
| Punta del Este | Not far from Santa Ana, this beach resort town is known for its stunning beaches and nightlife. Ideal for vacation rentals catering to beachgoers and party-seekers. | La Mano de Punta del Este, Casapueblo, Playa Brava, Playa Mansa, Puerto de Punta del Este |
| La Barra | A trendy area near Punta del Este, known for its vibrant nightlife and artsy vibe. Popular among younger tourists and hipsters. | La Barra's unique bridges, Beach clubs, Art galleries, Local markets, Nightclubs |
| José Ignacio | An exclusive and serene beach destination, attracting visitors looking for luxury and relaxation away from the hustle of Punta del Este. | Playa José Ignacio, Laguna José Ignacio, Local seafood restaurants, Art galleries, Ranchos de Playa |
| El Pinar | A tranquil neighborhood near the coast, popular for families and those seeking a peaceful beach retreat. Great for longer-term Airbnb rentals. | Playa El Pinar, Local parks, Nature trails, Quiet community atmosphere |
| Carrasco | An upscale residential area known for its elegant homes and proximity to Carrasco International Airport. Appeals to business travelers. | Carrasco Beach, Carrasco Shopping, Art Deco architecture, Nature walks at Parque de la Pascuas |
| Canelones | A growing area with vineyards and natural beauty, attracting visitors interested in wine tourism and rural escapes. | Wine tours and tastings, Parque del Lago, Local farms, Nature reserves |
Understanding Airbnb License Requirements & STR Laws in Santa Ana (2025)
While Santa Ana, Colonia, Uruguay currently shows low STR regulations, specific Airbnb license requirements might still exist or change. Always verify the latest short term rental regulations and Airbnb license requirements directly with local government authorities for Santa Ana to ensure full compliance before hosting.
(Source: AirROI data, 2025, based on 5% licensed listings)
Top Performing Airbnb Properties in Santa Ana (2025)
Benchmark your potential! Explore examples of top-performing Airbnb properties in Santa Anabased on Trailing Twelve Month (TTM) revenue. Analyze their characteristics, revenue, occupancy rate, and ADR to understand what drives success in this market.
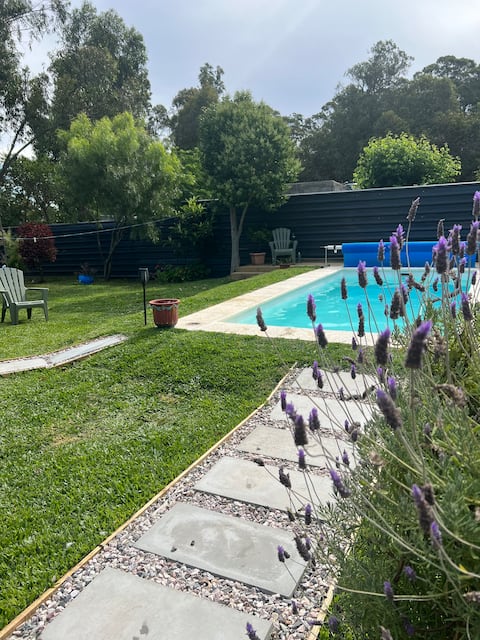
Beautiful house with heated pool
Entire Place • 2 bedrooms

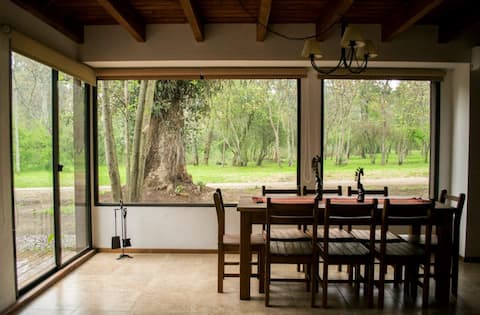
Comfortable house with forest and beach
Entire Place • 3 bedrooms

Casita in the forest and beach in Balneario Argentino
Entire Place • N/A

House in forest of eucalyptus
Entire Place • 1 bedroom

SUKHA cabin!!! surrounded by nature !!
Entire Place • 2 bedrooms
Cabin 3 ambients - Balneario El Ensueño
Entire Place • 2 bedrooms
Note: Performance varies based on location, size, amenities, seasonality, and management quality. Data reflects the past 12 months.
Top Performing Airbnb Hosts in Santa Ana (2025)
Learn from the best! This table showcases top-performing Airbnb hosts in Santa Ana based on the number of properties managed and estimated total revenue over the past year. Analyze their scale and performance metrics.
| Host Name | Properties | Grossing Revenue | Stay Reviews | Avg Rating |
|---|---|---|---|---|
| Lucas | 4 | $30,411 | 11 | 5.00/5.0 |
| Cecilia | 1 | $21,252 | 3 | 5.00/5.0 |
| Cascor | 1 | $19,384 | 372 | 4.87/5.0 |
| Lau | 1 | $15,348 | 73 | 4.93/5.0 |
| Soledad | 1 | $11,449 | 11 | 5.00/5.0 |
| Claudia | 1 | $10,623 | 54 | 4.89/5.0 |
| Andrés | 2 | $9,648 | 40 | 4.87/5.0 |
| Paula Beatriz | 1 | $9,240 | 2 | N/A/5.0 |
| Eliana | 1 | $8,777 | 36 | 4.94/5.0 |
| Ana Claudia | 1 | $8,676 | 48 | 4.94/5.0 |
Analyzing the strategies of top hosts, such as their property selection, pricing, and guest communication, can offer valuable lessons for optimizing your own Airbnb operations in Santa Ana.
Dive Deeper: Advanced Santa Ana STR Market Data (2025)
Ready to unlock more insights? AirROI provides access to advanced metrics and comprehensive Airbnb data for Santa Ana. Explore detailed analytics beyond this report to refine your investment strategy, optimize pricing, and maximize your vacation rental profits.
Explore Advanced MetricsSanta Ana Short-Term Rental Market Composition (2025): Property & Room Types
Room Type Distribution
Property Type Distribution
Market Composition Insights for Santa Ana
- The Santa Ana Airbnb market composition is heavily skewed towards Entire Home/Apt listings, which make up 96.9% of the 96 active rentals. This indicates strong guest preference for privacy and space.
- Looking at the property type distribution in Santa Ana, House properties are the most common (68.8%), reflecting the local real estate landscape.
- Houses represent a significant 68.8% portion, catering likely to families or larger groups.
- Smaller segments like apartment/condo (combined 4.2%) offer potential for unique stay experiences.
Santa Ana Airbnb Room Capacity Analysis (2025): Bedroom Distribution
Distribution of Listings by Number of Bedrooms
Room Capacity Insights for Santa Ana
- The dominant room capacity in Santa Ana is 2 bedrooms listings, making up 44.8% of the market. This suggests a strong demand for properties suitable for couples or solo travelers.
- Together, 2 bedrooms and 1 bedroom properties represent 86.5% of the active Airbnb listings in Santa Ana, indicating a high concentration in these sizes.
- Listings with 3+ bedrooms (7.3%) represent a smaller niche, potentially indicating an underserved market for larger group accommodations in Santa Ana.
Santa Ana Vacation Rental Guest Capacity Trends (2025)
Distribution of Listings by Guest Capacity
Guest Capacity Insights for Santa Ana
- The most common guest capacity trend in Santa Ana vacation rentals is listings accommodating 4 guests (34.4%). This suggests the primary traveler segment is likely small families or groups.
- Properties designed for 4 guests and 2 guests dominate the Santa Ana STR market, accounting for 50.0% of listings.
- 21.9% of properties accommodate 6+ guests, serving the market segment for larger families or group travel in Santa Ana.
- On average, properties in Santa Ana are equipped to host 4.2 guests.
Santa Ana Airbnb Booking Patterns (2025): Available vs. Booked Days
Available Days Distribution
Booked Days Distribution
Booking Pattern Insights for Santa Ana
- The most common availability pattern in Santa Ana falls within the 271-366 days range, representing 75% of listings. This suggests many properties have significant open periods on their calendars.
- Approximately 95.8% of listings show high availability (181+ days open annually), indicating potential for increased bookings or specific owner usage patterns.
- For booked days, the 31-90 days range is most frequent in Santa Ana (46.9%), reflecting common guest stay durations or potential owner blocking patterns.
- A notable 4.1% of properties secure long booking periods (181+ days booked per year), highlighting successful long-term rental strategies or significant owner usage.
Santa Ana Airbnb Minimum Stay Requirements Analysis
Distribution of Listings by Minimum Night Requirement
1 Night
23 listings
24.2% of total
2 Nights
28 listings
29.5% of total
3 Nights
10 listings
10.5% of total
4-6 Nights
13 listings
13.7% of total
7-29 Nights
2 listings
2.1% of total
30+ Nights
19 listings
20% of total
Key Insights
- The most prevalent minimum stay requirement in Santa Ana is 2 Nights, adopted by 29.5% of listings. This highlights the market's preference for shorter, flexible bookings.
- A significant segment (20%) caters to monthly stays (30+ nights) in Santa Ana, pointing to opportunities in the extended-stay market.
Recommendations
- Align with the market by considering a 2 Nights minimum stay, as 29.5% of Santa Ana hosts use this setting.
- If feasible, allowing 1-night stays, especially midweek or during low season, could capture last-minute bookings, as only 24.2% currently do.
- Explore offering discounts for stays of 30+ nights to attract the 20% of the market seeking extended stays.
- Adjust minimum nights based on seasonality – potentially shorter during low season and longer during peak demand periods in Santa Ana.
Santa Ana Airbnb Cancellation Policy Trends Analysis (2025)
Flexible
37 listings
44% of total
Moderate
17 listings
20.2% of total
Firm
11 listings
13.1% of total
Strict
19 listings
22.6% of total
Cancellation Policy Insights for Santa Ana
- The prevailing Airbnb cancellation policy trend in Santa Ana is Flexible, used by 44% of listings.
- There's a relatively balanced mix between guest-friendly (64.2%) and stricter (35.7%) policies, offering choices for different guest needs.
Recommendations for Hosts
- Consider adopting a Flexible policy to align with the 44% market standard in Santa Ana.
- Regularly review your cancellation policy against competitors and market demand shifts in Santa Ana.
Santa Ana STR Booking Lead Time Analysis (2025)
Average Booking Lead Time by Month
Booking Lead Time Insights for Santa Ana
- The overall average booking lead time for vacation rentals in Santa Ana is 29 days.
- Guests book furthest in advance for stays during January (average 53 days), likely coinciding with peak travel demand or local events.
- The shortest booking windows occur for stays in June (average 10 days), indicating more last-minute travel plans during this time.
- Seasonally, Winter (42 days avg.) sees the longest lead times, while Summer (14 days avg.) has the shortest, reflecting typical travel planning cycles.
Recommendations for Hosts
- Use the overall average lead time (29 days) as a baseline for your pricing and availability strategy in Santa Ana.
- For January stays, consider implementing length-of-stay discounts or slightly higher rates for bookings made less than 53 days out to capitalize on advance planning.
- During June, focus on last-minute booking availability and promotions, as guests book with very short notice (10 days avg.).
- Target marketing efforts for the Winter season well in advance (at least 42 days) to capture early planners.
- Monitor your own booking lead times against these Santa Ana averages to identify opportunities for dynamic pricing adjustments.
Popular & Essential Airbnb Amenities in Santa Ana (2025)
Amenity Prevalence
Amenity Insights for Santa Ana
- Essential amenities in Santa Ana that guests expect include: Kitchen. Lacking these (this) could significantly impact bookings.
- Popular amenities like Free parking on premises, Hot water, BBQ grill are common but not universal. Offering these can provide a competitive edge.
- Warning: Wifi is not universally provided but is considered essential globally. Ensure reliable Wifi is offered.
Recommendations for Hosts
- Ensure your listing includes all essential amenities for Santa Ana: Kitchen.
- Prioritize adding missing essentials: Kitchen.
- Consider adding popular differentiators like Free parking on premises or Hot water to increase appeal.
- Highlight unique or less common amenities you offer (e.g., hot tub, dedicated workspace, EV charger) in your listing description and photos.
- Regularly check competitor amenities in Santa Ana to stay competitive.
Santa Ana Airbnb Guest Demographics & Profile Analysis (2025)
Guest Profile Summary for Santa Ana
- The typical guest profile for Airbnb in Santa Ana consists of primarily domestic travelers (76%), often arriving from nearby Montevideo, typically belonging to the Post-2000s (Gen Z/Alpha) group (50%), primarily speaking Spanish or English.
- Domestic travelers account for 76.1% of guests.
- Key international markets include Uruguay (76.1%) and Argentina (13.3%).
- Top languages spoken are Spanish (47%) followed by English (33.6%).
- A significant demographic segment is the Post-2000s (Gen Z/Alpha) group, representing 50% of guests.
Recommendations for Hosts
- Target domestic marketing efforts towards travelers from Montevideo and Buenos Aires.
- Tailor amenities and listing descriptions to appeal to the dominant Post-2000s (Gen Z/Alpha) demographic (e.g., highlight fast WiFi, smart home features, local guides).
- Highlight unique local experiences or amenities relevant to the primary guest profile.
- Consider seasonal promotions aligned with peak travel times for key origin markets.
Nearby Short-Term Rental Market Comparison
How does the Santa Ana Airbnb market stack up against its neighbors? Compare key performance metrics like average monthly revenue, ADR, and occupancy rates in surrounding areas to understand the broader regional STR landscape.
| Market | Active Properties | Monthly Revenue | Daily Rate | Avg. Occupancy |
|---|---|---|---|---|
| Departamento de Maldonado | 14 | $1,785 | $214.44 | 25% |
| Fortín de Santa Rosa | 12 | $1,562 | $224.49 | 29% |
| Punta Ballena | 505 | $1,336 | $204.54 | 33% |
| Pan de Azúcar | 19 | $1,332 | $231.21 | 22% |
| Departamento de Lavalleja | 12 | $1,313 | $106.57 | 42% |
| El Edén | 29 | $1,025 | $216.17 | 23% |
| Minas | 36 | $937 | $103.10 | 35% |
| Balneario Santa Ana | 12 | $925 | $143.59 | 34% |
| Punta Colorada | 151 | $823 | $122.00 | 34% |
| Chihuahua | 48 | $815 | $167.24 | 33% |