Ansted Airbnb Market Analysis 2025: Short Term Rental Data & Vacation Rental Statistics in West Virginia, United States
Is Airbnb profitable in Ansted in 2025? Explore comprehensive Airbnb analytics for Ansted, West Virginia, United States to uncover income potential. This 2025 STR market report for Ansted, based on AirROI data from April 2024 to March 2025, reveals key trends in the niche market of 17 active listings.
Whether you're considering an Airbnb investment in Ansted, optimizing your existing vacation rental, or exploring rental arbitrage opportunities, understanding the Ansted Airbnb data is crucial. Leveraging the low regulation environment is key to maximizing your short term rental income potential. Let's dive into the specifics.
Key Ansted Airbnb Performance Metrics Overview
Monthly Airbnb Revenue Variations & Income Potential in Ansted (2025)
Understanding the monthly revenue variations for Airbnb listings in Ansted is key to maximizing your short term rental income potential. Seasonality significantly impacts earnings. Our analysis, based on data from the past 12 months, shows that the peak revenue month for STRs in Ansted is typically June, while March often presents the lowest earnings, highlighting opportunities for strategic pricing adjustments during shoulder and low seasons. Explore the typical Airbnb income in Ansted across different performance tiers:
- Best-in-class properties (Top 10%) achieve $5,069+ monthly, often utilizing dynamic pricing and superior guest experiences.
- Strong performing properties (Top 25%) earn $2,376 or more, indicating effective management and desirable locations/amenities.
- Typical properties (Median) generate around $1,645 per month, representing the average market performance.
- Entry-level properties (Bottom 25%) see earnings around $1,212, often with potential for optimization.
Average Monthly Airbnb Earnings Trend in Ansted
Ansted Airbnb Occupancy Rate Trends (2025)
Maximize your bookings by understanding the Ansted STR occupancy trends. Seasonal demand shifts significantly influence how often properties are booked. Typically, Julysees the highest demand (peak season occupancy), while February experiences the lowest (low season). Effective strategies, like adjusting minimum stays or offering promotions, can boost occupancy during slower periods. Here's how different property tiers perform in Ansted:
- Best-in-class properties (Top 10%) achieve 59%+ occupancy, indicating high desirability and potentially optimized availability.
- Strong performing properties (Top 25%) maintain 45% or higher occupancy, suggesting good market fit and guest satisfaction.
- Typical properties (Median) have an occupancy rate around 36%.
- Entry-level properties (Bottom 25%) average 21% occupancy, potentially facing higher vacancy.
Average Monthly Occupancy Rate Trend in Ansted
Average Daily Rate (ADR) Airbnb Trends in Ansted (2025)
Effective short term rental pricing strategy in Ansted involves understanding monthly ADR fluctuations. The Average Daily Rate (ADR) for Airbnb in Ansted typically peaks in January and dips lowest during April. Leveraging Airbnb dynamic pricing tools or strategies based on this seasonality can significantly boost revenue. Here's a look at the typical nightly rates achieved:
- Best-in-class properties (Top 10%) command rates of $312+ per night, often due to premium features or locations.
- Strong performing properties (Top 25%) achieve nightly rates of $196 or more.
- Typical properties (Median) charge around $131 per night.
- Entry-level properties (Bottom 25%) earn around $100 per night.
Average Daily Rate (ADR) Trend by Month in Ansted
Get Live Ansted Market Intelligence 👇

Explore Real-time Analytics
Airbnb Seasonality Analysis & Trends in Ansted (2025)
Peak Season (June, July, April)
- Revenue averages $3,538 per month
- Occupancy rates average 48.2%
- Daily rates average $155
Shoulder Season
- Revenue averages $2,061 per month
- Occupancy maintains around 36.9%
- Daily rates hold near $162
Low Season (January, March, December)
- Revenue drops to average $951 per month
- Occupancy decreases to average 19.8%
- Daily rates adjust to average $178
Seasonality Insights for Ansted
- The Airbnb seasonality in Ansted shows highly seasonal trends requiring careful strategy. While the sections above show seasonal averages, it's also insightful to look at the extremes:
- During the high season, the absolute peak month showcases Ansted's highest earning potential, with monthly revenues capable of climbing to $4,128, occupancy reaching a high of 60.1%, and ADRs peaking at $180.
- Conversely, the slowest single month of the year, typically falling within the low season, marks the market's lowest point. In this month, revenue might dip to $814, occupancy could drop to 12.5%, and ADRs may adjust down to $153.
- Understanding both the seasonal averages and these monthly peaks and troughs in revenue, occupancy, and ADR is crucial for maximizing your Airbnb profit potential in Ansted.
Seasonal Strategies for Maximizing Profit
- Peak Season: Maximize revenue through premium pricing and potentially longer minimum stays. Ensure high availability.
- Low Season: Offer competitive pricing, special promotions (e.g., extended stay discounts), and flexible cancellation policies. Target off-season travelers like remote workers or budget-conscious guests.
- Shoulder Seasons: Implement dynamic pricing that balances peak and low rates. Target weekend travelers or specific events. Offer slightly more flexible terms than peak season.
- Regularly analyze your own performance against these Ansted seasonality benchmarks and adjust your pricing and availability strategy accordingly.
Best Areas for Airbnb Investment in Ansted (2025)
Exploring the top neighborhoods for short-term rentals in Ansted? This section highlights key areas, outlining why they are attractive for hosts and guests, along with notable local attractions. Consider these locations based on your target guest profile and investment strategy.
| Neighborhood / Area | Why Host Here? (Target Guests & Appeal) | Key Attractions & Landmarks |
|---|---|---|
| New River Gorge | A stunning natural area ideal for outdoor enthusiasts, popular for rock climbing, white-water rafting, and hiking. Draws visitors looking for adventure and scenic beauty. | New River Gorge Bridge, Hawks Nest State Park, Summersville Lake, Sandstone Falls, Endless Wall Trail |
| Ansted Historic District | Known for its charming architecture and history, offers a quaint small-town atmosphere. Visitors enjoy the local shops, eateries, and historical sites. | Ansted Depot, Hawks Nest Hotel, New River Gorge National Park, Local antique shops, Ansted Baptist Church |
| Bluestone Lake | A picturesque lake area popular for water activities, fishing, and family gatherings. Great for renting cabins and fostering a laid-back vacation experience. | Bluestone Lake State Park, Fishing spots, Picnic areas, Hiking trails, Boating activities |
| Fayetteville | A vibrant small town located near the New River Gorge, known for its bustling arts scene and community events. It's a hotspot for outdoor recreation and festivals. | Fayetteville Town Park, The Fayette Theatre, Canyon Rim Visitor Center, Hiking and biking trails, Local art galleries |
| Summersville | Known as the 'Gateway to the Gauley', this town offers easy access to several natural attractions and has a range of dining and shopping options, making it a great base for visitors. | Summersville Lake, Gauley River, Shopping District, Local restaurants, Festival events |
| Greenbrier Valley | Rich in history and natural beauty, this area is popular for its charming towns and outdoor activities, appealing to both relaxation seekers and adventure lovers. | Greenbrier River, Historic Lewisburg, The Greenbrier Resort, Local wineries, Hiking trails |
| Canaan Valley | Another outdoor lover's paradise, this area is famous for its stunning landscapes and winter sports. Attracts guests year-round for its natural beauty and recreational opportunities. | Canaan Valley Resort, Blackwater Falls, Cross-country skiing, Hiking trails, Biking paths |
| Snowshoe Mountain | A popular ski resort area that draws visitors in winter for skiing, snowboarding, and summer for mountain biking. Offers a range of accommodations and amenities. | Ski slopes, Mountain biking trails, Snowshoe Village, Spa and wellness centers, Scenic views |
Understanding Airbnb License Requirements & STR Laws in Ansted (2025)
While Ansted, West Virginia, United States currently shows low STR regulations, specific Airbnb license requirements might still exist or change. Always verify the latest short term rental regulations and Airbnb license requirements directly with local government authorities for Ansted to ensure full compliance before hosting.
(Source: AirROI data, 2025, finding no licensed listings among those analyzed)
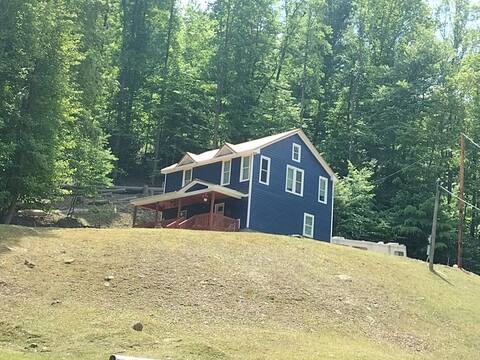
Top Performing Airbnb Properties in Ansted (2025)
Benchmark your potential! Explore examples of top-performing Airbnb properties in Anstedbased on Trailing Twelve Month (TTM) revenue. Analyze their characteristics, revenue, occupancy rate, and ADR to understand what drives success in this market.

Off grid getaway! Cabin near the Gorge. Bring ATV!
Entire Place • 3 bedrooms
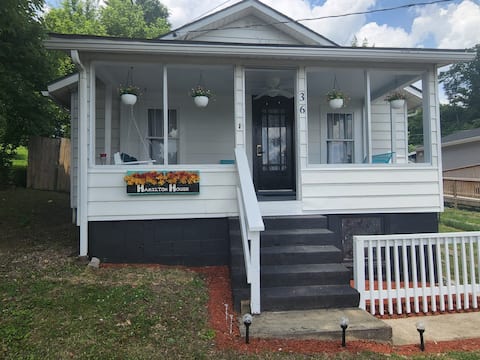
Hamilton House
Entire Place • 2 bedrooms

The Oak Oasis - Gorgeous views and a hot tub
Entire Place • 1 bedroom
nice view
Entire Place • 4 bedrooms

Creek House
Entire Place • 2 bedrooms

Homestead Estate- New Listing!
Entire Place • 4 bedrooms
Note: Performance varies based on location, size, amenities, seasonality, and management quality. Data reflects the past 12 months.
Top Performing Airbnb Hosts in Ansted (2025)
Learn from the best! This table showcases top-performing Airbnb hosts in Ansted based on the number of properties managed and estimated total revenue over the past year. Analyze their scale and performance metrics.
| Host Name | Properties | Grossing Revenue | Stay Reviews | Avg Rating |
|---|---|---|---|---|
| Tommy And Krista | 1 | $59,669 | 18 | 5.00/5.0 |
| Ethan | 2 | $53,341 | 164 | 4.86/5.0 |
| Cathy | 2 | $43,515 | 79 | 4.97/5.0 |
| Amber | 3 | $38,354 | 264 | 4.88/5.0 |
| Renee | 1 | $29,609 | 122 | 4.91/5.0 |
| Kimberly | 1 | $27,617 | 4 | 4.75/5.0 |
| Abigail | 1 | $25,735 | 9 | 4.89/5.0 |
| Suzy | 1 | $22,451 | 291 | 4.89/5.0 |
| Ron | 1 | $21,162 | 81 | 4.98/5.0 |
| Kim | 1 | $18,576 | 20 | 5.00/5.0 |
Analyzing the strategies of top hosts, such as their property selection, pricing, and guest communication, can offer valuable lessons for optimizing your own Airbnb operations in Ansted.
Dive Deeper: Advanced Ansted STR Market Data (2025)
Ready to unlock more insights? AirROI provides access to advanced metrics and comprehensive Airbnb data for Ansted. Explore detailed analytics beyond this report to refine your investment strategy, optimize pricing, and maximize your vacation rental profits.
Explore Advanced MetricsAnsted Short-Term Rental Market Composition (2025): Property & Room Types
Room Type Distribution
Property Type Distribution
Market Composition Insights for Ansted
- The Ansted Airbnb market composition is heavily skewed towards Entire Home/Apt listings, which make up 88.2% of the 17 active rentals. This indicates strong guest preference for privacy and space.
- Looking at the property type distribution in Ansted, House properties are the most common (58.8%), reflecting the local real estate landscape.
- Houses represent a significant 58.8% portion, catering likely to families or larger groups.
Ansted Airbnb Room Capacity Analysis (2025): Bedroom Distribution
Distribution of Listings by Number of Bedrooms
Room Capacity Insights for Ansted
- The dominant room capacity in Ansted is 2 bedrooms listings, making up 35.3% of the market. This suggests a strong demand for properties suitable for couples or solo travelers.
- Together, 2 bedrooms and 1 bedroom properties represent 58.8% of the active Airbnb listings in Ansted, indicating a high concentration in these sizes.
- A significant 29.4% of listings offer 3+ bedrooms, catering to larger groups and families seeking more space in Ansted.
Ansted Vacation Rental Guest Capacity Trends (2025)
Distribution of Listings by Guest Capacity
Guest Capacity Insights for Ansted
- The most common guest capacity trend in Ansted vacation rentals is listings accommodating 4 guests (29.4%). This suggests the primary traveler segment is likely small families or groups.
- Properties designed for 4 guests and 8+ guests dominate the Ansted STR market, accounting for 52.9% of listings.
- 35.3% of properties accommodate 6+ guests, serving the market segment for larger families or group travel in Ansted.
- On average, properties in Ansted are equipped to host 4.8 guests.
Ansted Airbnb Booking Patterns (2025): Available vs. Booked Days
Available Days Distribution
Booked Days Distribution
Booking Pattern Insights for Ansted
- The most common availability pattern in Ansted falls within the 181-270 days range, representing 41.2% of listings. This suggests many properties have significant open periods on their calendars.
- Approximately 76.5% of listings show high availability (181+ days open annually), indicating potential for increased bookings or specific owner usage patterns.
- For booked days, the 91-180 days range is most frequent in Ansted (41.2%), reflecting common guest stay durations or potential owner blocking patterns.
- A notable 29.4% of properties secure long booking periods (181+ days booked per year), highlighting successful long-term rental strategies or significant owner usage.
Ansted Airbnb Minimum Stay Requirements Analysis
Distribution of Listings by Minimum Night Requirement
1 Night
7 listings
41.2% of total
2 Nights
9 listings
52.9% of total
3 Nights
1 listings
5.9% of total
Key Insights
- The most prevalent minimum stay requirement in Ansted is 2 Nights, adopted by 52.9% of listings. This highlights the market's preference for shorter, flexible bookings.
- A strong majority (94.1%) of the Ansted Airbnb data shows acceptance of very short stays (1-2 nights), indicating a dynamic, high-turnover market.
Recommendations
- Align with the market by considering a 2 Nights minimum stay, as 52.9% of Ansted hosts use this setting.
- Adjust minimum nights based on seasonality – potentially shorter during low season and longer during peak demand periods in Ansted.
Ansted Airbnb Cancellation Policy Trends Analysis (2025)
Flexible
7 listings
41.2% of total
Moderate
3 listings
17.6% of total
Firm
3 listings
17.6% of total
Strict
4 listings
23.5% of total
Cancellation Policy Insights for Ansted
- The prevailing Airbnb cancellation policy trend in Ansted is Flexible, used by 41.2% of listings.
- There's a relatively balanced mix between guest-friendly (58.8%) and stricter (41.1%) policies, offering choices for different guest needs.
Recommendations for Hosts
- Consider adopting a Flexible policy to align with the 41.2% market standard in Ansted.
- Regularly review your cancellation policy against competitors and market demand shifts in Ansted.
Ansted STR Booking Lead Time Analysis (2025)
Average Booking Lead Time by Month
Booking Lead Time Insights for Ansted
- The overall average booking lead time for vacation rentals in Ansted is 37 days.
- Guests book furthest in advance for stays during August (average 58 days), likely coinciding with peak travel demand or local events.
- The shortest booking windows occur for stays in March (average 24 days), indicating more last-minute travel plans during this time.
- Seasonally, Summer (53 days avg.) sees the longest lead times, while Winter (31 days avg.) has the shortest, reflecting typical travel planning cycles.
Recommendations for Hosts
- Use the overall average lead time (37 days) as a baseline for your pricing and availability strategy in Ansted.
- For August stays, consider implementing length-of-stay discounts or slightly higher rates for bookings made less than 58 days out to capitalize on advance planning.
- Target marketing efforts for the Summer season well in advance (at least 53 days) to capture early planners.
- Monitor your own booking lead times against these Ansted averages to identify opportunities for dynamic pricing adjustments.
Popular & Essential Airbnb Amenities in Ansted (2025)
Amenity Prevalence
Amenity Insights for Ansted
- Essential amenities in Ansted that guests expect include: Smoke alarm, Air conditioning. Lacking these (any) could significantly impact bookings.
- Popular amenities like Hair dryer, Wifi, Refrigerator are common but not universal. Offering these can provide a competitive edge.
- Warning: Wifi is not universally provided but is considered essential globally. Ensure reliable Wifi is offered.
Recommendations for Hosts
- Ensure your listing includes all essential amenities for Ansted: Smoke alarm, Air conditioning.
- Consider adding popular differentiators like Hair dryer or Wifi to increase appeal.
- Highlight unique or less common amenities you offer (e.g., hot tub, dedicated workspace, EV charger) in your listing description and photos.
- Regularly check competitor amenities in Ansted to stay competitive.
Ansted Airbnb Guest Demographics & Profile Analysis (2025)
Guest Profile Summary for Ansted
- The typical guest profile for Airbnb in Ansted consists of primarily domestic travelers (94%), often arriving from nearby Washington, typically belonging to the Post-2000s (Gen Z/Alpha) group (50%), primarily speaking English or Spanish.
- Domestic travelers account for 93.8% of guests.
- Key international markets include United States (93.8%) and DC (3.6%).
- Top languages spoken are English (79.4%) followed by Spanish (7.2%).
- A significant demographic segment is the Post-2000s (Gen Z/Alpha) group, representing 50% of guests.
Recommendations for Hosts
- Target domestic marketing efforts towards travelers from Washington and Charlotte.
- Tailor amenities and listing descriptions to appeal to the dominant Post-2000s (Gen Z/Alpha) demographic (e.g., highlight fast WiFi, smart home features, local guides).
- Highlight unique local experiences or amenities relevant to the primary guest profile.
- Consider seasonal promotions aligned with peak travel times for key origin markets.
Nearby Short-Term Rental Market Comparison
How does the Ansted Airbnb market stack up against its neighbors? Compare key performance metrics like average monthly revenue, ADR, and occupancy rates in surrounding areas to understand the broader regional STR landscape.
| Market | Active Properties | Monthly Revenue | Daily Rate | Avg. Occupancy |
|---|---|---|---|---|
| Creola | 11 | $6,407 | $395.56 | 56% |
| Rockbridge | 171 | $5,219 | $376.08 | 48% |
| Sugar Grove | 13 | $5,141 | $429.33 | 42% |
| South Bloomingville | 104 | $5,049 | $287.03 | 51% |
| Logan | 592 | $4,882 | $353.20 | 47% |
| Victor | 19 | $4,783 | $435.08 | 37% |
| Swan Township | 89 | $4,488 | $313.93 | 49% |
| Slaty Fork | 37 | $4,450 | $384.61 | 37% |
| New Plymouth | 13 | $4,411 | $524.37 | 29% |
| Laurelville | 120 | $4,344 | $322.30 | 44% |