New Castle Airbnb Market Analysis 2025: Short Term Rental Data & Vacation Rental Statistics in Virginia, United States
Is Airbnb profitable in New Castle in 2025? Explore comprehensive Airbnb analytics for New Castle, Virginia, United States to uncover income potential. This 2025 STR market report for New Castle, based on AirROI data from April 2024 to March 2025, reveals key trends in the niche market of 17 active listings.
Whether you're considering an Airbnb investment in New Castle, optimizing your existing vacation rental, or exploring rental arbitrage opportunities, understanding the New Castle Airbnb data is crucial. Leveraging the low regulation environment is key to maximizing your short term rental income potential. Let's dive into the specifics.
Key New Castle Airbnb Performance Metrics Overview
Monthly Airbnb Revenue Variations & Income Potential in New Castle (2025)
Understanding the monthly revenue variations for Airbnb listings in New Castle is key to maximizing your short term rental income potential. Seasonality significantly impacts earnings. Our analysis, based on data from the past 12 months, shows that the peak revenue month for STRs in New Castle is typically July, while March often presents the lowest earnings, highlighting opportunities for strategic pricing adjustments during shoulder and low seasons. Explore the typical Airbnb income in New Castle across different performance tiers:
- Best-in-class properties (Top 10%) achieve $5,599+ monthly, often utilizing dynamic pricing and superior guest experiences.
- Strong performing properties (Top 25%) earn $3,311 or more, indicating effective management and desirable locations/amenities.
- Typical properties (Median) generate around $1,909 per month, representing the average market performance.
- Entry-level properties (Bottom 25%) see earnings around $1,242, often with potential for optimization.
Average Monthly Airbnb Earnings Trend in New Castle
New Castle Airbnb Occupancy Rate Trends (2025)
Maximize your bookings by understanding the New Castle STR occupancy trends. Seasonal demand shifts significantly influence how often properties are booked. Typically, Octobersees the highest demand (peak season occupancy), while March experiences the lowest (low season). Effective strategies, like adjusting minimum stays or offering promotions, can boost occupancy during slower periods. Here's how different property tiers perform in New Castle:
- Best-in-class properties (Top 10%) achieve 72%+ occupancy, indicating high desirability and potentially optimized availability.
- Strong performing properties (Top 25%) maintain 61% or higher occupancy, suggesting good market fit and guest satisfaction.
- Typical properties (Median) have an occupancy rate around 42%.
- Entry-level properties (Bottom 25%) average 23% occupancy, potentially facing higher vacancy.
Average Monthly Occupancy Rate Trend in New Castle
Average Daily Rate (ADR) Airbnb Trends in New Castle (2025)
Effective short term rental pricing strategy in New Castle involves understanding monthly ADR fluctuations. The Average Daily Rate (ADR) for Airbnb in New Castle typically peaks in October and dips lowest during March. Leveraging Airbnb dynamic pricing tools or strategies based on this seasonality can significantly boost revenue. Here's a look at the typical nightly rates achieved:
- Best-in-class properties (Top 10%) command rates of $616+ per night, often due to premium features or locations.
- Strong performing properties (Top 25%) achieve nightly rates of $234 or more.
- Typical properties (Median) charge around $154 per night.
- Entry-level properties (Bottom 25%) earn around $101 per night.
Average Daily Rate (ADR) Trend by Month in New Castle
Get Live New Castle Market Intelligence 👇

Explore Real-time Analytics
Airbnb Seasonality Analysis & Trends in New Castle (2025)
Peak Season (July, October, December)
- Revenue averages $3,407 per month
- Occupancy rates average 52.1%
- Daily rates average $244
Shoulder Season
- Revenue averages $2,931 per month
- Occupancy maintains around 44.9%
- Daily rates hold near $243
Low Season (February, March, April)
- Revenue drops to average $1,596 per month
- Occupancy decreases to average 29.5%
- Daily rates adjust to average $226
Seasonality Insights for New Castle
- The Airbnb seasonality in New Castle shows highly seasonal trends requiring careful strategy. While the sections above show seasonal averages, it's also insightful to look at the extremes:
- During the high season, the absolute peak month showcases New Castle's highest earning potential, with monthly revenues capable of climbing to $3,530, occupancy reaching a high of 56.3%, and ADRs peaking at $257.
- Conversely, the slowest single month of the year, typically falling within the low season, marks the market's lowest point. In this month, revenue might dip to $1,334, occupancy could drop to 25.0%, and ADRs may adjust down to $214.
- Understanding both the seasonal averages and these monthly peaks and troughs in revenue, occupancy, and ADR is crucial for maximizing your Airbnb profit potential in New Castle.
Seasonal Strategies for Maximizing Profit
- Peak Season: Maximize revenue through premium pricing and potentially longer minimum stays. Ensure high availability.
- Low Season: Offer competitive pricing, special promotions (e.g., extended stay discounts), and flexible cancellation policies. Target off-season travelers like remote workers or budget-conscious guests.
- Shoulder Seasons: Implement dynamic pricing that balances peak and low rates. Target weekend travelers or specific events. Offer slightly more flexible terms than peak season.
- Regularly analyze your own performance against these New Castle seasonality benchmarks and adjust your pricing and availability strategy accordingly.
Best Areas for Airbnb Investment in New Castle (2025)
Exploring the top neighborhoods for short-term rentals in New Castle? This section highlights key areas, outlining why they are attractive for hosts and guests, along with notable local attractions. Consider these locations based on your target guest profile and investment strategy.
| Neighborhood / Area | Why Host Here? (Target Guests & Appeal) | Key Attractions & Landmarks |
|---|---|---|
| Historic Downtown | Charming area with well-preserved architecture and rich history. Attracts tourists interested in culture and heritage with its local shops, restaurants, and historic landmarks. | New Castle Courthouse, Virginia's Historic Garden Week, Local artisan shops, Historic walking tours, New Castle Mercantile |
| Lakeview | Scenic area by the lakes offering outdoor activities and beautiful views. Popular among nature lovers and families looking for a peaceful getaway. | Lake Moore, Fishing and boating opportunities, Picnic spots, Hiking trails, Wildlife watching |
| Smith Mountain Lake | A popular vacation destination with access to water sports and lake activities. Attracts tourists looking for a relaxing retreat or adventure with family and friends. | Beaches, Boat rentals, Fishing access, Hiking trails around the lake, Local restaurants and bars |
| Appomattox River Trail | Great area for outdoor recreation, walking, and cycling. Appeals to those interested in fitness and enjoying nature while being close to town amenities. | Hiking and biking trails, Picnic areas, Scenic views, Wildlife photography, Local community events |
| Carvins Cove Natural Reserve | An outdoor paradise with hiking, mountain biking, and fishing. Attracts adventure seekers and those looking to relax in nature. | Carvins Cove Reservoir, Hiking trails, Fishing areas, Mountain biking paths, Scenic overlooks |
| Local Vineyards | The region is known for its wineries and vineyards, appealing to wine lovers and tourists seeking unique tasting experiences. | Tasting rooms, Wine tours, Picnic areas in vineyards, Local wine festivals, Farm-to-table dining options |
| Salem | A nearby city offering shopping and entertainment options. Convenient for guests looking for amenities while still enjoying New Castle's charm. | Salem Red Sox games, Shopping centers, Salem's Historical District, Dining options, Local parks |
| Catawba Valley | Known for its beautiful landscapes and outdoor activities, this area attracts those wanting to explore the great outdoors while staying near New Castle. | Hiking trails, Camping spots, Scenic drives, Wildflower viewing spots, Nature photography |
Understanding Airbnb License Requirements & STR Laws in New Castle (2025)
While New Castle, Virginia, United States currently shows low STR regulations, specific Airbnb license requirements might still exist or change. Always verify the latest short term rental regulations and Airbnb license requirements directly with local government authorities for New Castle to ensure full compliance before hosting.
(Source: AirROI data, 2025, finding no licensed listings among those analyzed)
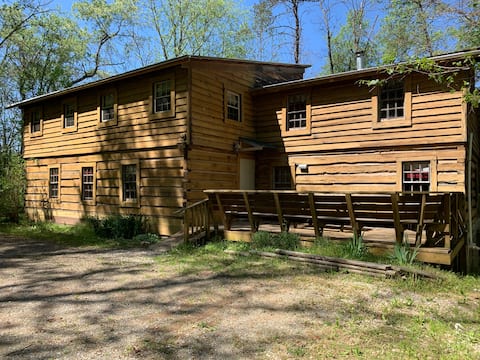
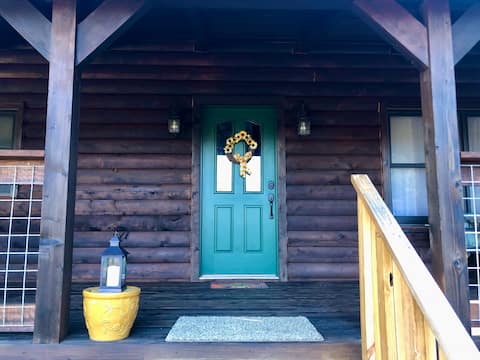
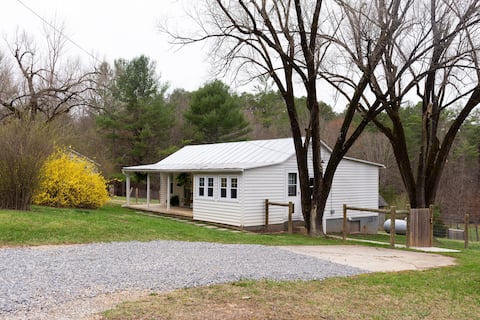
Top Performing Airbnb Properties in New Castle (2025)
Benchmark your potential! Explore examples of top-performing Airbnb properties in New Castlebased on Trailing Twelve Month (TTM) revenue. Analyze their characteristics, revenue, occupancy rate, and ADR to understand what drives success in this market.

Boxwood Falls
Entire Place • 5 bedrooms
Sly Lodge - an adventure retreat
Entire Place • 11 bedrooms
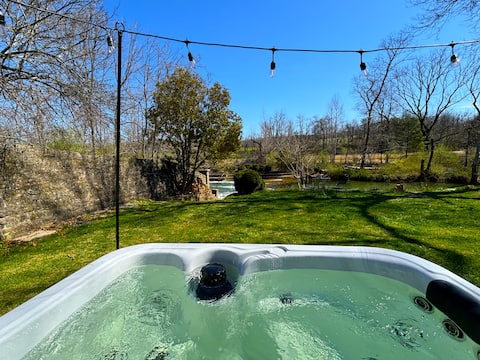
Waterfront Cottage Retreat with Hot Tub
Entire Place • 2 bedrooms
Pine Ridge Cabin
Entire Place • 4 bedrooms

3-bedroom Cottage at Man in the Moon Farm Alpacas
Entire Place • 3 bedrooms
Axe throwing, creek, firepit, close to triple C
Entire Place • 2 bedrooms
Note: Performance varies based on location, size, amenities, seasonality, and management quality. Data reflects the past 12 months.
Top Performing Airbnb Hosts in New Castle (2025)
Learn from the best! This table showcases top-performing Airbnb hosts in New Castle based on the number of properties managed and estimated total revenue over the past year. Analyze their scale and performance metrics.
| Host Name | Properties | Grossing Revenue | Stay Reviews | Avg Rating |
|---|---|---|---|---|
| Jason | 2 | $139,782 | 200 | 4.89/5.0 |
| Jamie | 2 | $86,334 | 33 | 4.82/5.0 |
| Ann & Ray | 2 | $43,024 | 232 | 5.00/5.0 |
| Erica | 1 | $39,134 | 86 | 4.98/5.0 |
| Brenda | 1 | $29,879 | 147 | 5.00/5.0 |
| Jessie | 1 | $28,592 | 15 | 4.93/5.0 |
| Jennifer | 1 | $23,743 | 94 | 4.97/5.0 |
| Randall | 1 | $23,328 | 67 | 4.84/5.0 |
| Stacy & Ryan | 1 | $20,429 | 238 | 5.00/5.0 |
| Jim | 2 | $19,771 | 40 | 4.96/5.0 |
Analyzing the strategies of top hosts, such as their property selection, pricing, and guest communication, can offer valuable lessons for optimizing your own Airbnb operations in New Castle.
Dive Deeper: Advanced New Castle STR Market Data (2025)
Ready to unlock more insights? AirROI provides access to advanced metrics and comprehensive Airbnb data for New Castle. Explore detailed analytics beyond this report to refine your investment strategy, optimize pricing, and maximize your vacation rental profits.
Explore Advanced MetricsNew Castle Short-Term Rental Market Composition (2025): Property & Room Types
Room Type Distribution
Property Type Distribution
Market Composition Insights for New Castle
- The New Castle Airbnb market composition is heavily skewed towards Entire Home/Apt listings, which make up 94.1% of the 17 active rentals. This indicates strong guest preference for privacy and space.
- Looking at the property type distribution in New Castle, House properties are the most common (52.9%), reflecting the local real estate landscape.
- Houses represent a significant 52.9% portion, catering likely to families or larger groups.
- The presence of 5.9% Hotel/Boutique listings indicates integration with traditional hospitality.
New Castle Airbnb Room Capacity Analysis (2025): Bedroom Distribution
Distribution of Listings by Number of Bedrooms
Room Capacity Insights for New Castle
- The dominant room capacity in New Castle is 2 bedrooms listings, making up 29.4% of the market. This suggests a strong demand for properties suitable for couples or solo travelers.
- Together, 2 bedrooms and 1 bedroom properties represent 47.0% of the active Airbnb listings in New Castle, indicating a high concentration in these sizes.
- A significant 35.3% of listings offer 3+ bedrooms, catering to larger groups and families seeking more space in New Castle.
New Castle Vacation Rental Guest Capacity Trends (2025)
Distribution of Listings by Guest Capacity
Guest Capacity Insights for New Castle
- The most common guest capacity trend in New Castle vacation rentals is listings accommodating 4 guests (29.4%). This suggests the primary traveler segment is likely small families or groups.
- Properties designed for 4 guests and 8+ guests dominate the New Castle STR market, accounting for 52.9% of listings.
- 41.2% of properties accommodate 6+ guests, serving the market segment for larger families or group travel in New Castle.
- On average, properties in New Castle are equipped to host 5.1 guests.
New Castle Airbnb Booking Patterns (2025): Available vs. Booked Days
Available Days Distribution
Booked Days Distribution
Booking Pattern Insights for New Castle
- The most common availability pattern in New Castle falls within the 91-180 days range, representing 35.3% of listings. This suggests many properties have significant open periods on their calendars.
- Approximately 64.7% of listings show high availability (181+ days open annually), indicating potential for increased bookings or specific owner usage patterns.
- For booked days, the 91-180 days range is most frequent in New Castle (41.2%), reflecting common guest stay durations or potential owner blocking patterns.
- A notable 35.3% of properties secure long booking periods (181+ days booked per year), highlighting successful long-term rental strategies or significant owner usage.
New Castle Airbnb Minimum Stay Requirements Analysis
Distribution of Listings by Minimum Night Requirement
1 Night
6 listings
35.3% of total
2 Nights
11 listings
64.7% of total
Key Insights
- The most prevalent minimum stay requirement in New Castle is 2 Nights, adopted by 64.7% of listings. This highlights the market's preference for shorter, flexible bookings.
- A strong majority (100.0%) of the New Castle Airbnb data shows acceptance of very short stays (1-2 nights), indicating a dynamic, high-turnover market.
Recommendations
- Align with the market by considering a 2 Nights minimum stay, as 64.7% of New Castle hosts use this setting.
- Adjust minimum nights based on seasonality – potentially shorter during low season and longer during peak demand periods in New Castle.
New Castle Airbnb Cancellation Policy Trends Analysis (2025)
Flexible
3 listings
17.6% of total
Moderate
6 listings
35.3% of total
Firm
5 listings
29.4% of total
Strict
3 listings
17.6% of total
Cancellation Policy Insights for New Castle
- The prevailing Airbnb cancellation policy trend in New Castle is Moderate, used by 35.3% of listings.
- There's a relatively balanced mix between guest-friendly (52.9%) and stricter (47.0%) policies, offering choices for different guest needs.
Recommendations for Hosts
- Consider adopting a Moderate policy to align with the 35.3% market standard in New Castle.
- Regularly review your cancellation policy against competitors and market demand shifts in New Castle.
New Castle STR Booking Lead Time Analysis (2025)
Average Booking Lead Time by Month
Booking Lead Time Insights for New Castle
- The overall average booking lead time for vacation rentals in New Castle is 56 days.
- Guests book furthest in advance for stays during October (average 89 days), likely coinciding with peak travel demand or local events.
- The shortest booking windows occur for stays in January (average 20 days), indicating more last-minute travel plans during this time.
- Seasonally, Summer (70 days avg.) sees the longest lead times, while Winter (28 days avg.) has the shortest, reflecting typical travel planning cycles.
Recommendations for Hosts
- Use the overall average lead time (56 days) as a baseline for your pricing and availability strategy in New Castle.
- For October stays, consider implementing length-of-stay discounts or slightly higher rates for bookings made less than 89 days out to capitalize on advance planning.
- Target marketing efforts for the Summer season well in advance (at least 70 days) to capture early planners.
- Monitor your own booking lead times against these New Castle averages to identify opportunities for dynamic pricing adjustments.
Popular & Essential Airbnb Amenities in New Castle (2025)
Amenity Prevalence
Amenity Insights for New Castle
- Essential amenities in New Castle that guests expect include: Fire extinguisher, Smoke alarm, Air conditioning, Free parking on premises, First aid kit. Lacking these (any) could significantly impact bookings.
- Popular amenities like Carbon monoxide alarm, Kitchen, Hair dryer are common but not universal. Offering these can provide a competitive edge.
- Warning: Wifi is not universally provided but is considered essential globally. Ensure reliable Wifi is offered.
Recommendations for Hosts
- Ensure your listing includes all essential amenities for New Castle: Fire extinguisher, Smoke alarm, Air conditioning, Free parking on premises, First aid kit.
- Consider adding popular differentiators like Carbon monoxide alarm or Kitchen to increase appeal.
- Highlight unique or less common amenities you offer (e.g., hot tub, dedicated workspace, EV charger) in your listing description and photos.
- Regularly check competitor amenities in New Castle to stay competitive.
New Castle Airbnb Guest Demographics & Profile Analysis (2025)
Guest Profile Summary for New Castle
- The typical guest profile for Airbnb in New Castle consists of primarily domestic travelers (95%), often arriving from nearby Alexandria, typically belonging to the Post-2000s (Gen Z/Alpha) group (50%), primarily speaking English or Spanish.
- Domestic travelers account for 94.6% of guests.
- Key international markets include United States (94.6%) and DC (1.5%).
- Top languages spoken are English (76.3%) followed by Spanish (9%).
- A significant demographic segment is the Post-2000s (Gen Z/Alpha) group, representing 50% of guests.
Recommendations for Hosts
- Target domestic marketing efforts towards travelers from Alexandria and Chesapeake.
- Tailor amenities and listing descriptions to appeal to the dominant Post-2000s (Gen Z/Alpha) demographic (e.g., highlight fast WiFi, smart home features, local guides).
- Highlight unique local experiences or amenities relevant to the primary guest profile.
- Consider seasonal promotions aligned with peak travel times for key origin markets.
Nearby Short-Term Rental Market Comparison
How does the New Castle Airbnb market stack up against its neighbors? Compare key performance metrics like average monthly revenue, ADR, and occupancy rates in surrounding areas to understand the broader regional STR landscape.
| Market | Active Properties | Monthly Revenue | Daily Rate | Avg. Occupancy |
|---|---|---|---|---|
| Penhook | 19 | $5,435 | $545.46 | 37% |
| Victor | 19 | $4,783 | $435.08 | 37% |
| Goodview | 24 | $4,485 | $367.02 | 51% |
| Slaty Fork | 37 | $4,450 | $384.61 | 37% |
| State Road | 14 | $4,430 | $252.14 | 47% |
| Rockbridge Baths | 11 | $4,352 | $286.42 | 45% |
| Radford | 29 | $4,276 | $381.36 | 44% |
| Blacksburg | 284 | $3,990 | $475.43 | 40% |
| Leasburg | 16 | $3,895 | $277.89 | 53% |
| Semora | 48 | $3,815 | $355.46 | 41% |