Lovingston Airbnb Market Analysis 2025: Short Term Rental Data & Vacation Rental Statistics in Virginia, United States
Is Airbnb profitable in Lovingston in 2025? Explore comprehensive Airbnb analytics for Lovingston, Virginia, United States to uncover income potential. This 2025 STR market report for Lovingston, based on AirROI data from April 2024 to March 2025, reveals key trends in the niche market of 22 active listings.
Whether you're considering an Airbnb investment in Lovingston, optimizing your existing vacation rental, or exploring rental arbitrage opportunities, understanding the Lovingston Airbnb data is crucial. Leveraging the low regulation environment is key to maximizing your short term rental income potential. Let's dive into the specifics.
Key Lovingston Airbnb Performance Metrics Overview
Monthly Airbnb Revenue Variations & Income Potential in Lovingston (2025)
Understanding the monthly revenue variations for Airbnb listings in Lovingston is key to maximizing your short term rental income potential. Seasonality significantly impacts earnings. Our analysis, based on data from the past 12 months, shows that the peak revenue month for STRs in Lovingston is typically June, while February often presents the lowest earnings, highlighting opportunities for strategic pricing adjustments during shoulder and low seasons. Explore the typical Airbnb income in Lovingston across different performance tiers:
- Best-in-class properties (Top 10%) achieve $6,698+ monthly, often utilizing dynamic pricing and superior guest experiences.
- Strong performing properties (Top 25%) earn $4,396 or more, indicating effective management and desirable locations/amenities.
- Typical properties (Median) generate around $2,457 per month, representing the average market performance.
- Entry-level properties (Bottom 25%) see earnings around $1,457, often with potential for optimization.
Average Monthly Airbnb Earnings Trend in Lovingston
Lovingston Airbnb Occupancy Rate Trends (2025)
Maximize your bookings by understanding the Lovingston STR occupancy trends. Seasonal demand shifts significantly influence how often properties are booked. Typically, Julysees the highest demand (peak season occupancy), while May experiences the lowest (low season). Effective strategies, like adjusting minimum stays or offering promotions, can boost occupancy during slower periods. Here's how different property tiers perform in Lovingston:
- Best-in-class properties (Top 10%) achieve 70%+ occupancy, indicating high desirability and potentially optimized availability.
- Strong performing properties (Top 25%) maintain 51% or higher occupancy, suggesting good market fit and guest satisfaction.
- Typical properties (Median) have an occupancy rate around 36%.
- Entry-level properties (Bottom 25%) average 19% occupancy, potentially facing higher vacancy.
Average Monthly Occupancy Rate Trend in Lovingston
Average Daily Rate (ADR) Airbnb Trends in Lovingston (2025)
Effective short term rental pricing strategy in Lovingston involves understanding monthly ADR fluctuations. The Average Daily Rate (ADR) for Airbnb in Lovingston typically peaks in November and dips lowest during April. Leveraging Airbnb dynamic pricing tools or strategies based on this seasonality can significantly boost revenue. Here's a look at the typical nightly rates achieved:
- Best-in-class properties (Top 10%) command rates of $526+ per night, often due to premium features or locations.
- Strong performing properties (Top 25%) achieve nightly rates of $303 or more.
- Typical properties (Median) charge around $229 per night.
- Entry-level properties (Bottom 25%) earn around $163 per night.
Average Daily Rate (ADR) Trend by Month in Lovingston
Get Live Lovingston Market Intelligence 👇

Explore Real-time Analytics
Airbnb Seasonality Analysis & Trends in Lovingston (2025)
Peak Season (June, August, July)
- Revenue averages $4,260 per month
- Occupancy rates average 47.0%
- Daily rates average $254
Shoulder Season
- Revenue averages $3,048 per month
- Occupancy maintains around 37.1%
- Daily rates hold near $274
Low Season (February, March, September)
- Revenue drops to average $2,368 per month
- Occupancy decreases to average 32.4%
- Daily rates adjust to average $278
Seasonality Insights for Lovingston
- The Airbnb seasonality in Lovingston shows highly seasonal trends requiring careful strategy. While the sections above show seasonal averages, it's also insightful to look at the extremes:
- During the high season, the absolute peak month showcases Lovingston's highest earning potential, with monthly revenues capable of climbing to $4,547, occupancy reaching a high of 50.2%, and ADRs peaking at $293.
- Conversely, the slowest single month of the year, typically falling within the low season, marks the market's lowest point. In this month, revenue might dip to $2,267, occupancy could drop to 26.2%, and ADRs may adjust down to $253.
- Understanding both the seasonal averages and these monthly peaks and troughs in revenue, occupancy, and ADR is crucial for maximizing your Airbnb profit potential in Lovingston.
Seasonal Strategies for Maximizing Profit
- Peak Season: Maximize revenue through premium pricing and potentially longer minimum stays. Ensure high availability.
- Low Season: Offer competitive pricing, special promotions (e.g., extended stay discounts), and flexible cancellation policies. Target off-season travelers like remote workers or budget-conscious guests.
- Shoulder Seasons: Implement dynamic pricing that balances peak and low rates. Target weekend travelers or specific events. Offer slightly more flexible terms than peak season.
- Regularly analyze your own performance against these Lovingston seasonality benchmarks and adjust your pricing and availability strategy accordingly.
Best Areas for Airbnb Investment in Lovingston (2025)
Exploring the top neighborhoods for short-term rentals in Lovingston? This section highlights key areas, outlining why they are attractive for hosts and guests, along with notable local attractions. Consider these locations based on your target guest profile and investment strategy.
| Neighborhood / Area | Why Host Here? (Target Guests & Appeal) | Key Attractions & Landmarks |
|---|---|---|
| Lovingston Downtown | Historic area featuring charming shops and local eateries. It offers a quaint atmosphere that attracts visitors looking to explore a laid-back small-town vibe while being close to the natural beauty of the surrounding Blue Ridge Mountains. | Lovingston Farmers Market, Nelson County Museum, Historic Lovingston Jail, Lovingston Town Park |
| Wintergreen Resort | Popular year-round resort for skiing in winter and hiking in summer. Attracts outdoor enthusiasts and families, making it a prime location for vacation rentals. | Wintergreen Ski Resort, Lake Monocan, Hiking Trails, Golf at Wintergreen, Spa at Wintergreen |
| Montebello | Serene and picturesque community located near the Appalachian Trail, great for nature lovers and those seeking a peaceful retreat in the mountains. | Appalachian Trail, Piney River, Montebello Campground, Scenic Outdoor Activities |
| Sherando Lake | Beautiful natural area ideal for camping, hiking, and swimming. A popular spot for families and gatherings, increasing rental potential during the summer. | Sherando Lake Recreation Area, Hiking Trails, Picnic Areas |
| Richmond Road | Main road leading through Nelson County with easy access to nearby attractions and natural landscapes, making it convenient for travelers. | Nelson County wineries, Access to hiking trails, Local shops |
| Blue Ridge Parkway | Famous scenic highway known for its stunning views and outdoor activities. Ideal for tourists looking for scenic getaways and nature experiences. | Scenic Overlooks, Hiking Trails, Visitor Centers |
| Fifth Street | Residential area near local amenities and attractions, appealing to visitors looking for convenient stays with easy access to local dining and activities. | Local diners, Cafes, Shopping opportunities |
| Natural Bridge State Park | A major natural attraction in the area, drawing tourists interested in geological wonders and outdoor activities, providing a unique setting for rentals. | Natural Bridge, Cedar Creek Trail, Monacan Indian Living History Museum |
Understanding Airbnb License Requirements & STR Laws in Lovingston (2025)
While Lovingston, Virginia, United States currently shows low STR regulations, specific Airbnb license requirements might still exist or change. Always verify the latest short term rental regulations and Airbnb license requirements directly with local government authorities for Lovingston to ensure full compliance before hosting.
(Source: AirROI data, 2025, finding no licensed listings among those analyzed)
Top Performing Airbnb Properties in Lovingston (2025)
Benchmark your potential! Explore examples of top-performing Airbnb properties in Lovingstonbased on Trailing Twelve Month (TTM) revenue. Analyze their characteristics, revenue, occupancy rate, and ADR to understand what drives success in this market.
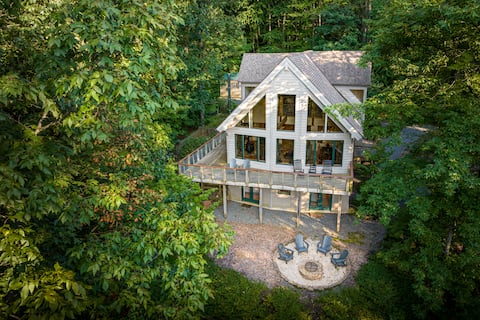
The Treetops Lodge
Entire Place • 4 bedrooms
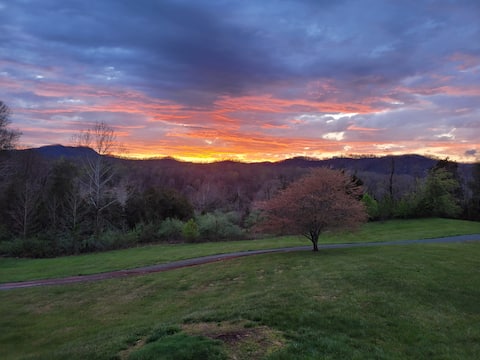
Blue Ridge Cabin
Entire Place • 4 bedrooms

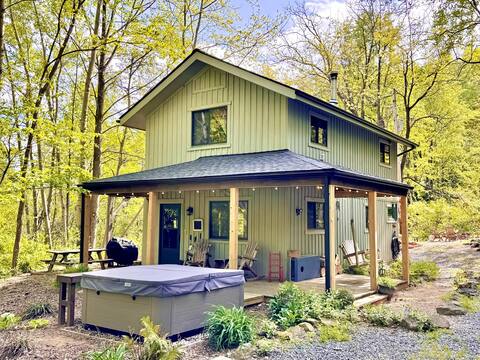
Secluded Mountain Cabin w/ Pool, Trails & Winery ❤️
Entire Place • 4 bedrooms
Ultimate cabin in the mountains
Entire Place • 2 bedrooms
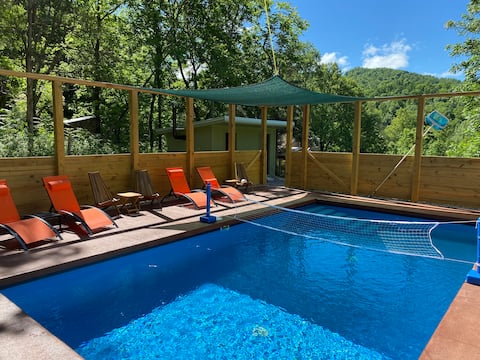
Private Pool & Hot Tub
Entire Place • 3 bedrooms
Three Springs Plus with EV charging station
Entire Place • 4 bedrooms
Note: Performance varies based on location, size, amenities, seasonality, and management quality. Data reflects the past 12 months.
Top Performing Airbnb Hosts in Lovingston (2025)
Learn from the best! This table showcases top-performing Airbnb hosts in Lovingston based on the number of properties managed and estimated total revenue over the past year. Analyze their scale and performance metrics.
| Host Name | Properties | Grossing Revenue | Stay Reviews | Avg Rating |
|---|---|---|---|---|
| Candice | 2 | $97,839 | 25 | 5.00/5.0 |
| Erin | 1 | $78,297 | 49 | 4.98/5.0 |
| Bobbi | 2 | $70,238 | 238 | 4.98/5.0 |
| Deborah | 2 | $68,300 | 212 | 4.93/5.0 |
| Tessa | 3 | $68,228 | 119 | 5.00/5.0 |
| Randy & Halie | 1 | $52,960 | 297 | 4.85/5.0 |
| Andrew | 1 | $51,066 | 168 | 4.98/5.0 |
| Mary | 4 | $40,379 | 98 | 4.89/5.0 |
| Barbara | 1 | $29,997 | 227 | 5.00/5.0 |
| Host #101417032 | 1 | $20,110 | 1 | 0.00/5.0 |
Analyzing the strategies of top hosts, such as their property selection, pricing, and guest communication, can offer valuable lessons for optimizing your own Airbnb operations in Lovingston.
Dive Deeper: Advanced Lovingston STR Market Data (2025)
Ready to unlock more insights? AirROI provides access to advanced metrics and comprehensive Airbnb data for Lovingston. Explore detailed analytics beyond this report to refine your investment strategy, optimize pricing, and maximize your vacation rental profits.
Explore Advanced MetricsLovingston Short-Term Rental Market Composition (2025): Property & Room Types
Room Type Distribution
Property Type Distribution
Market Composition Insights for Lovingston
- The Lovingston Airbnb market composition is heavily skewed towards Entire Home/Apt listings, which make up 72.7% of the 22 active rentals. This indicates strong guest preference for privacy and space.
- Looking at the property type distribution in Lovingston, House properties are the most common (40.9%), reflecting the local real estate landscape.
- Houses represent a significant 40.9% portion, catering likely to families or larger groups.
- The presence of 22.7% Hotel/Boutique listings indicates integration with traditional hospitality.
- Smaller segments like others (combined 4.5%) offer potential for unique stay experiences.
Lovingston Airbnb Room Capacity Analysis (2025): Bedroom Distribution
Distribution of Listings by Number of Bedrooms
Room Capacity Insights for Lovingston
- The dominant room capacity in Lovingston is 3 bedrooms listings, making up 22.7% of the market. This suggests a strong demand for properties suitable for families or small groups.
- Together, 3 bedrooms and 4 bedrooms properties represent 45.4% of the active Airbnb listings in Lovingston, indicating a high concentration in these sizes.
- A significant 59.0% of listings offer 3+ bedrooms, catering to larger groups and families seeking more space in Lovingston.
Lovingston Vacation Rental Guest Capacity Trends (2025)
Distribution of Listings by Guest Capacity
Guest Capacity Insights for Lovingston
- The most common guest capacity trend in Lovingston vacation rentals is listings accommodating 8+ guests (40.9%). This suggests the primary traveler segment is likely larger groups.
- Properties designed for 8+ guests and 6 guests dominate the Lovingston STR market, accounting for 59.1% of listings.
- 59.1% of properties accommodate 6+ guests, serving the market segment for larger families or group travel in Lovingston.
- On average, properties in Lovingston are equipped to host 5.0 guests.
Lovingston Airbnb Booking Patterns (2025): Available vs. Booked Days
Available Days Distribution
Booked Days Distribution
Booking Pattern Insights for Lovingston
- The most common availability pattern in Lovingston falls within the 271-366 days range, representing 50% of listings. This suggests many properties have significant open periods on their calendars.
- Approximately 81.8% of listings show high availability (181+ days open annually), indicating potential for increased bookings or specific owner usage patterns.
- For booked days, the 91-180 days range is most frequent in Lovingston (36.4%), reflecting common guest stay durations or potential owner blocking patterns.
- A notable 18.1% of properties secure long booking periods (181+ days booked per year), highlighting successful long-term rental strategies or significant owner usage.
Lovingston Airbnb Minimum Stay Requirements Analysis
Distribution of Listings by Minimum Night Requirement
1 Night
4 listings
20% of total
2 Nights
13 listings
65% of total
3 Nights
2 listings
10% of total
30+ Nights
1 listings
5% of total
Key Insights
- The most prevalent minimum stay requirement in Lovingston is 2 Nights, adopted by 65% of listings. This highlights the market's preference for shorter, flexible bookings.
- A strong majority (85.0%) of the Lovingston Airbnb data shows acceptance of very short stays (1-2 nights), indicating a dynamic, high-turnover market.
Recommendations
- Align with the market by considering a 2 Nights minimum stay, as 65% of Lovingston hosts use this setting.
- If feasible, allowing 1-night stays, especially midweek or during low season, could capture last-minute bookings, as only 20% currently do.
- Adjust minimum nights based on seasonality – potentially shorter during low season and longer during peak demand periods in Lovingston.
Lovingston Airbnb Cancellation Policy Trends Analysis (2025)
Flexible
7 listings
35% of total
Moderate
11 listings
55% of total
Firm
1 listings
5% of total
Strict
1 listings
5% of total
Cancellation Policy Insights for Lovingston
- The prevailing Airbnb cancellation policy trend in Lovingston is Moderate, used by 55% of listings.
- The market strongly favors guest-friendly terms, with 90.0% of listings offering Flexible or Moderate policies. This suggests guests in Lovingston may expect booking flexibility.
- Strict cancellation policies are quite rare (5%), potentially making listings with this policy less competitive unless justified by high demand or property type.
Recommendations for Hosts
- Consider adopting a Moderate policy to align with the 55% market standard in Lovingston.
- Using a Strict policy might deter some guests, as only 5% of listings use it. Evaluate if potential revenue protection outweighs possible lower booking rates.
- Regularly review your cancellation policy against competitors and market demand shifts in Lovingston.
Lovingston STR Booking Lead Time Analysis (2025)
Average Booking Lead Time by Month
Booking Lead Time Insights for Lovingston
- The overall average booking lead time for vacation rentals in Lovingston is 57 days.
- Guests book furthest in advance for stays during May (average 144 days), likely coinciding with peak travel demand or local events.
- The shortest booking windows occur for stays in February (average 20 days), indicating more last-minute travel plans during this time.
- Seasonally, Spring (99 days avg.) sees the longest lead times, while Winter (39 days avg.) has the shortest, reflecting typical travel planning cycles.
Recommendations for Hosts
- Use the overall average lead time (57 days) as a baseline for your pricing and availability strategy in Lovingston.
- For May stays, consider implementing length-of-stay discounts or slightly higher rates for bookings made less than 144 days out to capitalize on advance planning.
- Target marketing efforts for the Spring season well in advance (at least 99 days) to capture early planners.
- Monitor your own booking lead times against these Lovingston averages to identify opportunities for dynamic pricing adjustments.
Popular & Essential Airbnb Amenities in Lovingston (2025)
Amenity Prevalence
Amenity Insights for Lovingston
- Essential amenities in Lovingston that guests expect include: Fire extinguisher, Heating, Smoke alarm, Wifi, Essentials, Free parking on premises, Air conditioning, Coffee maker, Hair dryer. Lacking these (any) could significantly impact bookings.
- Popular amenities like Outdoor furniture are common but not universal. Offering these can provide a competitive edge.
Recommendations for Hosts
- Ensure your listing includes all essential amenities for Lovingston: Fire extinguisher, Heating, Smoke alarm, Wifi, Essentials, Free parking on premises, Air conditioning, Coffee maker, Hair dryer.
- Prioritize adding missing essentials: Coffee maker, Hair dryer.
- Consider adding popular differentiators like Outdoor furniture to increase appeal.
- Highlight unique or less common amenities you offer (e.g., hot tub, dedicated workspace, EV charger) in your listing description and photos.
- Regularly check competitor amenities in Lovingston to stay competitive.
Lovingston Airbnb Guest Demographics & Profile Analysis (2025)
Guest Profile Summary for Lovingston
- The typical guest profile for Airbnb in Lovingston consists of primarily domestic travelers (95%), often arriving from nearby Richmond, typically belonging to the Post-2000s (Gen Z/Alpha) group (50%), primarily speaking English or Spanish.
- Domestic travelers account for 95.3% of guests.
- Key international markets include United States (95.3%) and DC (3.6%).
- Top languages spoken are English (78.6%) followed by Spanish (9.2%).
- A significant demographic segment is the Post-2000s (Gen Z/Alpha) group, representing 50% of guests.
Recommendations for Hosts
- Target domestic marketing efforts towards travelers from Richmond and Virginia Beach.
- Tailor amenities and listing descriptions to appeal to the dominant Post-2000s (Gen Z/Alpha) demographic (e.g., highlight fast WiFi, smart home features, local guides).
- Highlight unique local experiences or amenities relevant to the primary guest profile.
- Consider seasonal promotions aligned with peak travel times for key origin markets.
Nearby Short-Term Rental Market Comparison
How does the Lovingston Airbnb market stack up against its neighbors? Compare key performance metrics like average monthly revenue, ADR, and occupancy rates in surrounding areas to understand the broader regional STR landscape.
| Market | Active Properties | Monthly Revenue | Daily Rate | Avg. Occupancy |
|---|---|---|---|---|
| Castleton | 10 | $6,255 | $523.55 | 39% |
| Penhook | 19 | $5,435 | $545.46 | 37% |
| Bentonville | 22 | $5,235 | $405.46 | 51% |
| Skyland Estates | 13 | $5,151 | $253.99 | 63% |
| Middleburg | 40 | $4,976 | $454.58 | 41% |
| Haymarket | 10 | $4,965 | $335.50 | 42% |
| Nellysford | 63 | $4,632 | $377.70 | 38% |
| Littleton | 102 | $4,581 | $434.92 | 45% |
| Shenandoah Shores | 15 | $4,548 | $391.92 | 44% |
| Afton | 134 | $4,491 | $330.72 | 41% |