Gloucester Point Airbnb Market Analysis 2025: Short Term Rental Data & Vacation Rental Statistics in Virginia, United States
Is Airbnb profitable in Gloucester Point in 2025? Explore comprehensive Airbnb analytics for Gloucester Point, Virginia, United States to uncover income potential. This 2025 STR market report for Gloucester Point, based on AirROI data from April 2024 to March 2025, reveals key trends in the niche market of 17 active listings.
Whether you're considering an Airbnb investment in Gloucester Point, optimizing your existing vacation rental, or exploring rental arbitrage opportunities, understanding the Gloucester Point Airbnb data is crucial. Leveraging the low regulation environment is key to maximizing your short term rental income potential. Let's dive into the specifics.
Key Gloucester Point Airbnb Performance Metrics Overview
Monthly Airbnb Revenue Variations & Income Potential in Gloucester Point (2025)
Understanding the monthly revenue variations for Airbnb listings in Gloucester Point is key to maximizing your short term rental income potential. Seasonality significantly impacts earnings. Our analysis, based on data from the past 12 months, shows that the peak revenue month for STRs in Gloucester Point is typically June, while February often presents the lowest earnings, highlighting opportunities for strategic pricing adjustments during shoulder and low seasons. Explore the typical Airbnb income in Gloucester Point across different performance tiers:
- Best-in-class properties (Top 10%) achieve $6,475+ monthly, often utilizing dynamic pricing and superior guest experiences.
- Strong performing properties (Top 25%) earn $4,370 or more, indicating effective management and desirable locations/amenities.
- Typical properties (Median) generate around $2,881 per month, representing the average market performance.
- Entry-level properties (Bottom 25%) see earnings around $859, often with potential for optimization.
Average Monthly Airbnb Earnings Trend in Gloucester Point
Gloucester Point Airbnb Occupancy Rate Trends (2025)
Maximize your bookings by understanding the Gloucester Point STR occupancy trends. Seasonal demand shifts significantly influence how often properties are booked. Typically, Junesees the highest demand (peak season occupancy), while March experiences the lowest (low season). Effective strategies, like adjusting minimum stays or offering promotions, can boost occupancy during slower periods. Here's how different property tiers perform in Gloucester Point:
- Best-in-class properties (Top 10%) achieve 83%+ occupancy, indicating high desirability and potentially optimized availability.
- Strong performing properties (Top 25%) maintain 72% or higher occupancy, suggesting good market fit and guest satisfaction.
- Typical properties (Median) have an occupancy rate around 57%.
- Entry-level properties (Bottom 25%) average 42% occupancy, potentially facing higher vacancy.
Average Monthly Occupancy Rate Trend in Gloucester Point
Average Daily Rate (ADR) Airbnb Trends in Gloucester Point (2025)
Effective short term rental pricing strategy in Gloucester Point involves understanding monthly ADR fluctuations. The Average Daily Rate (ADR) for Airbnb in Gloucester Point typically peaks in January and dips lowest during October. Leveraging Airbnb dynamic pricing tools or strategies based on this seasonality can significantly boost revenue. Here's a look at the typical nightly rates achieved:
- Best-in-class properties (Top 10%) command rates of $283+ per night, often due to premium features or locations.
- Strong performing properties (Top 25%) achieve nightly rates of $199 or more.
- Typical properties (Median) charge around $150 per night.
- Entry-level properties (Bottom 25%) earn around $45 per night.
Average Daily Rate (ADR) Trend by Month in Gloucester Point
Get Live Gloucester Point Market Intelligence 👇

Explore Real-time Analytics
Airbnb Seasonality Analysis & Trends in Gloucester Point (2025)
Peak Season (June, July, August)
- Revenue averages $4,389 per month
- Occupancy rates average 74.9%
- Daily rates average $152
Shoulder Season
- Revenue averages $2,984 per month
- Occupancy maintains around 55.9%
- Daily rates hold near $155
Low Season (January, February, March)
- Revenue drops to average $1,727 per month
- Occupancy decreases to average 36.7%
- Daily rates adjust to average $170
Seasonality Insights for Gloucester Point
- The Airbnb seasonality in Gloucester Point shows highly seasonal trends requiring careful strategy. While the sections above show seasonal averages, it's also insightful to look at the extremes:
- During the high season, the absolute peak month showcases Gloucester Point's highest earning potential, with monthly revenues capable of climbing to $4,758, occupancy reaching a high of 79.0%, and ADRs peaking at $174.
- Conversely, the slowest single month of the year, typically falling within the low season, marks the market's lowest point. In this month, revenue might dip to $1,362, occupancy could drop to 35.5%, and ADRs may adjust down to $144.
- Understanding both the seasonal averages and these monthly peaks and troughs in revenue, occupancy, and ADR is crucial for maximizing your Airbnb profit potential in Gloucester Point.
Seasonal Strategies for Maximizing Profit
- Peak Season: Maximize revenue through premium pricing and potentially longer minimum stays. Ensure high availability.
- Low Season: Offer competitive pricing, special promotions (e.g., extended stay discounts), and flexible cancellation policies. Target off-season travelers like remote workers or budget-conscious guests.
- Shoulder Seasons: Implement dynamic pricing that balances peak and low rates. Target weekend travelers or specific events. Offer slightly more flexible terms than peak season.
- Regularly analyze your own performance against these Gloucester Point seasonality benchmarks and adjust your pricing and availability strategy accordingly.
Best Areas for Airbnb Investment in Gloucester Point (2025)
Exploring the top neighborhoods for short-term rentals in Gloucester Point? This section highlights key areas, outlining why they are attractive for hosts and guests, along with notable local attractions. Consider these locations based on your target guest profile and investment strategy.
| Neighborhood / Area | Why Host Here? (Target Guests & Appeal) | Key Attractions & Landmarks |
|---|---|---|
| Historic District | Charming area full of 18th-century buildings and rich history. Close to the waterfront, making it perfect for tourists interested in history and culture. | Gloucester Point Beach Park, Abingdon Parish Church, Historic Garden Week, Gloucester Museum of History |
| York River State Park | A beautiful natural area great for outdoor enthusiasts. Visitors can enjoy hiking, fishing, and wildlife watching in a serene environment. | York River State Park, Pamunkey River, wildlife trails, kayaking, picnic areas |
| Holly Beach | Quiet residential area with nearby waterfront access. Attractive for families looking for a peaceful getaway close to the water. | Holly Beach, Gloucester Point Golf Club, waterfront parks, local eateries |
| Ware Neck | A more secluded area with stunning views of the Ware River. Ideal for those seeking a tranquil retreat in nature. | Ware River, Fishing spots, Nature trails, Historic sites |
| Mobjack Bay | Beautiful coastal area known for its natural scenery and waterfront activities. Attracts nature lovers and those looking to unwind by the water. | Mobjack Bay, Water sports, Sunset views, Scenic walks, Local seafood markets |
| Gloucester Point Marina | Active marina area perfect for boaters and those enjoying water sports. Strong appeal for visitors interested in maritime activities. | Gloucester Point Marina, Boat rentals, Fishing opportunities, Local restaurants |
| Bethel Beach | A peaceful beach area with limited crowds, ideal for a relaxing beach day. Known for its natural beauty and quiet environment. | Bethel Beach, Birdwatching, Beachcombing, Cape Charles Natural Area Preserve |
| Bayside | Scenic area with attractive waterfront homes and views. Suitable for vacationers looking for a serene escape close to nature and water activities. | Bayside Park, Waterfront trails, Kayaking, Fishing spots |
Understanding Airbnb License Requirements & STR Laws in Gloucester Point (2025)
While Gloucester Point, Virginia, United States currently shows low STR regulations, specific Airbnb license requirements might still exist or change. Always verify the latest short term rental regulations and Airbnb license requirements directly with local government authorities for Gloucester Point to ensure full compliance before hosting.
(Source: AirROI data, 2025, finding no licensed listings among those analyzed)
Top Performing Airbnb Properties in Gloucester Point (2025)
Benchmark your potential! Explore examples of top-performing Airbnb properties in Gloucester Pointbased on Trailing Twelve Month (TTM) revenue. Analyze their characteristics, revenue, occupancy rate, and ADR to understand what drives success in this market.
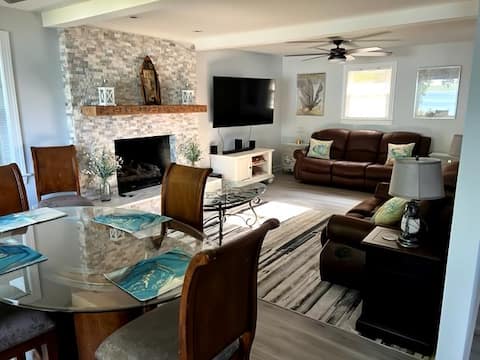
Amazing Gem! Riverfront, Location, Sunsets, Quite
Entire Place • 3 bedrooms
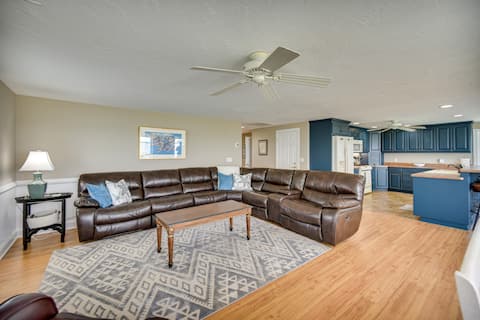
Gloucester Point Vacation Rental on York River!
Entire Place • 4 bedrooms
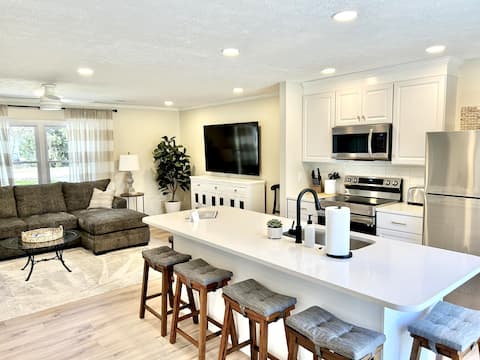
Pointe Haven near Historic Yorktown
Entire Place • 3 bedrooms

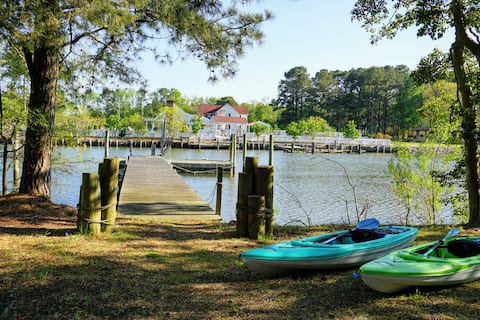
York River Vacation Home
Entire Place • 4 bedrooms
The Cottage on Sarah's Creek
Entire Place • 1 bedroom

Large 4bed 2.5b home w/ fenced in back yard & deck
Entire Place • 4 bedrooms
Note: Performance varies based on location, size, amenities, seasonality, and management quality. Data reflects the past 12 months.
Top Performing Airbnb Hosts in Gloucester Point (2025)
Learn from the best! This table showcases top-performing Airbnb hosts in Gloucester Point based on the number of properties managed and estimated total revenue over the past year. Analyze their scale and performance metrics.
| Host Name | Properties | Grossing Revenue | Stay Reviews | Avg Rating |
|---|---|---|---|---|
| Chip-Marie | 1 | $64,019 | 61 | 4.98/5.0 |
| Evolve | 1 | $61,684 | 10 | 4.90/5.0 |
| Michelle | 1 | $58,455 | 115 | 4.99/5.0 |
| Eugene | 1 | $55,544 | 173 | 4.99/5.0 |
| Amber | 1 | $45,506 | 235 | 4.94/5.0 |
| Phillip | 1 | $39,985 | 86 | 4.67/5.0 |
| Vernon | 1 | $38,680 | 121 | 4.96/5.0 |
| Annie | 1 | $34,756 | 27 | 5.00/5.0 |
| James | 1 | $34,727 | 132 | 4.98/5.0 |
| David | 1 | $33,871 | 26 | 4.92/5.0 |
Analyzing the strategies of top hosts, such as their property selection, pricing, and guest communication, can offer valuable lessons for optimizing your own Airbnb operations in Gloucester Point.
Dive Deeper: Advanced Gloucester Point STR Market Data (2025)
Ready to unlock more insights? AirROI provides access to advanced metrics and comprehensive Airbnb data for Gloucester Point. Explore detailed analytics beyond this report to refine your investment strategy, optimize pricing, and maximize your vacation rental profits.
Explore Advanced MetricsGloucester Point Short-Term Rental Market Composition (2025): Property & Room Types
Room Type Distribution
Property Type Distribution
Market Composition Insights for Gloucester Point
- The Gloucester Point Airbnb market composition is heavily skewed towards Entire Home/Apt listings, which make up 64.7% of the 17 active rentals. This indicates strong guest preference for privacy and space.
- However, a notable 35.3% share for Private Rooms suggests opportunities for budget-conscious travelers or hosts renting out spare rooms.
- Looking at the property type distribution in Gloucester Point, House properties are the most common (88.2%), reflecting the local real estate landscape.
- Houses represent a significant 88.2% portion, catering likely to families or larger groups.
- The presence of 11.8% Hotel/Boutique listings indicates integration with traditional hospitality.
Gloucester Point Airbnb Room Capacity Analysis (2025): Bedroom Distribution
Distribution of Listings by Number of Bedrooms
Room Capacity Insights for Gloucester Point
- The dominant room capacity in Gloucester Point is 1 bedroom listings, making up 35.3% of the market. This suggests a strong demand for properties suitable for couples or solo travelers.
- Together, 1 bedroom and 3 bedrooms properties represent 64.7% of the active Airbnb listings in Gloucester Point, indicating a high concentration in these sizes.
- A significant 47.0% of listings offer 3+ bedrooms, catering to larger groups and families seeking more space in Gloucester Point.
Gloucester Point Vacation Rental Guest Capacity Trends (2025)
Distribution of Listings by Guest Capacity
Guest Capacity Insights for Gloucester Point
- The most common guest capacity trend in Gloucester Point vacation rentals is listings accommodating 2 guests (23.5%). This suggests the primary traveler segment is likely couples or solo travelers.
- Properties designed for 2 guests and 6 guests dominate the Gloucester Point STR market, accounting for 47.0% of listings.
- 47.0% of properties accommodate 6+ guests, serving the market segment for larger families or group travel in Gloucester Point.
- On average, properties in Gloucester Point are equipped to host 4.2 guests.
Gloucester Point Airbnb Booking Patterns (2025): Available vs. Booked Days
Available Days Distribution
Booked Days Distribution
Booking Pattern Insights for Gloucester Point
- The most common availability pattern in Gloucester Point falls within the 181-270 days range, representing 58.8% of listings. This suggests many properties have significant open periods on their calendars.
- Approximately 58.8% of listings show high availability (181+ days open annually), indicating potential for increased bookings or specific owner usage patterns.
- For booked days, the 91-180 days range is most frequent in Gloucester Point (58.8%), reflecting common guest stay durations or potential owner blocking patterns.
- A notable 41.2% of properties secure long booking periods (181+ days booked per year), highlighting successful long-term rental strategies or significant owner usage.
Gloucester Point Airbnb Minimum Stay Requirements Analysis
Distribution of Listings by Minimum Night Requirement
1 Night
5 listings
31.3% of total
2 Nights
2 listings
12.5% of total
3 Nights
6 listings
37.5% of total
4-6 Nights
1 listings
6.3% of total
30+ Nights
2 listings
12.5% of total
Key Insights
- The most prevalent minimum stay requirement in Gloucester Point is 3 Nights, adopted by 37.5% of listings. This highlights the market's preference for longer commitments.
- A significant segment (12.5%) caters to monthly stays (30+ nights) in Gloucester Point, pointing to opportunities in the extended-stay market.
Recommendations
- Align with the market by considering a 3 Nights minimum stay, as 37.5% of Gloucester Point hosts use this setting.
- Explore offering discounts for stays of 30+ nights to attract the 12.5% of the market seeking extended stays.
- Adjust minimum nights based on seasonality – potentially shorter during low season and longer during peak demand periods in Gloucester Point.
Gloucester Point Airbnb Cancellation Policy Trends Analysis (2025)
Flexible
3 listings
21.4% of total
Moderate
1 listings
7.1% of total
Firm
7 listings
50% of total
Strict
3 listings
21.4% of total
Cancellation Policy Insights for Gloucester Point
- The prevailing Airbnb cancellation policy trend in Gloucester Point is Firm, used by 50% of listings.
- A majority (71.4%) of hosts in Gloucester Point utilize Firm or Strict policies, indicating a market where hosts prioritize booking security.
Recommendations for Hosts
- Consider adopting a Firm policy to align with the 50% market standard in Gloucester Point.
- Regularly review your cancellation policy against competitors and market demand shifts in Gloucester Point.
Gloucester Point STR Booking Lead Time Analysis (2025)
Average Booking Lead Time by Month
Booking Lead Time Insights for Gloucester Point
- The overall average booking lead time for vacation rentals in Gloucester Point is 38 days.
- Guests book furthest in advance for stays during July (average 114 days), likely coinciding with peak travel demand or local events.
- The shortest booking windows occur for stays in February (average 33 days), indicating more last-minute travel plans during this time.
- Seasonally, Summer (82 days avg.) sees the longest lead times, while Winter (39 days avg.) has the shortest, reflecting typical travel planning cycles.
Recommendations for Hosts
- Use the overall average lead time (38 days) as a baseline for your pricing and availability strategy in Gloucester Point.
- For July stays, consider implementing length-of-stay discounts or slightly higher rates for bookings made less than 114 days out to capitalize on advance planning.
- Target marketing efforts for the Summer season well in advance (at least 82 days) to capture early planners.
- Monitor your own booking lead times against these Gloucester Point averages to identify opportunities for dynamic pricing adjustments.
Popular & Essential Airbnb Amenities in Gloucester Point (2025)
Amenity Prevalence
No amenities with partial availability (less than 100%) were found to display in the chart. All essential amenities might be present in all listings. Check insights below.
Amenity Insights for Gloucester Point
- Essential amenities in Gloucester Point that guests expect include: Refrigerator, Smoke alarm, Hot water, Air conditioning, Microwave, Wifi, Heating, Kitchen, Free parking on premises, TV. Lacking these (any) could significantly impact bookings.
Recommendations for Hosts
- Ensure your listing includes all essential amenities for Gloucester Point: Refrigerator, Smoke alarm, Hot water, Air conditioning, Microwave, Wifi, Heating, Kitchen, Free parking on premises, TV.
- Highlight unique or less common amenities you offer (e.g., hot tub, dedicated workspace, EV charger) in your listing description and photos.
- Regularly check competitor amenities in Gloucester Point to stay competitive.
Gloucester Point Airbnb Guest Demographics & Profile Analysis (2025)
Guest Profile Summary for Gloucester Point
- The typical guest profile for Airbnb in Gloucester Point consists of primarily domestic travelers (96%), often arriving from nearby Richmond, typically belonging to the Post-2000s (Gen Z/Alpha) group (50%), primarily speaking English or Spanish.
- Domestic travelers account for 96.4% of guests.
- Key international markets include United States (96.4%) and United Kingdom (1.2%).
- Top languages spoken are English (73.7%) followed by Spanish (11%).
- A significant demographic segment is the Post-2000s (Gen Z/Alpha) group, representing 50% of guests.
Recommendations for Hosts
- Target domestic marketing efforts towards travelers from Richmond and New York.
- Tailor amenities and listing descriptions to appeal to the dominant Post-2000s (Gen Z/Alpha) demographic (e.g., highlight fast WiFi, smart home features, local guides).
- Highlight unique local experiences or amenities relevant to the primary guest profile.
- Consider seasonal promotions aligned with peak travel times for key origin markets.
Nearby Short-Term Rental Market Comparison
How does the Gloucester Point Airbnb market stack up against its neighbors? Compare key performance metrics like average monthly revenue, ADR, and occupancy rates in surrounding areas to understand the broader regional STR landscape.
| Market | Active Properties | Monthly Revenue | Daily Rate | Avg. Occupancy |
|---|---|---|---|---|
| Mayo | 13 | $5,786 | $439.15 | 52% |
| Stevensville | 70 | $5,476 | $499.46 | 43% |
| Chester | 17 | $5,299 | $437.72 | 43% |
| Arundel on the Bay | 25 | $5,285 | $509.37 | 39% |
| Middleburg | 40 | $4,976 | $454.58 | 41% |
| Haymarket | 10 | $4,965 | $335.50 | 42% |
| Easton | 46 | $4,818 | $650.75 | 37% |
| Piney Point | 14 | $4,799 | $370.29 | 41% |
| Queenstown | 19 | $4,699 | $535.73 | 30% |
| Riva | 15 | $4,643 | $405.47 | 51% |