Barboursville Airbnb Market Analysis 2025: Short Term Rental Data & Vacation Rental Statistics in Virginia, United States
Is Airbnb profitable in Barboursville in 2025? Explore comprehensive Airbnb analytics for Barboursville, Virginia, United States to uncover income potential. This 2025 STR market report for Barboursville, based on AirROI data from June 2024 to May 2025, reveals key trends in the niche market of 19 active listings.
Whether you're considering an Airbnb investment in Barboursville, optimizing your existing vacation rental, or exploring rental arbitrage opportunities, understanding the Barboursville Airbnb data is crucial. Leveraging the low regulation environment is key to maximizing your short term rental income potential. Let's dive into the specifics.
Key Barboursville Airbnb Performance Metrics Overview
Monthly Airbnb Revenue Variations & Income Potential in Barboursville (2025)
Understanding the monthly revenue variations for Airbnb listings in Barboursville is key to maximizing your short term rental income potential. Seasonality significantly impacts earnings. Our analysis, based on data from the past 12 months, shows that the peak revenue month for STRs in Barboursville is typically April, while January often presents the lowest earnings, highlighting opportunities for strategic pricing adjustments during shoulder and low seasons. Explore the typical Airbnb income in Barboursville across different performance tiers:
- Best-in-class properties (Top 10%) achieve $6,969+ monthly, often utilizing dynamic pricing and superior guest experiences.
- Strong performing properties (Top 25%) earn $3,799 or more, indicating effective management and desirable locations/amenities.
- Typical properties (Median) generate around $2,118 per month, representing the average market performance.
- Entry-level properties (Bottom 25%) see earnings around $1,146, often with potential for optimization.
Average Monthly Airbnb Earnings Trend in Barboursville
Barboursville Airbnb Occupancy Rate Trends (2025)
Maximize your bookings by understanding the Barboursville STR occupancy trends. Seasonal demand shifts significantly influence how often properties are booked. Typically, Aprilsees the highest demand (peak season occupancy), while January experiences the lowest (low season). Effective strategies, like adjusting minimum stays or offering promotions, can boost occupancy during slower periods. Here's how different property tiers perform in Barboursville:
- Best-in-class properties (Top 10%) achieve 70%+ occupancy, indicating high desirability and potentially optimized availability.
- Strong performing properties (Top 25%) maintain 58% or higher occupancy, suggesting good market fit and guest satisfaction.
- Typical properties (Median) have an occupancy rate around 34%.
- Entry-level properties (Bottom 25%) average 22% occupancy, potentially facing higher vacancy.
Average Monthly Occupancy Rate Trend in Barboursville
Average Daily Rate (ADR) Airbnb Trends in Barboursville (2025)
Effective short term rental pricing strategy in Barboursville involves understanding monthly ADR fluctuations. The Average Daily Rate (ADR) for Airbnb in Barboursville typically peaks in May and dips lowest during June. Leveraging Airbnb dynamic pricing tools or strategies based on this seasonality can significantly boost revenue. Here's a look at the typical nightly rates achieved:
- Best-in-class properties (Top 10%) command rates of $405+ per night, often due to premium features or locations.
- Strong performing properties (Top 25%) achieve nightly rates of $269 or more.
- Typical properties (Median) charge around $146 per night.
- Entry-level properties (Bottom 25%) earn around $117 per night.
Average Daily Rate (ADR) Trend by Month in Barboursville
Get Live Barboursville Market Intelligence 👇

Explore Real-time Analytics
Airbnb Seasonality Analysis & Trends in Barboursville (2025)
Peak Season (April, October, May)
- Revenue averages $4,213 per month
- Occupancy rates average 48.7%
- Daily rates average $239
Shoulder Season
- Revenue averages $2,554 per month
- Occupancy maintains around 41.1%
- Daily rates hold near $208
Low Season (January, March, December)
- Revenue drops to average $1,941 per month
- Occupancy decreases to average 26.7%
- Daily rates adjust to average $238
Seasonality Insights for Barboursville
- The Airbnb seasonality in Barboursville shows highly seasonal trends requiring careful strategy. While the sections above show seasonal averages, it's also insightful to look at the extremes:
- During the high season, the absolute peak month showcases Barboursville's highest earning potential, with monthly revenues capable of climbing to $5,160, occupancy reaching a high of 58.9%, and ADRs peaking at $266.
- Conversely, the slowest single month of the year, typically falling within the low season, marks the market's lowest point. In this month, revenue might dip to $1,422, occupancy could drop to 18.3%, and ADRs may adjust down to $191.
- Understanding both the seasonal averages and these monthly peaks and troughs in revenue, occupancy, and ADR is crucial for maximizing your Airbnb profit potential in Barboursville.
Seasonal Strategies for Maximizing Profit
- Peak Season: Maximize revenue through premium pricing and potentially longer minimum stays. Ensure high availability.
- Low Season: Offer competitive pricing, special promotions (e.g., extended stay discounts), and flexible cancellation policies. Target off-season travelers like remote workers or budget-conscious guests.
- Shoulder Seasons: Implement dynamic pricing that balances peak and low rates. Target weekend travelers or specific events. Offer slightly more flexible terms than peak season.
- Regularly analyze your own performance against these Barboursville seasonality benchmarks and adjust your pricing and availability strategy accordingly.
Best Areas for Airbnb Investment in Barboursville (2025)
Exploring the top neighborhoods for short-term rentals in Barboursville? This section highlights key areas, outlining why they are attractive for hosts and guests, along with notable local attractions. Consider these locations based on your target guest profile and investment strategy.
| Neighborhood / Area | Why Host Here? (Target Guests & Appeal) | Key Attractions & Landmarks |
|---|---|---|
| Barboursville Vineyards | A popular destination for wine lovers with beautiful landscapes and vineyard tours. Appeals to tourists looking for a serene getaway in wine country with events and tastings throughout the year. | Barboursville Vineyards, Historic Barboursville, Virginia Piedmont Wine Trail |
| Lake Anna | A beautiful recreational area known for its fishing, boating, and outdoor activities. Attracts families and nature lovers seeking lakeside relaxation and adventure. | Lake Anna State Park, Fishing and boating, Local restaurants and picnic areas |
| Orange, VA | A historic town with charming architecture and access to Civil War sites. Great for history buffs and those interested in exploring local culture. | James Madison's Montpelier, The Market at Grelen, Historic downtown Orange |
| Charlottesville, VA | Home to the University of Virginia, this city has a vibrant cultural scene, numerous festivals, and beautiful surroundings. Perfect for visitors looking to explore both history and modern attractions. | University of Virginia, Monticello, Historic Downtown Mall, local breweries and wineries |
| Shenandoah National Park | A stunning natural area ideal for hiking and outdoor enthusiasts. Offers opportunities for nature retreats attracting those who enjoy the outdoors. | Skyline Drive, Hiking trails, Wildlife watching, Scenic overlooks |
| Richmond, VA | The state capital with a rich history and a growing arts scene. Appeals to tourists interested in culture, history, and dining. | Virginia State Capitol, Lewis Ginter Botanical Garden, Historic Civil War sites, local restaurants |
| Fredericksburg, VA | Known for its historic significance during the Civil War. Attracts visitors interested in history and heritage tourism. | Fredericksburg National Cemetery, Historic downtown, Civil War Battlefields |
| Culpeper, VA | This quaint town offers a charming historic district and access to outdoor activities. Great for tourists seeking a quiet getaway with local flavor. | Culpeper History Museum, Local farms and markets, Lake Pelham |
Understanding Airbnb License Requirements & STR Laws in Barboursville (2025)
While Barboursville, Virginia, United States currently shows low STR regulations, specific Airbnb license requirements might still exist or change. Always verify the latest short term rental regulations and Airbnb license requirements directly with local government authorities for Barboursville to ensure full compliance before hosting.
(Source: AirROI data, 2025, finding no licensed listings among those analyzed)
Top Performing Airbnb Properties in Barboursville (2025)
Benchmark your potential! Explore examples of top-performing Airbnb properties in Barboursvillebased on Trailing Twelve Month (TTM) revenue. Analyze their characteristics, revenue, occupancy rate, and ADR to understand what drives success in this market.
Spaniel Hill; cozy hilltop home w privacy & views
Entire Place • 4 bedrooms
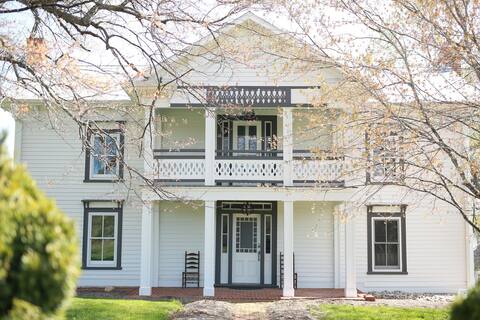
Wildwood: Your Farm Stay near UVA in Barboursville
Entire Place • 5 bedrooms
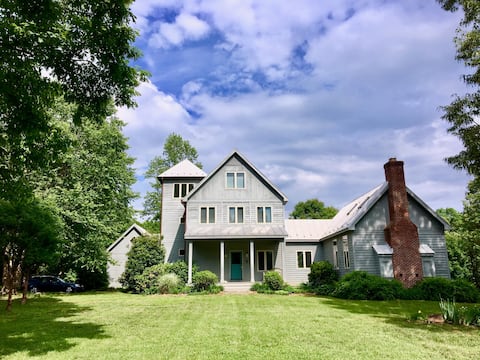
Entire Farm House: Rustic, Classic, Perfect
Entire Place • 4 bedrooms
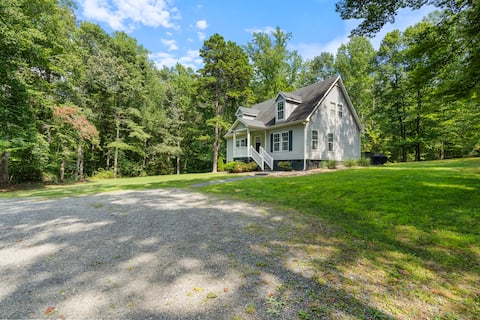
Wooded Escape Near UVA, Wineries & Skyline Dr
Entire Place • 3 bedrooms

Burnley Cottage
Entire Place • 1 bedroom

Moonfire Farm cozy Shenandoah Region Getaway
Entire Place • 2 bedrooms
Note: Performance varies based on location, size, amenities, seasonality, and management quality. Data reflects the past 12 months.
Top Performing Airbnb Hosts in Barboursville (2025)
Learn from the best! This table showcases top-performing Airbnb hosts in Barboursville based on the number of properties managed and estimated total revenue over the past year. Analyze their scale and performance metrics.
| Host Name | Properties | Grossing Revenue | Stay Reviews | Avg Rating |
|---|---|---|---|---|
| Angela | 2 | $69,188 | 65 | 4.98/5.0 |
| Kathryn | 1 | $55,562 | 259 | 4.92/5.0 |
| Virginia | 1 | $54,787 | 72 | 4.99/5.0 |
| Amanda | 1 | $44,376 | 7 | 4.86/5.0 |
| Josh & Megan | 2 | $41,888 | 247 | 4.90/5.0 |
| Virginia | 2 | $33,117 | 158 | 4.92/5.0 |
| Stuart And Christina | 1 | $28,692 | 208 | 4.98/5.0 |
| David | 1 | $20,990 | 166 | 4.89/5.0 |
| Tabitha | 1 | $14,642 | 7 | 5.00/5.0 |
| Christina | 1 | $13,736 | 181 | 4.91/5.0 |
Analyzing the strategies of top hosts, such as their property selection, pricing, and guest communication, can offer valuable lessons for optimizing your own Airbnb operations in Barboursville.
Dive Deeper: Advanced Barboursville STR Market Data (2025)
Ready to unlock more insights? AirROI provides access to advanced metrics and comprehensive Airbnb data for Barboursville. Explore detailed analytics beyond this report to refine your investment strategy, optimize pricing, and maximize your vacation rental profits.
Explore Advanced MetricsBarboursville Short-Term Rental Market Composition (2025): Property & Room Types
Room Type Distribution
Property Type Distribution
Market Composition Insights for Barboursville
- The Barboursville Airbnb market composition is heavily skewed towards Entire Home/Apt listings, which make up 94.7% of the 19 active rentals. This indicates strong guest preference for privacy and space.
- Looking at the property type distribution in Barboursville, House properties are the most common (42.1%), reflecting the local real estate landscape.
- Houses represent a significant 42.1% portion, catering likely to families or larger groups.
- The presence of 10.5% Hotel/Boutique listings indicates integration with traditional hospitality.
Barboursville Airbnb Room Capacity Analysis (2025): Bedroom Distribution
Distribution of Listings by Number of Bedrooms
Room Capacity Insights for Barboursville
- The dominant room capacity in Barboursville is 2 bedrooms listings, making up 47.4% of the market. This suggests a strong demand for properties suitable for couples or solo travelers.
- Together, 2 bedrooms and 3 bedrooms properties represent 63.2% of the active Airbnb listings in Barboursville, indicating a high concentration in these sizes.
- A significant 36.9% of listings offer 3+ bedrooms, catering to larger groups and families seeking more space in Barboursville.
Barboursville Vacation Rental Guest Capacity Trends (2025)
Distribution of Listings by Guest Capacity
Guest Capacity Insights for Barboursville
- The most common guest capacity trend in Barboursville vacation rentals is listings accommodating 8+ guests (31.6%). This suggests the primary traveler segment is likely larger groups.
- Properties designed for 8+ guests and 5 guests dominate the Barboursville STR market, accounting for 47.4% of listings.
- 57.9% of properties accommodate 6+ guests, serving the market segment for larger families or group travel in Barboursville.
- On average, properties in Barboursville are equipped to host 5.8 guests.
Barboursville Airbnb Booking Patterns (2025): Available vs. Booked Days
Available Days Distribution
Booked Days Distribution
Booking Pattern Insights for Barboursville
- The most common availability pattern in Barboursville falls within the 271-366 days range, representing 57.9% of listings. This suggests many properties have significant open periods on their calendars.
- Approximately 79.0% of listings show high availability (181+ days open annually), indicating potential for increased bookings or specific owner usage patterns.
- For booked days, the 31-90 days range is most frequent in Barboursville (42.1%), reflecting common guest stay durations or potential owner blocking patterns.
- A notable 21.1% of properties secure long booking periods (181+ days booked per year), highlighting successful long-term rental strategies or significant owner usage.
Barboursville Airbnb Minimum Stay Requirements Analysis
Distribution of Listings by Minimum Night Requirement
1 Night
6 listings
33.3% of total
2 Nights
10 listings
55.6% of total
30+ Nights
2 listings
11.1% of total
Key Insights
- The most prevalent minimum stay requirement in Barboursville is 2 Nights, adopted by 55.6% of listings. This highlights the market's preference for shorter, flexible bookings.
- A strong majority (88.9%) of the Barboursville Airbnb data shows acceptance of very short stays (1-2 nights), indicating a dynamic, high-turnover market.
- A significant segment (11.1%) caters to monthly stays (30+ nights) in Barboursville, pointing to opportunities in the extended-stay market.
Recommendations
- Align with the market by considering a 2 Nights minimum stay, as 55.6% of Barboursville hosts use this setting.
- Explore offering discounts for stays of 30+ nights to attract the 11.1% of the market seeking extended stays.
- Adjust minimum nights based on seasonality – potentially shorter during low season and longer during peak demand periods in Barboursville.
Barboursville Airbnb Cancellation Policy Trends Analysis (2025)
Flexible
2 listings
11.8% of total
Moderate
10 listings
58.8% of total
Firm
3 listings
17.6% of total
Strict
2 listings
11.8% of total
Cancellation Policy Insights for Barboursville
- The prevailing Airbnb cancellation policy trend in Barboursville is Moderate, used by 58.8% of listings.
- The market strongly favors guest-friendly terms, with 70.6% of listings offering Flexible or Moderate policies. This suggests guests in Barboursville may expect booking flexibility.
Recommendations for Hosts
- Consider adopting a Moderate policy to align with the 58.8% market standard in Barboursville.
- Using a Strict policy might deter some guests, as only 11.8% of listings use it. Evaluate if potential revenue protection outweighs possible lower booking rates.
- Regularly review your cancellation policy against competitors and market demand shifts in Barboursville.
Barboursville STR Booking Lead Time Analysis (2025)
Average Booking Lead Time by Month
Booking Lead Time Insights for Barboursville
- The overall average booking lead time for vacation rentals in Barboursville is 56 days.
- Guests book furthest in advance for stays during May (average 120 days), likely coinciding with peak travel demand or local events.
- The shortest booking windows occur for stays in July (average 27 days), indicating more last-minute travel plans during this time.
- Seasonally, Spring (74 days avg.) sees the longest lead times, while Winter (39 days avg.) has the shortest, reflecting typical travel planning cycles.
Recommendations for Hosts
- Use the overall average lead time (56 days) as a baseline for your pricing and availability strategy in Barboursville.
- For May stays, consider implementing length-of-stay discounts or slightly higher rates for bookings made less than 120 days out to capitalize on advance planning.
- Target marketing efforts for the Spring season well in advance (at least 74 days) to capture early planners.
- Monitor your own booking lead times against these Barboursville averages to identify opportunities for dynamic pricing adjustments.
Popular & Essential Airbnb Amenities in Barboursville (2025)
Amenity Prevalence
Amenity Insights for Barboursville
- Essential amenities in Barboursville that guests expect include: Essentials, TV, Smoke alarm, Air conditioning, Fire extinguisher, Free parking on premises, Heating, Kitchen. Lacking these (any) could significantly impact bookings.
- Popular amenities like Wifi, Dishes and silverware are common but not universal. Offering these can provide a competitive edge.
- Warning: Wifi is not universally provided but is considered essential globally. Ensure reliable Wifi is offered.
Recommendations for Hosts
- Ensure your listing includes all essential amenities for Barboursville: Essentials, TV, Smoke alarm, Air conditioning, Fire extinguisher, Free parking on premises, Heating, Kitchen.
- Consider adding popular differentiators like Wifi or Dishes and silverware to increase appeal.
- Highlight unique or less common amenities you offer (e.g., hot tub, dedicated workspace, EV charger) in your listing description and photos.
- Regularly check competitor amenities in Barboursville to stay competitive.
Barboursville Airbnb Guest Demographics & Profile Analysis (2025)
Guest Profile Summary for Barboursville
- The typical guest profile for Airbnb in Barboursville consists of primarily domestic travelers (92%), often arriving from nearby Washington, typically belonging to the Post-2000s (Gen Z/Alpha) group (50%), primarily speaking English or Spanish.
- Domestic travelers account for 92.0% of guests.
- Key international markets include United States (92%) and DC (5.7%).
- Top languages spoken are English (75.3%) followed by Spanish (12.9%).
- A significant demographic segment is the Post-2000s (Gen Z/Alpha) group, representing 50% of guests.
Recommendations for Hosts
- Target domestic marketing efforts towards travelers from Washington and Richmond.
- Tailor amenities and listing descriptions to appeal to the dominant Post-2000s (Gen Z/Alpha) demographic (e.g., highlight fast WiFi, smart home features, local guides).
- Highlight unique local experiences or amenities relevant to the primary guest profile.
- Consider seasonal promotions aligned with peak travel times for key origin markets.
Nearby Short-Term Rental Market Comparison
How does the Barboursville Airbnb market stack up against its neighbors? Compare key performance metrics like average monthly revenue, ADR, and occupancy rates in surrounding areas to understand the broader regional STR landscape.
| Market | Active Properties | Monthly Revenue | Daily Rate | Avg. Occupancy |
|---|---|---|---|---|
| Castleton | 10 | $6,397 | $531.41 | 38% |
| Bentonville | 23 | $5,267 | $394.63 | 52% |
| Shannondale | 50 | $4,738 | $315.11 | 54% |
| Skyland Estates | 14 | $4,519 | $255.64 | 60% |
| Middleburg | 42 | $4,221 | $520.12 | 39% |
| Shenandoah Shores | 15 | $4,198 | $406.69 | 43% |
| Penhook | 19 | $4,147 | $561.34 | 37% |
| Afton | 137 | $4,130 | $349.42 | 41% |
| Nellysford | 70 | $4,099 | $389.04 | 38% |
| Pimmit Hills | 12 | $4,098 | $252.38 | 58% |