Bakersfield Airbnb Market Analysis 2025: Short Term Rental Data & Vacation Rental Statistics in Vermont, United States
Is Airbnb profitable in Bakersfield in 2025? Explore comprehensive Airbnb analytics for Bakersfield, Vermont, United States to uncover income potential. This 2025 STR market report for Bakersfield, based on AirROI data from April 2024 to March 2025, reveals key trends in the niche market of 18 active listings.
Whether you're considering an Airbnb investment in Bakersfield, optimizing your existing vacation rental, or exploring rental arbitrage opportunities, understanding the Bakersfield Airbnb data is crucial. Understanding the local regulations is key to maximizing your short term rental income potential. Let's dive into the specifics.
Key Bakersfield Airbnb Performance Metrics Overview
Monthly Airbnb Revenue Variations & Income Potential in Bakersfield (2025)
Understanding the monthly revenue variations for Airbnb listings in Bakersfield is key to maximizing your short term rental income potential. Seasonality significantly impacts earnings. Our analysis, based on data from the past 12 months, shows that the peak revenue month for STRs in Bakersfield is typically June, while October often presents the lowest earnings, highlighting opportunities for strategic pricing adjustments during shoulder and low seasons. Explore the typical Airbnb income in Bakersfield across different performance tiers:
- Best-in-class properties (Top 10%) achieve $5,798+ monthly, often utilizing dynamic pricing and superior guest experiences.
- Strong performing properties (Top 25%) earn $4,456 or more, indicating effective management and desirable locations/amenities.
- Typical properties (Median) generate around $2,506 per month, representing the average market performance.
- Entry-level properties (Bottom 25%) see earnings around $1,377, often with potential for optimization.
Average Monthly Airbnb Earnings Trend in Bakersfield
Bakersfield Airbnb Occupancy Rate Trends (2025)
Maximize your bookings by understanding the Bakersfield STR occupancy trends. Seasonal demand shifts significantly influence how often properties are booked. Typically, Junesees the highest demand (peak season occupancy), while March experiences the lowest (low season). Effective strategies, like adjusting minimum stays or offering promotions, can boost occupancy during slower periods. Here's how different property tiers perform in Bakersfield:
- Best-in-class properties (Top 10%) achieve 78%+ occupancy, indicating high desirability and potentially optimized availability.
- Strong performing properties (Top 25%) maintain 60% or higher occupancy, suggesting good market fit and guest satisfaction.
- Typical properties (Median) have an occupancy rate around 39%.
- Entry-level properties (Bottom 25%) average 21% occupancy, potentially facing higher vacancy.
Average Monthly Occupancy Rate Trend in Bakersfield
Average Daily Rate (ADR) Airbnb Trends in Bakersfield (2025)
Effective short term rental pricing strategy in Bakersfield involves understanding monthly ADR fluctuations. The Average Daily Rate (ADR) for Airbnb in Bakersfield typically peaks in August and dips lowest during November. Leveraging Airbnb dynamic pricing tools or strategies based on this seasonality can significantly boost revenue. Here's a look at the typical nightly rates achieved:
- Best-in-class properties (Top 10%) command rates of $262+ per night, often due to premium features or locations.
- Strong performing properties (Top 25%) achieve nightly rates of $215 or more.
- Typical properties (Median) charge around $159 per night.
- Entry-level properties (Bottom 25%) earn around $119 per night.
Average Daily Rate (ADR) Trend by Month in Bakersfield
Get Live Bakersfield Market Intelligence 👇

Explore Real-time Analytics
Airbnb Seasonality Analysis & Trends in Bakersfield (2025)
Peak Season (June, May, December)
- Revenue averages $4,063 per month
- Occupancy rates average 54.7%
- Daily rates average $177
Shoulder Season
- Revenue averages $2,921 per month
- Occupancy maintains around 43.3%
- Daily rates hold near $177
Low Season (February, March, October)
- Revenue drops to average $2,112 per month
- Occupancy decreases to average 33.1%
- Daily rates adjust to average $169
Seasonality Insights for Bakersfield
- The Airbnb seasonality in Bakersfield shows highly seasonal trends requiring careful strategy. While the sections above show seasonal averages, it's also insightful to look at the extremes:
- During the high season, the absolute peak month showcases Bakersfield's highest earning potential, with monthly revenues capable of climbing to $4,568, occupancy reaching a high of 57.5%, and ADRs peaking at $187.
- Conversely, the slowest single month of the year, typically falling within the low season, marks the market's lowest point. In this month, revenue might dip to $1,994, occupancy could drop to 32.3%, and ADRs may adjust down to $160.
- Understanding both the seasonal averages and these monthly peaks and troughs in revenue, occupancy, and ADR is crucial for maximizing your Airbnb profit potential in Bakersfield.
Seasonal Strategies for Maximizing Profit
- Peak Season: Maximize revenue through premium pricing and potentially longer minimum stays. Ensure high availability.
- Low Season: Offer competitive pricing, special promotions (e.g., extended stay discounts), and flexible cancellation policies. Target off-season travelers like remote workers or budget-conscious guests.
- Shoulder Seasons: Implement dynamic pricing that balances peak and low rates. Target weekend travelers or specific events. Offer slightly more flexible terms than peak season.
- Regularly analyze your own performance against these Bakersfield seasonality benchmarks and adjust your pricing and availability strategy accordingly.
Best Areas for Airbnb Investment in Bakersfield (2025)
Exploring the top neighborhoods for short-term rentals in Bakersfield? This section highlights key areas, outlining why they are attractive for hosts and guests, along with notable local attractions. Consider these locations based on your target guest profile and investment strategy.
| Neighborhood / Area | Why Host Here? (Target Guests & Appeal) | Key Attractions & Landmarks |
|---|---|---|
| Downtown Bakersfield | The heart of Bakersfield, offering a vibrant mix of dining, entertainment, and cultural attractions. Great for visitors seeking a central location to explore the city. | Fox Theater, Bakersfield Museum of Art, Mill Creek Park, The Padre Hotel, Buck Owens' Crystal Palace |
| Bakersfield College Area | Popular among students and families, this area provides close proximity to Bakersfield College and local amenities, making it ideal for longer-term stays. | Bakersfield College, The Kern River, Kern County Fairgrounds, local cafes and shops |
| Westside Bakersfield | Residential neighborhoods with easy access to parks and recreational areas. Attracts families and outdoor enthusiasts looking for a relaxed atmosphere. | California Living Museum, Hart Park, Kern River Parkway Trail |
| Northeast Bakersfield | This growing area features quiet neighborhoods with easy access to major highways and shopping centers, appealing for both short and long-term stays. | The Marketplace, Haggin Oaks Golf Course, No. 1 Fire Station Park |
| Northwest Bakersfield | Home to many parks and family-friendly activities, this area is ideal for those looking to enjoy the outdoor attractions Bakersfield has to offer. | Riverwalk Park, Kern River, Bakersfield Ice Sports Center |
| Southwest Bakersfield | A suburban area with a mix of residential housing and shopping districts, making it great for both locals and visitors. Offers convenient access to various amenities. | The Shops at Riverwalk, Cal State Bakersfield, local parks and recreation areas |
| South Bakersfield | This area provides easy access to agricultural attractions and a more rural setting, appealing to guests looking for a unique and authentic experience. | Buck Owens' Crystal Palace, Kern County Raceway Park, local farms and markets |
| Tehachapi | While not in Bakersfield proper, Tehachapi is nearby and offers beautiful mountain scenery and outdoor activities. Ideal for guests wanting a nature getaway. | Tehachapi Mountain Park, Goldwell Open Air Museum, Tehachapi Loop, local wineries |
Understanding Airbnb License Requirements & STR Laws in Bakersfield (2025)
With 11% of listings showing registration in 2025, understanding potential Airbnb license requirements is crucial in Bakersfield. Always verify the latest short term rental regulations and Airbnb license requirements directly with local government authorities for Bakersfield to ensure full compliance before hosting.
(Source: AirROI data, 2025, based on 11% licensed listings)
Top Performing Airbnb Properties in Bakersfield (2025)
Benchmark your potential! Explore examples of top-performing Airbnb properties in Bakersfieldbased on Trailing Twelve Month (TTM) revenue. Analyze their characteristics, revenue, occupancy rate, and ADR to understand what drives success in this market.
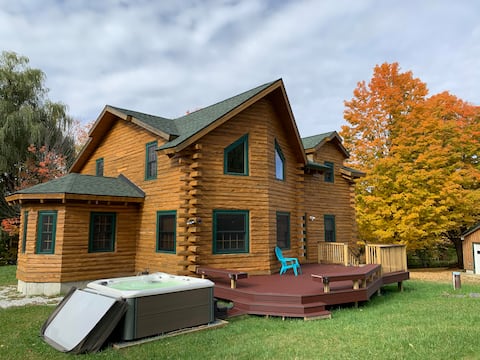
Modern 3-BD Mountain Cabin w/ Hot Tub, Deck, Loft
Entire Place • 3 bedrooms

Cozy, Modern Yurt w/ Wi-fi, Hot Tub & Mtn. Views
Entire Place • 1 bedroom

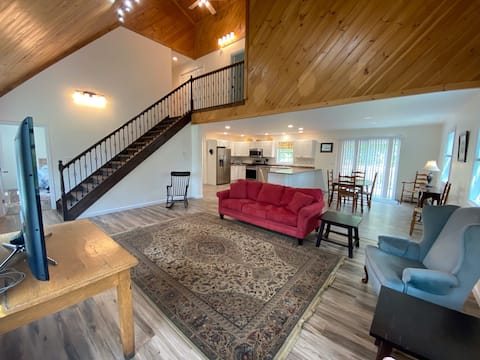
Modern Vermont Cabin on 40 Acres
Entire Place • 3 bedrooms
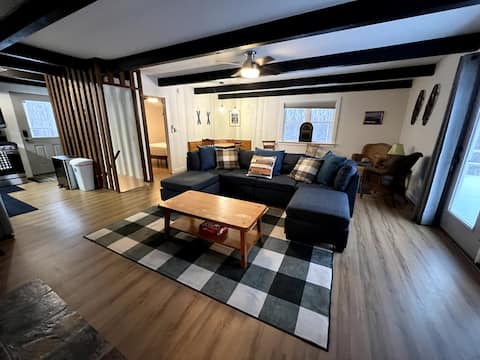
Beautiful home in rural Vermont
Entire Place • 2 bedrooms
Sweet Escape: Cozy Cabin with Mountain View’s
Entire Place • 1 bedroom
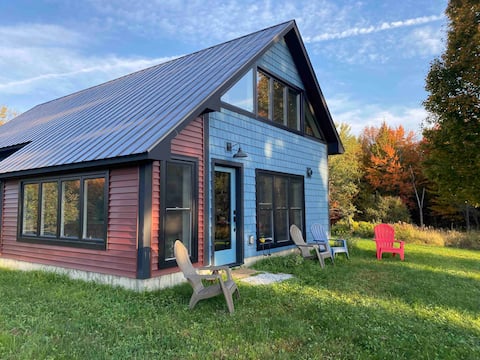
Newly built cottage on eco-farm
Entire Place • 2 bedrooms
Note: Performance varies based on location, size, amenities, seasonality, and management quality. Data reflects the past 12 months.
Top Performing Airbnb Hosts in Bakersfield (2025)
Learn from the best! This table showcases top-performing Airbnb hosts in Bakersfield based on the number of properties managed and estimated total revenue over the past year. Analyze their scale and performance metrics.
| Host Name | Properties | Grossing Revenue | Stay Reviews | Avg Rating |
|---|---|---|---|---|
| Mary | 1 | $61,823 | 73 | 4.86/5.0 |
| Jennah | 1 | $58,465 | 92 | 4.98/5.0 |
| John | 1 | $55,628 | 123 | 4.92/5.0 |
| Jennifer | 1 | $36,280 | 14 | 4.64/5.0 |
| Cecile | 1 | $30,392 | 7 | 5.00/5.0 |
| Heather | 1 | $28,341 | 29 | 4.97/5.0 |
| Robin | 1 | $25,819 | 149 | 4.91/5.0 |
| Host #240078487 | 6 | $18,411 | 0 | 0.00/5.0 |
| Paul And Nancy | 1 | $3,657 | 76 | 4.97/5.0 |
| Host #111817270 | 3 | $3,113 | 0 | 0.00/5.0 |
Analyzing the strategies of top hosts, such as their property selection, pricing, and guest communication, can offer valuable lessons for optimizing your own Airbnb operations in Bakersfield.
Dive Deeper: Advanced Bakersfield STR Market Data (2025)
Ready to unlock more insights? AirROI provides access to advanced metrics and comprehensive Airbnb data for Bakersfield. Explore detailed analytics beyond this report to refine your investment strategy, optimize pricing, and maximize your vacation rental profits.
Explore Advanced MetricsBakersfield Short-Term Rental Market Composition (2025): Property & Room Types
Room Type Distribution
Property Type Distribution
Market Composition Insights for Bakersfield
- The Bakersfield Airbnb market composition is heavily skewed towards Entire Home/Apt listings, which make up 94.4% of the 18 active rentals. This indicates strong guest preference for privacy and space.
- Looking at the property type distribution in Bakersfield, Apartment/Condo properties are the most common (50%), reflecting the local real estate landscape.
- Houses represent a significant 27.8% portion, catering likely to families or larger groups.
Bakersfield Airbnb Room Capacity Analysis (2025): Bedroom Distribution
Distribution of Listings by Number of Bedrooms
Room Capacity Insights for Bakersfield
- The dominant room capacity in Bakersfield is 2 bedrooms listings, making up 38.9% of the market. This suggests a strong demand for properties suitable for couples or solo travelers.
- Together, 2 bedrooms and 1 bedroom properties represent 72.2% of the active Airbnb listings in Bakersfield, indicating a high concentration in these sizes.
- A significant 27.8% of listings offer 3+ bedrooms, catering to larger groups and families seeking more space in Bakersfield.
Bakersfield Vacation Rental Guest Capacity Trends (2025)
Distribution of Listings by Guest Capacity
Guest Capacity Insights for Bakersfield
- The most common guest capacity trend in Bakersfield vacation rentals is listings accommodating 8+ guests (38.9%). This suggests the primary traveler segment is likely larger groups.
- Properties designed for 8+ guests and 5 guests dominate the Bakersfield STR market, accounting for 66.7% of listings.
- 55.6% of properties accommodate 6+ guests, serving the market segment for larger families or group travel in Bakersfield.
- On average, properties in Bakersfield are equipped to host 6.1 guests.
Bakersfield Airbnb Booking Patterns (2025): Available vs. Booked Days
Available Days Distribution
Booked Days Distribution
Booking Pattern Insights for Bakersfield
- The most common availability pattern in Bakersfield falls within the 271-366 days range, representing 61.1% of listings. This suggests many properties have significant open periods on their calendars.
- Approximately 77.8% of listings show high availability (181+ days open annually), indicating potential for increased bookings or specific owner usage patterns.
- For booked days, the 1-30 days range is most frequent in Bakersfield (61.1%), reflecting common guest stay durations or potential owner blocking patterns.
- A notable 22.2% of properties secure long booking periods (181+ days booked per year), highlighting successful long-term rental strategies or significant owner usage.
Bakersfield Airbnb Minimum Stay Requirements Analysis
Distribution of Listings by Minimum Night Requirement
2 Nights
14 listings
82.4% of total
3 Nights
1 listings
5.9% of total
30+ Nights
2 listings
11.8% of total
Key Insights
- The most prevalent minimum stay requirement in Bakersfield is 2 Nights, adopted by 82.4% of listings. This highlights the market's preference for shorter, flexible bookings.
- A strong majority (82.4%) of the Bakersfield Airbnb data shows acceptance of very short stays (1-2 nights), indicating a dynamic, high-turnover market.
- A significant segment (11.8%) caters to monthly stays (30+ nights) in Bakersfield, pointing to opportunities in the extended-stay market.
Recommendations
- Align with the market by considering a 2 Nights minimum stay, as 82.4% of Bakersfield hosts use this setting.
- A 2-night minimum appears standard (82.4%). Consider this for weekends or peak periods.
- Explore offering discounts for stays of 30+ nights to attract the 11.8% of the market seeking extended stays.
- Adjust minimum nights based on seasonality – potentially shorter during low season and longer during peak demand periods in Bakersfield.
Bakersfield Airbnb Cancellation Policy Trends Analysis (2025)
Flexible
2 listings
22.2% of total
Moderate
3 listings
33.3% of total
Firm
2 listings
22.2% of total
Strict
2 listings
22.2% of total
Cancellation Policy Insights for Bakersfield
- The prevailing Airbnb cancellation policy trend in Bakersfield is Moderate, used by 33.3% of listings.
- There's a relatively balanced mix between guest-friendly (55.5%) and stricter (44.4%) policies, offering choices for different guest needs.
Recommendations for Hosts
- Consider adopting a Moderate policy to align with the 33.3% market standard in Bakersfield.
- Regularly review your cancellation policy against competitors and market demand shifts in Bakersfield.
Bakersfield STR Booking Lead Time Analysis (2025)
Average Booking Lead Time by Month
Booking Lead Time Insights for Bakersfield
- The overall average booking lead time for vacation rentals in Bakersfield is 23 days.
- Guests book furthest in advance for stays during July (average 79 days), likely coinciding with peak travel demand or local events.
- The shortest booking windows occur for stays in September (average 20 days), indicating more last-minute travel plans during this time.
- Seasonally, Spring (54 days avg.) sees the longest lead times, while Fall (31 days avg.) has the shortest, reflecting typical travel planning cycles.
Recommendations for Hosts
- Use the overall average lead time (23 days) as a baseline for your pricing and availability strategy in Bakersfield.
- For July stays, consider implementing length-of-stay discounts or slightly higher rates for bookings made less than 79 days out to capitalize on advance planning.
- Target marketing efforts for the Spring season well in advance (at least 54 days) to capture early planners.
- Monitor your own booking lead times against these Bakersfield averages to identify opportunities for dynamic pricing adjustments.
Popular & Essential Airbnb Amenities in Bakersfield (2025)
Amenity Prevalence
Amenity Insights for Bakersfield
- Essential amenities in Bakersfield that guests expect include: Free parking on premises, Kitchen, Smoke alarm, Wifi, Carbon monoxide alarm, TV, Heating, Essentials, Hot water. Lacking these (any) could significantly impact bookings.
- Popular amenities like Fire extinguisher are common but not universal. Offering these can provide a competitive edge.
Recommendations for Hosts
- Ensure your listing includes all essential amenities for Bakersfield: Free parking on premises, Kitchen, Smoke alarm, Wifi, Carbon monoxide alarm, TV, Heating, Essentials, Hot water.
- Consider adding popular differentiators like Fire extinguisher to increase appeal.
- Highlight unique or less common amenities you offer (e.g., hot tub, dedicated workspace, EV charger) in your listing description and photos.
- Regularly check competitor amenities in Bakersfield to stay competitive.
Bakersfield Airbnb Guest Demographics & Profile Analysis (2025)
Guest Profile Summary for Bakersfield
- The typical guest profile for Airbnb in Bakersfield consists of primarily domestic travelers (92%), often arriving from nearby Boston, typically belonging to the Post-2000s (Gen Z/Alpha) group (50%), primarily speaking English or Spanish.
- Domestic travelers account for 92.0% of guests.
- Key international markets include United States (92%) and Canada (4.6%).
- Top languages spoken are English (65.5%) followed by Spanish (18.2%).
- A significant demographic segment is the Post-2000s (Gen Z/Alpha) group, representing 50% of guests.
Recommendations for Hosts
- Target domestic marketing efforts towards travelers from Boston and New York.
- Tailor amenities and listing descriptions to appeal to the dominant Post-2000s (Gen Z/Alpha) demographic (e.g., highlight fast WiFi, smart home features, local guides).
- Highlight unique local experiences or amenities relevant to the primary guest profile.
- Consider seasonal promotions aligned with peak travel times for key origin markets.
Nearby Short-Term Rental Market Comparison
How does the Bakersfield Airbnb market stack up against its neighbors? Compare key performance metrics like average monthly revenue, ADR, and occupancy rates in surrounding areas to understand the broader regional STR landscape.
| Market | Active Properties | Monthly Revenue | Daily Rate | Avg. Occupancy |
|---|---|---|---|---|
| Middletown Springs | 11 | $8,614 | $550.24 | 36% |
| Pomfret | 13 | $6,142 | $449.79 | 49% |
| Jefferson | 28 | $5,920 | $432.83 | 50% |
| Fort Ann | 27 | $5,803 | $761.44 | 38% |
| Stony Creek | 11 | $5,749 | $484.51 | 43% |
| Hanover | 28 | $5,449 | $863.49 | 39% |
| Middleton | 10 | $5,234 | $321.41 | 50% |
| Malletts Bay | 49 | $4,960 | $414.58 | 48% |
| Cornwall | 20 | $4,774 | $358.42 | 50% |
| Stowe | 842 | $4,757 | $474.92 | 41% |