Joseph Airbnb Market Analysis 2025: Short Term Rental Data & Vacation Rental Statistics in Utah, United States
Is Airbnb profitable in Joseph in 2025? Explore comprehensive Airbnb analytics for Joseph, Utah, United States to uncover income potential. This 2025 STR market report for Joseph, based on AirROI data from April 2024 to March 2025, reveals key trends in the niche market of 17 active listings.
Whether you're considering an Airbnb investment in Joseph, optimizing your existing vacation rental, or exploring rental arbitrage opportunities, understanding the Joseph Airbnb data is crucial. Leveraging the low regulation environment is key to maximizing your short term rental income potential. Let's dive into the specifics.
Key Joseph Airbnb Performance Metrics Overview
Monthly Airbnb Revenue Variations & Income Potential in Joseph (2025)
Understanding the monthly revenue variations for Airbnb listings in Joseph is key to maximizing your short term rental income potential. Seasonality significantly impacts earnings. Our analysis, based on data from the past 12 months, shows that the peak revenue month for STRs in Joseph is typically July, while April often presents the lowest earnings, highlighting opportunities for strategic pricing adjustments during shoulder and low seasons. Explore the typical Airbnb income in Joseph across different performance tiers:
- Best-in-class properties (Top 10%) achieve $2,275+ monthly, often utilizing dynamic pricing and superior guest experiences.
- Strong performing properties (Top 25%) earn $1,368 or more, indicating effective management and desirable locations/amenities.
- Typical properties (Median) generate around $852 per month, representing the average market performance.
- Entry-level properties (Bottom 25%) see earnings around $467, often with potential for optimization.
Average Monthly Airbnb Earnings Trend in Joseph
Joseph Airbnb Occupancy Rate Trends (2025)
Maximize your bookings by understanding the Joseph STR occupancy trends. Seasonal demand shifts significantly influence how often properties are booked. Typically, Julysees the highest demand (peak season occupancy), while January experiences the lowest (low season). Effective strategies, like adjusting minimum stays or offering promotions, can boost occupancy during slower periods. Here's how different property tiers perform in Joseph:
- Best-in-class properties (Top 10%) achieve 58%+ occupancy, indicating high desirability and potentially optimized availability.
- Strong performing properties (Top 25%) maintain 45% or higher occupancy, suggesting good market fit and guest satisfaction.
- Typical properties (Median) have an occupancy rate around 34%.
- Entry-level properties (Bottom 25%) average 20% occupancy, potentially facing higher vacancy.
Average Monthly Occupancy Rate Trend in Joseph
Average Daily Rate (ADR) Airbnb Trends in Joseph (2025)
Effective short term rental pricing strategy in Joseph involves understanding monthly ADR fluctuations. The Average Daily Rate (ADR) for Airbnb in Joseph typically peaks in January and dips lowest during April. Leveraging Airbnb dynamic pricing tools or strategies based on this seasonality can significantly boost revenue. Here's a look at the typical nightly rates achieved:
- Best-in-class properties (Top 10%) command rates of $147+ per night, often due to premium features or locations.
- Strong performing properties (Top 25%) achieve nightly rates of $94 or more.
- Typical properties (Median) charge around $80 per night.
- Entry-level properties (Bottom 25%) earn around $58 per night.
Average Daily Rate (ADR) Trend by Month in Joseph
Get Live Joseph Market Intelligence 👇

Explore Real-time Analytics
Airbnb Seasonality Analysis & Trends in Joseph (2025)
Peak Season (July, October, June)
- Revenue averages $1,356 per month
- Occupancy rates average 45.3%
- Daily rates average $92
Shoulder Season
- Revenue averages $1,130 per month
- Occupancy maintains around 32.5%
- Daily rates hold near $101
Low Season (January, April, August)
- Revenue drops to average $870 per month
- Occupancy decreases to average 25.3%
- Daily rates adjust to average $96
Seasonality Insights for Joseph
- The Airbnb seasonality in Joseph shows moderate seasonality with distinct peak and low periods. While the sections above show seasonal averages, it's also insightful to look at the extremes:
- During the high season, the absolute peak month showcases Joseph's highest earning potential, with monthly revenues capable of climbing to $1,389, occupancy reaching a high of 47.6%, and ADRs peaking at $114.
- Conversely, the slowest single month of the year, typically falling within the low season, marks the market's lowest point. In this month, revenue might dip to $756, occupancy could drop to 21.7%, and ADRs may adjust down to $84.
- Understanding both the seasonal averages and these monthly peaks and troughs in revenue, occupancy, and ADR is crucial for maximizing your Airbnb profit potential in Joseph.
Seasonal Strategies for Maximizing Profit
- Peak Season: Maximize revenue through premium pricing and potentially longer minimum stays. Ensure high availability.
- Low Season: Offer competitive pricing, special promotions (e.g., extended stay discounts), and flexible cancellation policies. Target off-season travelers like remote workers or budget-conscious guests.
- Shoulder Seasons: Implement dynamic pricing that balances peak and low rates. Target weekend travelers or specific events. Offer slightly more flexible terms than peak season.
- Regularly analyze your own performance against these Joseph seasonality benchmarks and adjust your pricing and availability strategy accordingly.
Best Areas for Airbnb Investment in Joseph (2025)
Exploring the top neighborhoods for short-term rentals in Joseph? This section highlights key areas, outlining why they are attractive for hosts and guests, along with notable local attractions. Consider these locations based on your target guest profile and investment strategy.
| Neighborhood / Area | Why Host Here? (Target Guests & Appeal) | Key Attractions & Landmarks |
|---|---|---|
| Bear Lake | A popular vacation destination known for its stunning blue waters and recreational activities. It's ideal for families and water enthusiasts looking for summer and winter activities. | Bear Lake State Park, Marina, Bear Lake National Wildlife Refuge, Garden City Beach, North Beach |
| Zion National Park | One of the most famous national parks in the US, Zion attracts nature lovers and adventure seekers. Perfect for hosting guests who want to explore its stunning landscapes and hiking trails. | Angels Landing, The Narrows, Zion Canyon Scenic Drive, The Grotto, Zion Mount Carmel Highway |
| Park City | Renowned for its ski resorts and summer activities, Park City is a prime location for year-round tourism, catering to both winter sports enthusiasts and summer vacationers. | Park City Mountain Resort, Main Street, Deer Valley Resort, Sundance Film Festival, Utah Olympic Park |
| Lake Powell | Famous for its breathtaking scenery and water activities, Lake Powell is popular with boating and fishing enthusiasts. It's a great destination for guests seeking outdoor adventures. | Antelope Canyon, Rainbow Bridge, Glen Canyon Dam, Lake Powell Boat Rentals, Hiking Trails |
| Arches National Park | Known for its natural stone arches and stunning landscapes, this park attracts hiking and outdoor adventure lovers looking for a unique experience. | Delicate Arch, Devils Garden, Landscape Arch, Fiery Furnace, Park Avenue |
| Snowbird | A ski resort known for its beautiful mountain views and outdoor activities year-round. This location is ideal for guests seeking adventure in both winter and summer. | Snowbird Aerial Tram, Alpine Slides, Hiking Trails, Skiing and Snowboarding, Birdwatching |
| Cedar City | A cultural hub with access to several national parks. Cedar City hosts events and festivals, making it a great location for visitors looking for local culture and outdoor activities. | Utah Shakespeare Festival, Cedar Breaks National Monument, Southern Utah Museum of Art, Festival City USA, Iron Mission State Park |
| Moab | A gateway to both Arches and Canyonlands National Parks, Moab is perfect for outdoor enthusiasts who want to experience hiking, biking, and stunning landscapes. | Arches National Park, Canyonlands National Park, Moab Jeep Trails, Dead Horse Point State Park, Mountain Biking Trails |
Understanding Airbnb License Requirements & STR Laws in Joseph (2025)
While Joseph, Utah, United States currently shows low STR regulations, specific Airbnb license requirements might still exist or change. Always verify the latest short term rental regulations and Airbnb license requirements directly with local government authorities for Joseph to ensure full compliance before hosting.
(Source: AirROI data, 2025, finding no licensed listings among those analyzed)
Top Performing Airbnb Properties in Joseph (2025)
Benchmark your potential! Explore examples of top-performing Airbnb properties in Josephbased on Trailing Twelve Month (TTM) revenue. Analyze their characteristics, revenue, occupancy rate, and ADR to understand what drives success in this market.
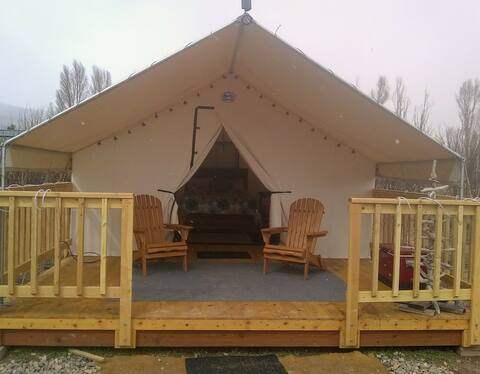
Wildland Takeover Main House/5 Glamp tents/2Cabins
Entire Place • 9 bedrooms

Country Pineapple Retreat - C.P.R. For your soul.
Entire Place • 4 bedrooms
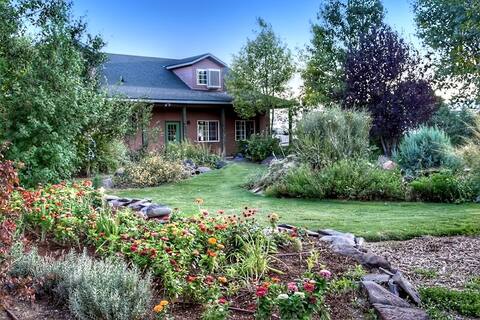
Wildland Gardens Farm Guest House w/Private Hottub
Entire Place • 2 bedrooms

Home Base Resort #6
Entire Place • 2 bedrooms
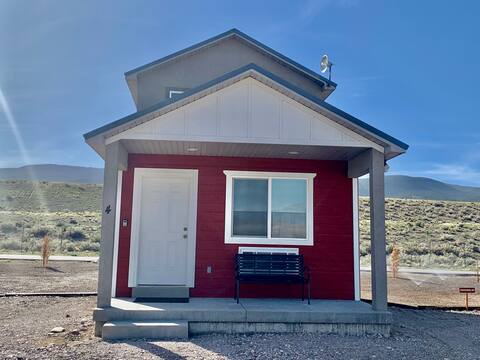
Home Base Resort #4
Entire Place • 2 bedrooms

Home Base Resort #7
Entire Place • 2 bedrooms
Note: Performance varies based on location, size, amenities, seasonality, and management quality. Data reflects the past 12 months.
Top Performing Airbnb Hosts in Joseph (2025)
Learn from the best! This table showcases top-performing Airbnb hosts in Joseph based on the number of properties managed and estimated total revenue over the past year. Analyze their scale and performance metrics.
| Host Name | Properties | Grossing Revenue | Stay Reviews | Avg Rating |
|---|---|---|---|---|
| Carrie & Mike | 8 | $86,241 | 2467 | 4.87/5.0 |
| Shane | 7 | $84,570 | 1369 | 4.93/5.0 |
| Rebecca | 1 | $28,446 | 89 | 4.93/5.0 |
| Marianne | 1 | $11,965 | 13 | 4.77/5.0 |
Analyzing the strategies of top hosts, such as their property selection, pricing, and guest communication, can offer valuable lessons for optimizing your own Airbnb operations in Joseph.
Dive Deeper: Advanced Joseph STR Market Data (2025)
Ready to unlock more insights? AirROI provides access to advanced metrics and comprehensive Airbnb data for Joseph. Explore detailed analytics beyond this report to refine your investment strategy, optimize pricing, and maximize your vacation rental profits.
Explore Advanced MetricsJoseph Short-Term Rental Market Composition (2025): Property & Room Types
Room Type Distribution
Property Type Distribution
Market Composition Insights for Joseph
- The Joseph Airbnb market composition is heavily skewed towards Entire Home/Apt listings, which make up 100% of the 17 active rentals. This indicates strong guest preference for privacy and space.
- Looking at the property type distribution in Joseph, House properties are the most common (52.9%), reflecting the local real estate landscape.
- Houses represent a significant 52.9% portion, catering likely to families or larger groups.
Joseph Airbnb Room Capacity Analysis (2025): Bedroom Distribution
Distribution of Listings by Number of Bedrooms
Room Capacity Insights for Joseph
- The dominant room capacity in Joseph is 1 bedroom listings, making up 29.4% of the market. This suggests a strong demand for properties suitable for couples or solo travelers.
- Together, 1 bedroom and 2 bedrooms properties represent 58.8% of the active Airbnb listings in Joseph, indicating a high concentration in these sizes.
Joseph Vacation Rental Guest Capacity Trends (2025)
Distribution of Listings by Guest Capacity
Guest Capacity Insights for Joseph
- The most common guest capacity trend in Joseph vacation rentals is listings accommodating 4 guests (35.3%). This suggests the primary traveler segment is likely small families or groups.
- Properties designed for 4 guests and 6 guests dominate the Joseph STR market, accounting for 52.9% of listings.
- 35.2% of properties accommodate 6+ guests, serving the market segment for larger families or group travel in Joseph.
- On average, properties in Joseph are equipped to host 4.9 guests.
Joseph Airbnb Booking Patterns (2025): Available vs. Booked Days
Available Days Distribution
Booked Days Distribution
Booking Pattern Insights for Joseph
- The most common availability pattern in Joseph falls within the 181-270 days range, representing 64.7% of listings. This suggests many properties have significant open periods on their calendars.
- Approximately 94.1% of listings show high availability (181+ days open annually), indicating potential for increased bookings or specific owner usage patterns.
- For booked days, the 91-180 days range is most frequent in Joseph (64.7%), reflecting common guest stay durations or potential owner blocking patterns.
- A notable 5.9% of properties secure long booking periods (181+ days booked per year), highlighting successful long-term rental strategies or significant owner usage.
Joseph Airbnb Minimum Stay Requirements Analysis
Distribution of Listings by Minimum Night Requirement
1 Night
17 listings
100% of total
Key Insights
- The most prevalent minimum stay requirement in Joseph is 1 Night, adopted by 100% of listings. This highlights the market's preference for shorter, flexible bookings.
- A strong majority (100.0%) of the Joseph Airbnb data shows acceptance of very short stays (1-2 nights), indicating a dynamic, high-turnover market.
Recommendations
- Align with the market by considering a 1 Night minimum stay, as 100% of Joseph hosts use this setting.
- Adjust minimum nights based on seasonality – potentially shorter during low season and longer during peak demand periods in Joseph.
Joseph Airbnb Cancellation Policy Trends Analysis (2025)
Flexible
3 listings
17.6% of total
Moderate
11 listings
64.7% of total
Firm
1 listings
5.9% of total
Strict
2 listings
11.8% of total
Cancellation Policy Insights for Joseph
- The prevailing Airbnb cancellation policy trend in Joseph is Moderate, used by 64.7% of listings.
- The market strongly favors guest-friendly terms, with 82.3% of listings offering Flexible or Moderate policies. This suggests guests in Joseph may expect booking flexibility.
Recommendations for Hosts
- Consider adopting a Moderate policy to align with the 64.7% market standard in Joseph.
- Using a Strict policy might deter some guests, as only 11.8% of listings use it. Evaluate if potential revenue protection outweighs possible lower booking rates.
- Regularly review your cancellation policy against competitors and market demand shifts in Joseph.
Joseph STR Booking Lead Time Analysis (2025)
Average Booking Lead Time by Month
Booking Lead Time Insights for Joseph
- The overall average booking lead time for vacation rentals in Joseph is 38 days.
- Guests book furthest in advance for stays during June (average 69 days), likely coinciding with peak travel demand or local events.
- The shortest booking windows occur for stays in February (average 13 days), indicating more last-minute travel plans during this time.
- Seasonally, Summer (56 days avg.) sees the longest lead times, while Winter (15 days avg.) has the shortest, reflecting typical travel planning cycles.
Recommendations for Hosts
- Use the overall average lead time (38 days) as a baseline for your pricing and availability strategy in Joseph.
- For June stays, consider implementing length-of-stay discounts or slightly higher rates for bookings made less than 69 days out to capitalize on advance planning.
- During February, focus on last-minute booking availability and promotions, as guests book with very short notice (13 days avg.).
- Target marketing efforts for the Summer season well in advance (at least 56 days) to capture early planners.
- Monitor your own booking lead times against these Joseph averages to identify opportunities for dynamic pricing adjustments.
Popular & Essential Airbnb Amenities in Joseph (2025)
Amenity Prevalence
Amenity Insights for Joseph
- Essential amenities in Joseph that guests expect include: Heating, Free parking on premises. Lacking these (any) could significantly impact bookings.
- Popular amenities like Essentials, Smoke alarm, Dishes and silverware are common but not universal. Offering these can provide a competitive edge.
- Warning: Wifi is not universally provided but is considered essential globally. Ensure reliable Wifi is offered.
Recommendations for Hosts
- Ensure your listing includes all essential amenities for Joseph: Heating, Free parking on premises.
- Consider adding popular differentiators like Essentials or Smoke alarm to increase appeal.
- Highlight unique or less common amenities you offer (e.g., hot tub, dedicated workspace, EV charger) in your listing description and photos.
- Regularly check competitor amenities in Joseph to stay competitive.
Joseph Airbnb Guest Demographics & Profile Analysis (2025)
Guest Profile Summary for Joseph
- The typical guest profile for Airbnb in Joseph consists of primarily domestic travelers (97%), often arriving from nearby Salt Lake City, typically belonging to the Post-2000s (Gen Z/Alpha) group (50%), primarily speaking English or Spanish.
- Domestic travelers account for 97.0% of guests.
- Key international markets include United States (97%) and Canada (1.1%).
- Top languages spoken are English (68.8%) followed by Spanish (14.6%).
- A significant demographic segment is the Post-2000s (Gen Z/Alpha) group, representing 50% of guests.
Recommendations for Hosts
- Target domestic marketing efforts towards travelers from Salt Lake City and Los Angeles.
- Tailor amenities and listing descriptions to appeal to the dominant Post-2000s (Gen Z/Alpha) demographic (e.g., highlight fast WiFi, smart home features, local guides).
- Highlight unique local experiences or amenities relevant to the primary guest profile.
- Consider seasonal promotions aligned with peak travel times for key origin markets.
Nearby Short-Term Rental Market Comparison
How does the Joseph Airbnb market stack up against its neighbors? Compare key performance metrics like average monthly revenue, ADR, and occupancy rates in surrounding areas to understand the broader regional STR landscape.
| Market | Active Properties | Monthly Revenue | Daily Rate | Avg. Occupancy |
|---|---|---|---|---|
| Springdale | 132 | $5,232 | $429.43 | 49% |
| Hurricane | 646 | $3,943 | $303.19 | 46% |
| Rockville | 22 | $3,622 | $410.84 | 41% |
| Santa Clara | 258 | $3,274 | $369.69 | 36% |
| Ivins | 99 | $3,256 | $332.65 | 43% |
| Orderville | 242 | $3,192 | $293.01 | 40% |
| Torrey | 86 | $3,063 | $219.24 | 53% |
| Duck Creek Village | 228 | $3,045 | $258.57 | 41% |
| Teasdale | 30 | $3,012 | $228.77 | 50% |
| Washington | 698 | $2,900 | $252.16 | 40% |