Webster Airbnb Market Analysis 2025: Short Term Rental Data & Vacation Rental Statistics in Texas, United States
Is Airbnb profitable in Webster in 2025? Explore comprehensive Airbnb analytics for Webster, Texas, United States to uncover income potential. This 2025 STR market report for Webster, based on AirROI data from June 2024 to May 2025, reveals key trends in the niche market of 19 active listings.
Whether you're considering an Airbnb investment in Webster, optimizing your existing vacation rental, or exploring rental arbitrage opportunities, understanding the Webster Airbnb data is crucial. Leveraging the low regulation environment is key to maximizing your short term rental income potential. Let's dive into the specifics.
Key Webster Airbnb Performance Metrics Overview
Monthly Airbnb Revenue Variations & Income Potential in Webster (2025)
Understanding the monthly revenue variations for Airbnb listings in Webster is key to maximizing your short term rental income potential. Seasonality significantly impacts earnings. Our analysis, based on data from the past 12 months, shows that the peak revenue month for STRs in Webster is typically April, while June often presents the lowest earnings, highlighting opportunities for strategic pricing adjustments during shoulder and low seasons. Explore the typical Airbnb income in Webster across different performance tiers:
- Best-in-class properties (Top 10%) achieve $6,896+ monthly, often utilizing dynamic pricing and superior guest experiences.
- Strong performing properties (Top 25%) earn $3,458 or more, indicating effective management and desirable locations/amenities.
- Typical properties (Median) generate around $1,407 per month, representing the average market performance.
- Entry-level properties (Bottom 25%) see earnings around $716, often with potential for optimization.
Average Monthly Airbnb Earnings Trend in Webster
Webster Airbnb Occupancy Rate Trends (2025)
Maximize your bookings by understanding the Webster STR occupancy trends. Seasonal demand shifts significantly influence how often properties are booked. Typically, Julysees the highest demand (peak season occupancy), while June experiences the lowest (low season). Effective strategies, like adjusting minimum stays or offering promotions, can boost occupancy during slower periods. Here's how different property tiers perform in Webster:
- Best-in-class properties (Top 10%) achieve 79%+ occupancy, indicating high desirability and potentially optimized availability.
- Strong performing properties (Top 25%) maintain 63% or higher occupancy, suggesting good market fit and guest satisfaction.
- Typical properties (Median) have an occupancy rate around 36%.
- Entry-level properties (Bottom 25%) average 20% occupancy, potentially facing higher vacancy.
Average Monthly Occupancy Rate Trend in Webster
Average Daily Rate (ADR) Airbnb Trends in Webster (2025)
Effective short term rental pricing strategy in Webster involves understanding monthly ADR fluctuations. The Average Daily Rate (ADR) for Airbnb in Webster typically peaks in May and dips lowest during November. Leveraging Airbnb dynamic pricing tools or strategies based on this seasonality can significantly boost revenue. Here's a look at the typical nightly rates achieved:
- Best-in-class properties (Top 10%) command rates of $323+ per night, often due to premium features or locations.
- Strong performing properties (Top 25%) achieve nightly rates of $197 or more.
- Typical properties (Median) charge around $122 per night.
- Entry-level properties (Bottom 25%) earn around $75 per night.
Average Daily Rate (ADR) Trend by Month in Webster
Get Live Webster Market Intelligence 👇

Explore Real-time Analytics
Airbnb Seasonality Analysis & Trends in Webster (2025)
Peak Season (April, July, March)
- Revenue averages $3,190 per month
- Occupancy rates average 46.0%
- Daily rates average $185
Shoulder Season
- Revenue averages $2,679 per month
- Occupancy maintains around 42.3%
- Daily rates hold near $174
Low Season (June, September, October)
- Revenue drops to average $2,039 per month
- Occupancy decreases to average 37.9%
- Daily rates adjust to average $143
Seasonality Insights for Webster
- The Airbnb seasonality in Webster shows highly seasonal trends requiring careful strategy. While the sections above show seasonal averages, it's also insightful to look at the extremes:
- During the high season, the absolute peak month showcases Webster's highest earning potential, with monthly revenues capable of climbing to $3,596, occupancy reaching a high of 54.7%, and ADRs peaking at $216.
- Conversely, the slowest single month of the year, typically falling within the low season, marks the market's lowest point. In this month, revenue might dip to $1,693, occupancy could drop to 24.6%, and ADRs may adjust down to $143.
- Understanding both the seasonal averages and these monthly peaks and troughs in revenue, occupancy, and ADR is crucial for maximizing your Airbnb profit potential in Webster.
Seasonal Strategies for Maximizing Profit
- Peak Season: Maximize revenue through premium pricing and potentially longer minimum stays. Ensure high availability.
- Low Season: Offer competitive pricing, special promotions (e.g., extended stay discounts), and flexible cancellation policies. Target off-season travelers like remote workers or budget-conscious guests.
- Shoulder Seasons: Implement dynamic pricing that balances peak and low rates. Target weekend travelers or specific events. Offer slightly more flexible terms than peak season.
- Regularly analyze your own performance against these Webster seasonality benchmarks and adjust your pricing and availability strategy accordingly.
Best Areas for Airbnb Investment in Webster (2025)
Exploring the top neighborhoods for short-term rentals in Webster? This section highlights key areas, outlining why they are attractive for hosts and guests, along with notable local attractions. Consider these locations based on your target guest profile and investment strategy.
| Neighborhood / Area | Why Host Here? (Target Guests & Appeal) | Key Attractions & Landmarks |
|---|---|---|
| Clear Lake | Popular for its proximity to the Johnson Space Center and a variety of outdoor activities on Clear Lake. Ideal for families and tourists interested in space exploration. | Space Center Houston, Clear Lake Park, Waterfront restaurants, NASA Johnson Space Center, Baybrook Mall |
| Webster Downtown | The heart of Webster, featuring charming shops and restaurants. Great for visitors who want a local experience and easy access to nearby attractions. | Webster Town Center, Parks and Recreational areas, Local eateries, Farmers Market, Community events |
| Parks of Bay Area | A suburban area featuring well-maintained parks and close-knit community vibes. Suitable for families and longer stays. | Mary’s Creek Park, Webster Recreation Center, Local playgrounds, Nature trails, Bay Area Park |
| Houston Spaceport | This emerging area close to the Houston Spaceport is looking to attract business travelers and those attending events related to aerospace. | Houston Spaceport, Business incubators, Aerospace events, Close proximity to industry leaders, Meeting facilities |
| Baybrook Mall Area | Area around one of the largest malls in the region, it's a shopping haven for locals and visitors. Great access to dining and entertainment. | Baybrook Mall, Shops at Baybrook, Movie theaters, Diverse dining options, Entertainment complexes |
| Eagle Point | A peaceful neighborhood with natural surroundings, appealing to tourists looking for tranquility and outdoor activities. | Eagle Point Park, Nature parks, Boating and fishing activities, Scenic spots, Outdoor BBQ areas |
| Nassau Bay | Located a short drive away from Webster, this area offers great access to the waterfront, making it attractive to boaters and water enthusiasts. | Nassau Bay Marina, Eagle Point Park, Nearby beaches, Watersport rentals, Outdoor dining options |
| League City | Just south of Webster, League City features a mix of suburban lifestyle with attractions like parks and family-friendly activities. | Helen's Garden, League City Historical Society, Parks and recreational areas, Shopping centers, Local festivals |
Understanding Airbnb License Requirements & STR Laws in Webster (2025)
While Webster, Texas, United States currently shows low STR regulations, specific Airbnb license requirements might still exist or change. Always verify the latest short term rental regulations and Airbnb license requirements directly with local government authorities for Webster to ensure full compliance before hosting.
(Source: AirROI data, 2025, finding no licensed listings among those analyzed)
Top Performing Airbnb Properties in Webster (2025)
Benchmark your potential! Explore examples of top-performing Airbnb properties in Websterbased on Trailing Twelve Month (TTM) revenue. Analyze their characteristics, revenue, occupancy rate, and ADR to understand what drives success in this market.
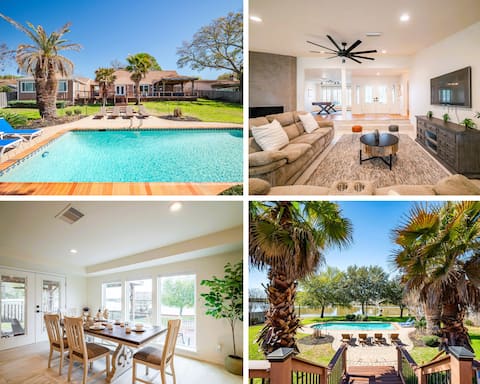
Bayfront Luxury Oasis w Pool - 5' to NASA & Kemah
Entire Place • 5 bedrooms
![The Vintage Houston [5BR Business Executive Home]](https://a0.muscache.com/im/pictures/miso/Hosting-737793013121195737/original/768abac1-c94b-4602-9f02-b25353af53cd.jpeg?im_w=480&im_format=avif)
The Vintage Houston [5BR Business Executive Home]
Entire Place • 5 bedrooms

King Beds*NASA*Kemah*HotTub*Arcade Games*
Entire Place • 4 bedrooms

Cardinal Cottage:Charming 1930s Restored Farmhouse
Entire Place • 3 bedrooms

Cheerful 3 bedrooms with a pool only 1mn for Nasa.
Entire Place • 3 bedrooms

Webster luxury resort like apartment!
Entire Place • 1 bedroom
Note: Performance varies based on location, size, amenities, seasonality, and management quality. Data reflects the past 12 months.
Top Performing Airbnb Hosts in Webster (2025)
Learn from the best! This table showcases top-performing Airbnb hosts in Webster based on the number of properties managed and estimated total revenue over the past year. Analyze their scale and performance metrics.
| Host Name | Properties | Grossing Revenue | Stay Reviews | Avg Rating |
|---|---|---|---|---|
| Levi Homes | 1 | $95,064 | 25 | 4.84/5.0 |
| Becky | 2 | $71,072 | 168 | 4.88/5.0 |
| Shon L. | 1 | $65,121 | 60 | 4.98/5.0 |
| Mallory | 1 | $51,062 | 18 | 5.00/5.0 |
| Geno | 1 | $34,868 | 49 | 5.00/5.0 |
| Sonya | 1 | $19,575 | 40 | 4.75/5.0 |
| Nasha | 1 | $18,387 | 35 | 4.86/5.0 |
| Eboni | 1 | $11,271 | 37 | 4.86/5.0 |
| StayApt | 2 | $9,973 | 478 | 4.64/5.0 |
| Elizabeth | 2 | $9,515 | 109 | 5.00/5.0 |
Analyzing the strategies of top hosts, such as their property selection, pricing, and guest communication, can offer valuable lessons for optimizing your own Airbnb operations in Webster.
Dive Deeper: Advanced Webster STR Market Data (2025)
Ready to unlock more insights? AirROI provides access to advanced metrics and comprehensive Airbnb data for Webster. Explore detailed analytics beyond this report to refine your investment strategy, optimize pricing, and maximize your vacation rental profits.
Explore Advanced MetricsWebster Short-Term Rental Market Composition (2025): Property & Room Types
Room Type Distribution
Property Type Distribution
Market Composition Insights for Webster
- The Webster Airbnb market composition is heavily skewed towards Entire Home/Apt listings, which make up 78.9% of the 19 active rentals. This indicates strong guest preference for privacy and space.
- Looking at the property type distribution in Webster, House properties are the most common (52.6%), reflecting the local real estate landscape.
- Houses represent a significant 52.6% portion, catering likely to families or larger groups.
Webster Airbnb Room Capacity Analysis (2025): Bedroom Distribution
Distribution of Listings by Number of Bedrooms
Room Capacity Insights for Webster
- The dominant room capacity in Webster is 1 bedroom listings, making up 36.8% of the market. This suggests a strong demand for properties suitable for couples or solo travelers.
- Together, 1 bedroom and 2 bedrooms properties represent 57.9% of the active Airbnb listings in Webster, indicating a high concentration in these sizes.
- A significant 26.3% of listings offer 3+ bedrooms, catering to larger groups and families seeking more space in Webster.
Webster Vacation Rental Guest Capacity Trends (2025)
Distribution of Listings by Guest Capacity
Guest Capacity Insights for Webster
- The most common guest capacity trend in Webster vacation rentals is listings accommodating 4 guests (31.6%). This suggests the primary traveler segment is likely small families or groups.
- Properties designed for 4 guests and 8+ guests dominate the Webster STR market, accounting for 52.7% of listings.
- 26.4% of properties accommodate 6+ guests, serving the market segment for larger families or group travel in Webster.
- On average, properties in Webster are equipped to host 4.2 guests.
Webster Airbnb Booking Patterns (2025): Available vs. Booked Days
Available Days Distribution
Booked Days Distribution
Booking Pattern Insights for Webster
- The most common availability pattern in Webster falls within the 181-270 days range, representing 42.1% of listings. This suggests many properties have significant open periods on their calendars.
- Approximately 84.2% of listings show high availability (181+ days open annually), indicating potential for increased bookings or specific owner usage patterns.
- For booked days, the 91-180 days range is most frequent in Webster (47.4%), reflecting common guest stay durations or potential owner blocking patterns.
- A notable 15.8% of properties secure long booking periods (181+ days booked per year), highlighting successful long-term rental strategies or significant owner usage.
Webster Airbnb Minimum Stay Requirements Analysis
Distribution of Listings by Minimum Night Requirement
1 Night
5 listings
31.3% of total
2 Nights
5 listings
31.3% of total
3 Nights
1 listings
6.3% of total
30+ Nights
5 listings
31.3% of total
Key Insights
- The most prevalent minimum stay requirement in Webster is 1 Night, adopted by 31.3% of listings. This highlights the market's preference for shorter, flexible bookings.
- A strong majority (62.6%) of the Webster Airbnb data shows acceptance of very short stays (1-2 nights), indicating a dynamic, high-turnover market.
- A significant segment (31.3%) caters to monthly stays (30+ nights) in Webster, pointing to opportunities in the extended-stay market.
Recommendations
- Align with the market by considering a 1 Night minimum stay, as 31.3% of Webster hosts use this setting.
- Explore offering discounts for stays of 30+ nights to attract the 31.3% of the market seeking extended stays.
- Adjust minimum nights based on seasonality – potentially shorter during low season and longer during peak demand periods in Webster.
Webster Airbnb Cancellation Policy Trends Analysis (2025)
Flexible
3 listings
20% of total
Moderate
2 listings
13.3% of total
Firm
7 listings
46.7% of total
Strict
3 listings
20% of total
Cancellation Policy Insights for Webster
- The prevailing Airbnb cancellation policy trend in Webster is Firm, used by 46.7% of listings.
- A majority (66.7%) of hosts in Webster utilize Firm or Strict policies, indicating a market where hosts prioritize booking security.
Recommendations for Hosts
- Consider adopting a Firm policy to align with the 46.7% market standard in Webster.
- Regularly review your cancellation policy against competitors and market demand shifts in Webster.
Webster STR Booking Lead Time Analysis (2025)
Average Booking Lead Time by Month
Booking Lead Time Insights for Webster
- The overall average booking lead time for vacation rentals in Webster is 25 days.
- Guests book furthest in advance for stays during May (average 60 days), likely coinciding with peak travel demand or local events.
- The shortest booking windows occur for stays in July (average 12 days), indicating more last-minute travel plans during this time.
- Seasonally, Spring (39 days avg.) sees the longest lead times, while Fall (24 days avg.) has the shortest, reflecting typical travel planning cycles.
Recommendations for Hosts
- Use the overall average lead time (25 days) as a baseline for your pricing and availability strategy in Webster.
- For May stays, consider implementing length-of-stay discounts or slightly higher rates for bookings made less than 60 days out to capitalize on advance planning.
- During July, focus on last-minute booking availability and promotions, as guests book with very short notice (12 days avg.).
- Target marketing efforts for the Spring season well in advance (at least 39 days) to capture early planners.
- Monitor your own booking lead times against these Webster averages to identify opportunities for dynamic pricing adjustments.
Popular & Essential Airbnb Amenities in Webster (2025)
Amenity Prevalence
Amenity Insights for Webster
- Essential amenities in Webster that guests expect include: Washer, Free parking on premises, Air conditioning, Kitchen, Smoke alarm, Wifi, Dryer. Lacking these (any) could significantly impact bookings.
- Popular amenities like Dishes and silverware, Refrigerator, Heating are common but not universal. Offering these can provide a competitive edge.
Recommendations for Hosts
- Ensure your listing includes all essential amenities for Webster: Washer, Free parking on premises, Air conditioning, Kitchen, Smoke alarm, Wifi, Dryer.
- Consider adding popular differentiators like Dishes and silverware or Refrigerator to increase appeal.
- Highlight unique or less common amenities you offer (e.g., hot tub, dedicated workspace, EV charger) in your listing description and photos.
- Regularly check competitor amenities in Webster to stay competitive.
Webster Airbnb Guest Demographics & Profile Analysis (2025)
Guest Profile Summary for Webster
- The typical guest profile for Airbnb in Webster consists of primarily domestic travelers (85%), often arriving from nearby Houston, typically belonging to the Post-2000s (Gen Z/Alpha) group (50%), primarily speaking English or Spanish.
- Domestic travelers account for 84.8% of guests.
- Key international markets include United States (84.8%) and Mexico (4.5%).
- Top languages spoken are English (57.5%) followed by Spanish (20.4%).
- A significant demographic segment is the Post-2000s (Gen Z/Alpha) group, representing 50% of guests.
Recommendations for Hosts
- Target domestic marketing efforts towards travelers from Houston and Dallas.
- Tailor amenities and listing descriptions to appeal to the dominant Post-2000s (Gen Z/Alpha) demographic (e.g., highlight fast WiFi, smart home features, local guides).
- Highlight unique local experiences or amenities relevant to the primary guest profile.
- Consider seasonal promotions aligned with peak travel times for key origin markets.
Nearby Short-Term Rental Market Comparison
How does the Webster Airbnb market stack up against its neighbors? Compare key performance metrics like average monthly revenue, ADR, and occupancy rates in surrounding areas to understand the broader regional STR landscape.
| Market | Active Properties | Monthly Revenue | Daily Rate | Avg. Occupancy |
|---|---|---|---|---|
| Midfield | 10 | $3,817 | $534.05 | 22% |
| Fairfield | 12 | $3,676 | $325.72 | 45% |
| Friendswood | 33 | $3,395 | $339.01 | 50% |
| Columbus | 20 | $3,196 | $373.82 | 29% |
| Jamaica Beach | 206 | $3,161 | $358.62 | 36% |
| Franklin | 11 | $3,146 | $355.40 | 40% |
| Crystal Beach | 157 | $3,024 | $400.30 | 31% |
| Waller | 17 | $2,921 | $308.55 | 44% |
| Hempstead | 20 | $2,754 | $422.26 | 30% |
| Shenandoah | 14 | $2,709 | $211.31 | 58% |