Bee Cave Airbnb Market Analysis 2025: Short Term Rental Data & Vacation Rental Statistics in Texas, United States
Is Airbnb profitable in Bee Cave in 2025? Explore comprehensive Airbnb analytics for Bee Cave, Texas, United States to uncover income potential. This 2025 STR market report for Bee Cave, based on AirROI data from June 2024 to May 2025, reveals key trends in the niche market of 22 active listings.
Whether you're considering an Airbnb investment in Bee Cave, optimizing your existing vacation rental, or exploring rental arbitrage opportunities, understanding the Bee Cave Airbnb data is crucial. Leveraging the low regulation environment is key to maximizing your short term rental income potential. Let's dive into the specifics.
Key Bee Cave Airbnb Performance Metrics Overview
Monthly Airbnb Revenue Variations & Income Potential in Bee Cave (2025)
Understanding the monthly revenue variations for Airbnb listings in Bee Cave is key to maximizing your short term rental income potential. Seasonality significantly impacts earnings. Our analysis, based on data from the past 12 months, shows that the peak revenue month for STRs in Bee Cave is typically March, while January often presents the lowest earnings, highlighting opportunities for strategic pricing adjustments during shoulder and low seasons. Explore the typical Airbnb income in Bee Cave across different performance tiers:
- Best-in-class properties (Top 10%) achieve $7,805+ monthly, often utilizing dynamic pricing and superior guest experiences.
- Strong performing properties (Top 25%) earn $3,472 or more, indicating effective management and desirable locations/amenities.
- Typical properties (Median) generate around $2,156 per month, representing the average market performance.
- Entry-level properties (Bottom 25%) see earnings around $1,501, often with potential for optimization.
Average Monthly Airbnb Earnings Trend in Bee Cave
Bee Cave Airbnb Occupancy Rate Trends (2025)
Maximize your bookings by understanding the Bee Cave STR occupancy trends. Seasonal demand shifts significantly influence how often properties are booked. Typically, Marchsees the highest demand (peak season occupancy), while June experiences the lowest (low season). Effective strategies, like adjusting minimum stays or offering promotions, can boost occupancy during slower periods. Here's how different property tiers perform in Bee Cave:
- Best-in-class properties (Top 10%) achieve 80%+ occupancy, indicating high desirability and potentially optimized availability.
- Strong performing properties (Top 25%) maintain 62% or higher occupancy, suggesting good market fit and guest satisfaction.
- Typical properties (Median) have an occupancy rate around 43%.
- Entry-level properties (Bottom 25%) average 23% occupancy, potentially facing higher vacancy.
Average Monthly Occupancy Rate Trend in Bee Cave
Average Daily Rate (ADR) Airbnb Trends in Bee Cave (2025)
Effective short term rental pricing strategy in Bee Cave involves understanding monthly ADR fluctuations. The Average Daily Rate (ADR) for Airbnb in Bee Cave typically peaks in May and dips lowest during July. Leveraging Airbnb dynamic pricing tools or strategies based on this seasonality can significantly boost revenue. Here's a look at the typical nightly rates achieved:
- Best-in-class properties (Top 10%) command rates of $387+ per night, often due to premium features or locations.
- Strong performing properties (Top 25%) achieve nightly rates of $216 or more.
- Typical properties (Median) charge around $168 per night.
- Entry-level properties (Bottom 25%) earn around $137 per night.
Average Daily Rate (ADR) Trend by Month in Bee Cave
Get Live Bee Cave Market Intelligence 👇

Explore Real-time Analytics
Airbnb Seasonality Analysis & Trends in Bee Cave (2025)
Peak Season (March, July, August)
- Revenue averages $4,014 per month
- Occupancy rates average 49.0%
- Daily rates average $215
Shoulder Season
- Revenue averages $3,255 per month
- Occupancy maintains around 45.4%
- Daily rates hold near $215
Low Season (January, May, December)
- Revenue drops to average $2,576 per month
- Occupancy decreases to average 36.2%
- Daily rates adjust to average $225
Seasonality Insights for Bee Cave
- The Airbnb seasonality in Bee Cave shows highly seasonal trends requiring careful strategy. While the sections above show seasonal averages, it's also insightful to look at the extremes:
- During the high season, the absolute peak month showcases Bee Cave's highest earning potential, with monthly revenues capable of climbing to $5,056, occupancy reaching a high of 63.8%, and ADRs peaking at $233.
- Conversely, the slowest single month of the year, typically falling within the low season, marks the market's lowest point. In this month, revenue might dip to $2,194, occupancy could drop to 29.2%, and ADRs may adjust down to $210.
- Understanding both the seasonal averages and these monthly peaks and troughs in revenue, occupancy, and ADR is crucial for maximizing your Airbnb profit potential in Bee Cave.
Seasonal Strategies for Maximizing Profit
- Peak Season: Maximize revenue through premium pricing and potentially longer minimum stays. Ensure high availability.
- Low Season: Offer competitive pricing, special promotions (e.g., extended stay discounts), and flexible cancellation policies. Target off-season travelers like remote workers or budget-conscious guests.
- Shoulder Seasons: Implement dynamic pricing that balances peak and low rates. Target weekend travelers or specific events. Offer slightly more flexible terms than peak season.
- Regularly analyze your own performance against these Bee Cave seasonality benchmarks and adjust your pricing and availability strategy accordingly.
Best Areas for Airbnb Investment in Bee Cave (2025)
Exploring the top neighborhoods for short-term rentals in Bee Cave? This section highlights key areas, outlining why they are attractive for hosts and guests, along with notable local attractions. Consider these locations based on your target guest profile and investment strategy.
| Neighborhood / Area | Why Host Here? (Target Guests & Appeal) | Key Attractions & Landmarks |
|---|---|---|
| Lakeway | A picturesque community near the Lake Travis area, known for its beautiful scenery and outdoor activities. Popular for families and nature enthusiasts seeking a relaxing stay by the water. | Lake Travis, Lakeway Resort and Spa, Lakeway Marina, Rough Hollow Marina, Hippie Hollow Park, Lakeway City Park |
| Bee Cave Central | The heart of Bee Cave, providing access to modern amenities, shopping, and dining. Ideal for visitors looking for convenience and local culture. | Hill Country Galleria, Bee Cave Park, The Backyard, Central Park, Bee Cave Sculpture Park, Local shops and restaurants |
| Westlake Hills | Close proximity to downtown Austin while providing a serene suburban environment, making it attractive for travelers who want to be near the city but enjoy a quieter atmosphere. | Barton Springs Pool, Zilker Park, Emma Long Metropolitan Park, Downtown Austin, Westlake Hills Shopping |
| Dripping Springs | Known as the ‘Gateway to the Hill Country’, it offers a blend of natural beauty and local wineries. It's a favorite for those looking for country charm and outdoor experiences. | Dripping Springs Distilling, Hamilton Pool Preserve, Reimers Ranch Park, Driftwood Estate Winery, Thompson’s Restaurant |
| Spicewood | A scenic area along Lake Travis, known for its wineries and quiet lifestyle. Great for visitors looking to enjoy nature and local food and drink. | Muleshoe Bend Recreation Area, Spicewood Vineyards, Krause Springs, Balcones Canyonlands National Wildlife Refuge, Cypress Valley Canopy Tours |
| Austin Area | Just a short drive from Bee Cave, offers access to Austin's vibrant music and cultural scene. Perfect for tourists looking to explore Texas capital attractions. | Texas State Capitol, Lady Bird Lake, 6th Street, Zilker Botanical Garden, South Congress Avenue |
| Horseshoe Bay | A resort community known for its luxury accommodations and golf courses. Attracts vacationers looking for a high-end getaway by the lake. | Horseshoe Bay Resort, Lake LBJ, The Yacht Club, Blue Lake, Golf at the Slick Rock Golf Course |
| Wimberley | A charming small town in the hill country with local shops, art galleries, and natural attractions. It's appealing for tourists seeking a tranquil retreat. | Wimberley Market Days, Blue Hole Regional Park, Jacob's Well, Wimberley Glassworks, Local art galleries |
Understanding Airbnb License Requirements & STR Laws in Bee Cave (2025)
While Bee Cave, Texas, United States currently shows low STR regulations, specific Airbnb license requirements might still exist or change. Always verify the latest short term rental regulations and Airbnb license requirements directly with local government authorities for Bee Cave to ensure full compliance before hosting.
(Source: AirROI data, 2025, finding no licensed listings among those analyzed)
Top Performing Airbnb Properties in Bee Cave (2025)
Benchmark your potential! Explore examples of top-performing Airbnb properties in Bee Cavebased on Trailing Twelve Month (TTM) revenue. Analyze their characteristics, revenue, occupancy rate, and ADR to understand what drives success in this market.
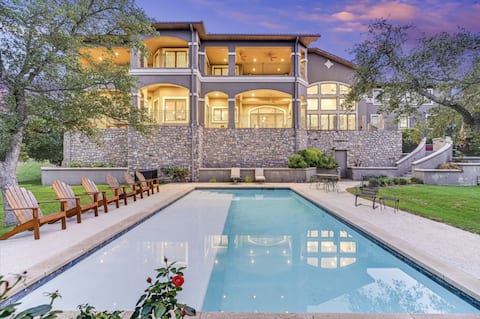
Private Pool + Incredible Views - Paisley Place
Entire Place • 6 bedrooms

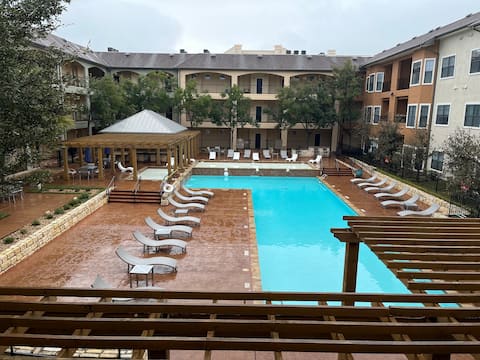
Travis Treehouse
Entire Place • 1 bedroom
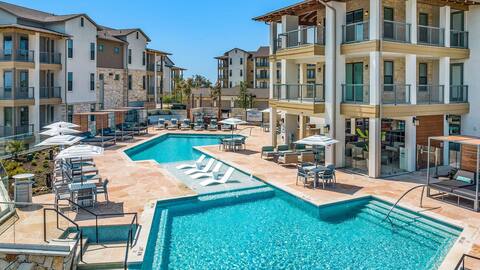
Landing | Modern 1BD, Clubhouse, Pool
Entire Place • 1 bedroom

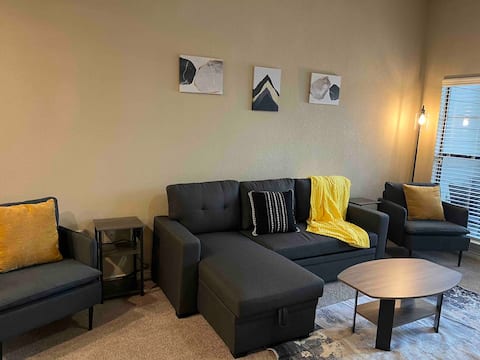
Tranquil Retreat in Bee Cave
Entire Place • 1 bedroom
Hill Country Hiatus!
Entire Place • 2 bedrooms
Hill Country Galleria Getaway! Walk to everything!
Entire Place • 1 bedroom
Note: Performance varies based on location, size, amenities, seasonality, and management quality. Data reflects the past 12 months.
Top Performing Airbnb Hosts in Bee Cave (2025)
Learn from the best! This table showcases top-performing Airbnb hosts in Bee Cave based on the number of properties managed and estimated total revenue over the past year. Analyze their scale and performance metrics.
| Host Name | Properties | Grossing Revenue | Stay Reviews | Avg Rating |
|---|---|---|---|---|
| Renters Club | 1 | $168,006 | 81 | 4.68/5.0 |
| Landing | 14 | $126,233 | 3 | N/A/5.0 |
| Lesley | 2 | $60,655 | 180 | 5.00/5.0 |
| Dayna | 2 | $58,958 | 135 | 4.89/5.0 |
| Maleasa | 1 | $31,607 | 20 | 5.00/5.0 |
| Nell | 1 | $25,894 | 161 | 4.93/5.0 |
| Jesus | 1 | $16,246 | 1 | N/A/5.0 |
Analyzing the strategies of top hosts, such as their property selection, pricing, and guest communication, can offer valuable lessons for optimizing your own Airbnb operations in Bee Cave.
Dive Deeper: Advanced Bee Cave STR Market Data (2025)
Ready to unlock more insights? AirROI provides access to advanced metrics and comprehensive Airbnb data for Bee Cave. Explore detailed analytics beyond this report to refine your investment strategy, optimize pricing, and maximize your vacation rental profits.
Explore Advanced MetricsBee Cave Short-Term Rental Market Composition (2025): Property & Room Types
Room Type Distribution
Property Type Distribution
Market Composition Insights for Bee Cave
- The Bee Cave Airbnb market composition is heavily skewed towards Entire Home/Apt listings, which make up 100% of the 22 active rentals. This indicates strong guest preference for privacy and space.
- Looking at the property type distribution in Bee Cave, Apartment/Condo properties are the most common (77.3%), reflecting the local real estate landscape.
- The presence of 9.1% Hotel/Boutique listings indicates integration with traditional hospitality.
Bee Cave Airbnb Room Capacity Analysis (2025): Bedroom Distribution
Distribution of Listings by Number of Bedrooms
Room Capacity Insights for Bee Cave
- The dominant room capacity in Bee Cave is 1 bedroom listings, making up 77.3% of the market. This suggests a strong demand for properties suitable for couples or solo travelers.
- Together, 1 bedroom and 2 bedrooms properties represent 90.9% of the active Airbnb listings in Bee Cave, indicating a high concentration in these sizes.
- With over half the market (77.3%) consisting of studios or 1-bedroom units, Bee Cave is particularly well-suited for individuals or couples.
- Listings with 3+ bedrooms (9.0%) represent a smaller niche, potentially indicating an underserved market for larger group accommodations in Bee Cave.
Bee Cave Vacation Rental Guest Capacity Trends (2025)
Distribution of Listings by Guest Capacity
Guest Capacity Insights for Bee Cave
- The most common guest capacity trend in Bee Cave vacation rentals is listings accommodating 2 guests (68.2%). This suggests the primary traveler segment is likely couples or solo travelers.
- Properties designed for 2 guests and 6 guests dominate the Bee Cave STR market, accounting for 77.3% of listings.
- A significant 68.2% of listings cater specifically to 1-2 guests, highlighting strong demand from couples and solo travelers in Bee Cave.
- 13.6% of properties accommodate 6+ guests, serving the market segment for larger families or group travel in Bee Cave.
- On average, properties in Bee Cave are equipped to host 2.9 guests.
Bee Cave Airbnb Booking Patterns (2025): Available vs. Booked Days
Available Days Distribution
Booked Days Distribution
Booking Pattern Insights for Bee Cave
- The most common availability pattern in Bee Cave falls within the 271-366 days range, representing 63.6% of listings. This suggests many properties have significant open periods on their calendars.
- Approximately 77.2% of listings show high availability (181+ days open annually), indicating potential for increased bookings or specific owner usage patterns.
- For booked days, the 1-30 days range is most frequent in Bee Cave (36.4%), reflecting common guest stay durations or potential owner blocking patterns.
- A notable 27.3% of properties secure long booking periods (181+ days booked per year), highlighting successful long-term rental strategies or significant owner usage.
Bee Cave Airbnb Minimum Stay Requirements Analysis
Distribution of Listings by Minimum Night Requirement
1 Night
2 listings
9.1% of total
2 Nights
2 listings
9.1% of total
4-6 Nights
1 listings
4.5% of total
7-29 Nights
14 listings
63.6% of total
30+ Nights
3 listings
13.6% of total
Key Insights
- The most prevalent minimum stay requirement in Bee Cave is 7-29 Nights, adopted by 63.6% of listings. This highlights the market's preference for shorter, flexible bookings.
- Very short stays (1-2 nights) are less common (18.2%), suggesting hosts prefer slightly longer bookings to optimize turnover.
- A significant segment (13.6%) caters to monthly stays (30+ nights) in Bee Cave, pointing to opportunities in the extended-stay market.
Recommendations
- Align with the market by considering a 7-29 Nights minimum stay, as 63.6% of Bee Cave hosts use this setting.
- If feasible, allowing 1-night stays, especially midweek or during low season, could capture last-minute bookings, as only 9.1% currently do.
- Explore offering discounts for stays of 30+ nights to attract the 13.6% of the market seeking extended stays.
- Adjust minimum nights based on seasonality – potentially shorter during low season and longer during peak demand periods in Bee Cave.
Bee Cave Airbnb Cancellation Policy Trends Analysis (2025)
Flexible
3 listings
25% of total
Moderate
5 listings
41.7% of total
Firm
2 listings
16.7% of total
Strict
2 listings
16.7% of total
Cancellation Policy Insights for Bee Cave
- The prevailing Airbnb cancellation policy trend in Bee Cave is Moderate, used by 41.7% of listings.
- There's a relatively balanced mix between guest-friendly (66.7%) and stricter (33.4%) policies, offering choices for different guest needs.
Recommendations for Hosts
- Consider adopting a Moderate policy to align with the 41.7% market standard in Bee Cave.
- Regularly review your cancellation policy against competitors and market demand shifts in Bee Cave.
Bee Cave STR Booking Lead Time Analysis (2025)
Average Booking Lead Time by Month
Booking Lead Time Insights for Bee Cave
- The overall average booking lead time for vacation rentals in Bee Cave is 22 days.
- Guests book furthest in advance for stays during October (average 62 days), likely coinciding with peak travel demand or local events.
- The shortest booking windows occur for stays in July (average 9 days), indicating more last-minute travel plans during this time.
- Seasonally, Fall (44 days avg.) sees the longest lead times, while Summer (13 days avg.) has the shortest, reflecting typical travel planning cycles.
Recommendations for Hosts
- Use the overall average lead time (22 days) as a baseline for your pricing and availability strategy in Bee Cave.
- For October stays, consider implementing length-of-stay discounts or slightly higher rates for bookings made less than 62 days out to capitalize on advance planning.
- During July, focus on last-minute booking availability and promotions, as guests book with very short notice (9 days avg.).
- Target marketing efforts for the Fall season well in advance (at least 44 days) to capture early planners.
- Monitor your own booking lead times against these Bee Cave averages to identify opportunities for dynamic pricing adjustments.
Popular & Essential Airbnb Amenities in Bee Cave (2025)
Amenity Prevalence
No amenities with partial availability (less than 100%) were found to display in the chart. All essential amenities might be present in all listings. Check insights below.
Amenity Insights for Bee Cave
- Essential amenities in Bee Cave that guests expect include: Cooking basics, Heating, Kitchen, Air conditioning, TV, Hot water, Wifi, Essentials, Coffee maker, Hair dryer. Lacking these (any) could significantly impact bookings.
Recommendations for Hosts
- Ensure your listing includes all essential amenities for Bee Cave: Cooking basics, Heating, Kitchen, Air conditioning, TV, Hot water, Wifi, Essentials, Coffee maker, Hair dryer.
- Highlight unique or less common amenities you offer (e.g., hot tub, dedicated workspace, EV charger) in your listing description and photos.
- Regularly check competitor amenities in Bee Cave to stay competitive.
Bee Cave Airbnb Guest Demographics & Profile Analysis (2025)
Guest Profile Summary for Bee Cave
- The typical guest profile for Airbnb in Bee Cave consists of primarily domestic travelers (92%), often arriving from nearby Austin, typically belonging to the Post-2000s (Gen Z/Alpha) group (50%), primarily speaking English or Spanish.
- Domestic travelers account for 92.1% of guests.
- Key international markets include United States (92.1%) and Canada (2.9%).
- Top languages spoken are English (67%) followed by Spanish (17.6%).
- A significant demographic segment is the Post-2000s (Gen Z/Alpha) group, representing 50% of guests.
Recommendations for Hosts
- Target domestic marketing efforts towards travelers from Austin and Houston.
- Tailor amenities and listing descriptions to appeal to the dominant Post-2000s (Gen Z/Alpha) demographic (e.g., highlight fast WiFi, smart home features, local guides).
- Highlight unique local experiences or amenities relevant to the primary guest profile.
- Consider seasonal promotions aligned with peak travel times for key origin markets.
Nearby Short-Term Rental Market Comparison
How does the Bee Cave Airbnb market stack up against its neighbors? Compare key performance metrics like average monthly revenue, ADR, and occupancy rates in surrounding areas to understand the broader regional STR landscape.
| Market | Active Properties | Monthly Revenue | Daily Rate | Avg. Occupancy |
|---|---|---|---|---|
| Jonestown | 63 | $5,090 | $507.48 | 31% |
| Hudson Bend | 65 | $4,407 | $527.36 | 30% |
| West Lake Hills | 23 | $4,206 | $736.27 | 30% |
| Groesbeck | 10 | $4,204 | $388.13 | 36% |
| Helotes | 48 | $3,582 | $350.14 | 41% |
| Volente | 22 | $3,510 | $438.32 | 31% |
| Dripping Springs | 420 | $3,434 | $388.79 | 34% |
| Briarcliff | 40 | $3,394 | $393.95 | 30% |
| Kingsland | 267 | $3,379 | $528.30 | 26% |
| Martindale | 41 | $3,247 | $382.53 | 32% |