Anahuac Airbnb Market Analysis 2025: Short Term Rental Data & Vacation Rental Statistics in Texas, United States
Is Airbnb profitable in Anahuac in 2025? Explore comprehensive Airbnb analytics for Anahuac, Texas, United States to uncover income potential. This 2025 STR market report for Anahuac, based on AirROI data from April 2024 to March 2025, reveals key trends in the niche market of 17 active listings.
Whether you're considering an Airbnb investment in Anahuac, optimizing your existing vacation rental, or exploring rental arbitrage opportunities, understanding the Anahuac Airbnb data is crucial. Leveraging the low regulation environment is key to maximizing your short term rental income potential. Let's dive into the specifics.
Key Anahuac Airbnb Performance Metrics Overview
Monthly Airbnb Revenue Variations & Income Potential in Anahuac (2025)
Understanding the monthly revenue variations for Airbnb listings in Anahuac is key to maximizing your short term rental income potential. Seasonality significantly impacts earnings. Our analysis, based on data from the past 12 months, shows that the peak revenue month for STRs in Anahuac is typically June, while October often presents the lowest earnings, highlighting opportunities for strategic pricing adjustments during shoulder and low seasons. Explore the typical Airbnb income in Anahuac across different performance tiers:
- Best-in-class properties (Top 10%) achieve $5,976+ monthly, often utilizing dynamic pricing and superior guest experiences.
- Strong performing properties (Top 25%) earn $3,244 or more, indicating effective management and desirable locations/amenities.
- Typical properties (Median) generate around $1,367 per month, representing the average market performance.
- Entry-level properties (Bottom 25%) see earnings around $489, often with potential for optimization.
Average Monthly Airbnb Earnings Trend in Anahuac
Anahuac Airbnb Occupancy Rate Trends (2025)
Maximize your bookings by understanding the Anahuac STR occupancy trends. Seasonal demand shifts significantly influence how often properties are booked. Typically, Julysees the highest demand (peak season occupancy), while March experiences the lowest (low season). Effective strategies, like adjusting minimum stays or offering promotions, can boost occupancy during slower periods. Here's how different property tiers perform in Anahuac:
- Best-in-class properties (Top 10%) achieve 56%+ occupancy, indicating high desirability and potentially optimized availability.
- Strong performing properties (Top 25%) maintain 38% or higher occupancy, suggesting good market fit and guest satisfaction.
- Typical properties (Median) have an occupancy rate around 19%.
- Entry-level properties (Bottom 25%) average 12% occupancy, potentially facing higher vacancy.
Average Monthly Occupancy Rate Trend in Anahuac
Average Daily Rate (ADR) Airbnb Trends in Anahuac (2025)
Effective short term rental pricing strategy in Anahuac involves understanding monthly ADR fluctuations. The Average Daily Rate (ADR) for Airbnb in Anahuac typically peaks in November and dips lowest during February. Leveraging Airbnb dynamic pricing tools or strategies based on this seasonality can significantly boost revenue. Here's a look at the typical nightly rates achieved:
- Best-in-class properties (Top 10%) command rates of $381+ per night, often due to premium features or locations.
- Strong performing properties (Top 25%) achieve nightly rates of $205 or more.
- Typical properties (Median) charge around $111 per night.
- Entry-level properties (Bottom 25%) earn around $64 per night.
Average Daily Rate (ADR) Trend by Month in Anahuac
Get Live Anahuac Market Intelligence 👇

Explore Real-time Analytics
Airbnb Seasonality Analysis & Trends in Anahuac (2025)
Peak Season (June, May, April)
- Revenue averages $4,320 per month
- Occupancy rates average 36.1%
- Daily rates average $161
Shoulder Season
- Revenue averages $1,941 per month
- Occupancy maintains around 26.1%
- Daily rates hold near $162
Low Season (September, October, December)
- Revenue drops to average $1,189 per month
- Occupancy decreases to average 20.0%
- Daily rates adjust to average $165
Seasonality Insights for Anahuac
- The Airbnb seasonality in Anahuac shows highly seasonal trends requiring careful strategy. While the sections above show seasonal averages, it's also insightful to look at the extremes:
- During the high season, the absolute peak month showcases Anahuac's highest earning potential, with monthly revenues capable of climbing to $4,773, occupancy reaching a high of 38.9%, and ADRs peaking at $174.
- Conversely, the slowest single month of the year, typically falling within the low season, marks the market's lowest point. In this month, revenue might dip to $1,138, occupancy could drop to 16.9%, and ADRs may adjust down to $158.
- Understanding both the seasonal averages and these monthly peaks and troughs in revenue, occupancy, and ADR is crucial for maximizing your Airbnb profit potential in Anahuac.
Seasonal Strategies for Maximizing Profit
- Peak Season: Maximize revenue through premium pricing and potentially longer minimum stays. Ensure high availability.
- Low Season: Offer competitive pricing, special promotions (e.g., extended stay discounts), and flexible cancellation policies. Target off-season travelers like remote workers or budget-conscious guests.
- Shoulder Seasons: Implement dynamic pricing that balances peak and low rates. Target weekend travelers or specific events. Offer slightly more flexible terms than peak season.
- Regularly analyze your own performance against these Anahuac seasonality benchmarks and adjust your pricing and availability strategy accordingly.
Best Areas for Airbnb Investment in Anahuac (2025)
Exploring the top neighborhoods for short-term rentals in Anahuac? This section highlights key areas, outlining why they are attractive for hosts and guests, along with notable local attractions. Consider these locations based on your target guest profile and investment strategy.
| Neighborhood / Area | Why Host Here? (Target Guests & Appeal) | Key Attractions & Landmarks |
|---|---|---|
| Anahuac Historical District | A charming area known for its historic buildings and rich heritage. This neighborhood attracts visitors interested in the history of Anahuac and Texas, providing a unique glimpse into the past. | Anahuac Courthouse, Cameron Prairie National Wildlife Refuge, San Jacinto Battleground State Park, Texas Independence Trail, Buffalo Bayou |
| East Chambers County | This area offers a rural escape with natural surroundings and water activities. Popular among nature lovers, it’s ideal for guests seeking tranquility and outdoor adventures like fishing and hiking. | Trinity River, Lake Anahuac, Anahuac National Wildlife Refuge, wildlife watching, camping sites |
| West Anahuac | Known for its proximity to the water and scenic landscapes, this area draws those interested in boating and fishing, making it appealing for guests looking for a lakeside retreat. | Lake Adeola, Anahuac Wetlands, fishing spots, picnic areas |
| Anahuac Nature Center | A focus on eco-tourism and natural beauty, this area attracts visitors who enjoy hiking, nature walks, and exploring Texas flora and fauna. | Nature trails, bird watching, Anahuac Wildlife Center, educational programs about local ecology |
| Historic Fort Anahuac | Rich in historical significance, this area offers educational experiences about the Texas Revolution and attracts history enthusiasts and families. | Fort Anahuac, historical reenactments, local museums, educational tours |
| Rural Anahuac | A peaceful and quiet area away from city life, ideal for those looking for a retreat and an authentic Texas experience, attracting guests seeking solitude or group retreats. | cattle ranches, farming tours, local markets, natural landscapes |
| Anahuac Town Center | The heart of the community with shops, restaurants, and local events. An excellent spot for visitors looking to immerse themselves in the local culture and community activities. | local dining, community festivals, shopping areas, art fairs |
| Beachfront Options near Anahuac | Proximity to the Gulf of Mexico offers beach-related activities and water sports. This area attracts guests looking for a coastal getaway with easy access to the beach. | Gulf beaches, beach activities, fishing, water sports, sunbathing spots |
Understanding Airbnb License Requirements & STR Laws in Anahuac (2025)
While Anahuac, Texas, United States currently shows low STR regulations, specific Airbnb license requirements might still exist or change. Always verify the latest short term rental regulations and Airbnb license requirements directly with local government authorities for Anahuac to ensure full compliance before hosting.
(Source: AirROI data, 2025, finding no licensed listings among those analyzed)
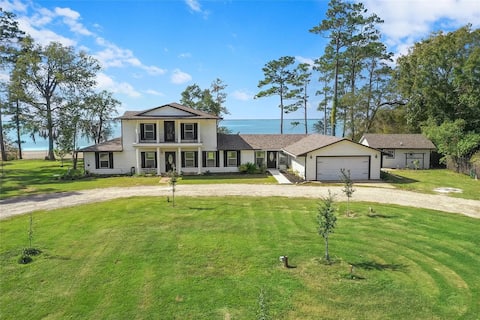
Top Performing Airbnb Properties in Anahuac (2025)
Benchmark your potential! Explore examples of top-performing Airbnb properties in Anahuacbased on Trailing Twelve Month (TTM) revenue. Analyze their characteristics, revenue, occupancy rate, and ADR to understand what drives success in this market.
Spacious Lakehouse + Cozy Studio
Entire Place • 5 bedrooms

The Nest on Lake Anahuac
Entire Place • 3 bedrooms
Spacious Lake House As The Perfect Getaway
Entire Place • 4 bedrooms
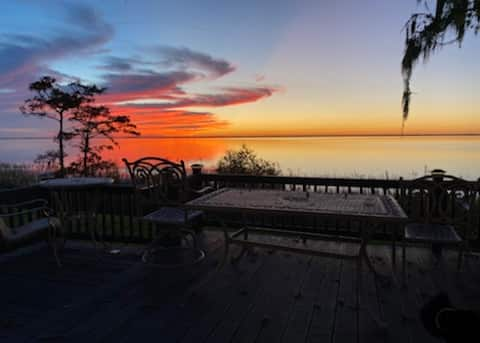
Sunset Vista
Entire Place • 3 bedrooms
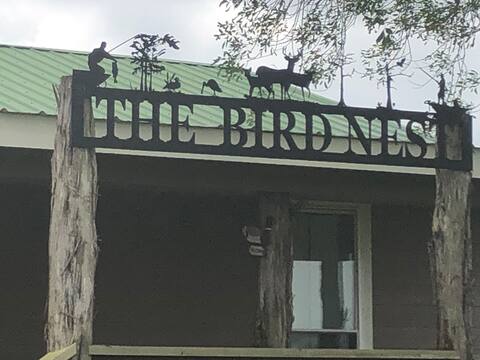
Bird Nest Lodge
Entire Place • 3 bedrooms
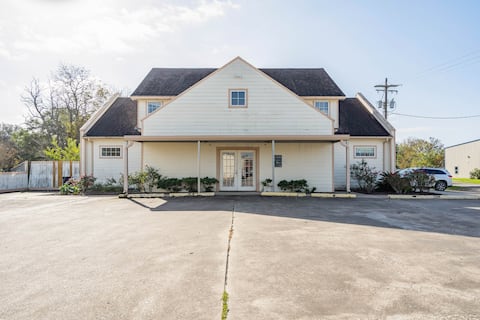
Entire Floor for Rent
Private Room • 5 bedrooms
Note: Performance varies based on location, size, amenities, seasonality, and management quality. Data reflects the past 12 months.
Top Performing Airbnb Hosts in Anahuac (2025)
Learn from the best! This table showcases top-performing Airbnb hosts in Anahuac based on the number of properties managed and estimated total revenue over the past year. Analyze their scale and performance metrics.
| Host Name | Properties | Grossing Revenue | Stay Reviews | Avg Rating |
|---|---|---|---|---|
| Jeff | 2 | $121,201 | 46 | 4.93/5.0 |
| Taylor | 1 | $58,170 | 21 | 4.95/5.0 |
| Mike And Mistie | 4 | $23,786 | 137 | 4.76/5.0 |
| Adelfa | 7 | $23,258 | 22 | 2.04/5.0 |
| Cindy | 1 | $20,213 | 6 | 5.00/5.0 |
| Karla | 1 | $17,280 | 193 | 4.96/5.0 |
| Mike | 1 | $1,668 | 16 | 4.88/5.0 |
Analyzing the strategies of top hosts, such as their property selection, pricing, and guest communication, can offer valuable lessons for optimizing your own Airbnb operations in Anahuac.
Dive Deeper: Advanced Anahuac STR Market Data (2025)
Ready to unlock more insights? AirROI provides access to advanced metrics and comprehensive Airbnb data for Anahuac. Explore detailed analytics beyond this report to refine your investment strategy, optimize pricing, and maximize your vacation rental profits.
Explore Advanced MetricsAnahuac Short-Term Rental Market Composition (2025): Property & Room Types
Room Type Distribution
Property Type Distribution
Market Composition Insights for Anahuac
- The Anahuac Airbnb market composition is heavily skewed towards Entire Home/Apt listings, which make up 58.8% of the 17 active rentals. This indicates strong guest preference for privacy and space.
- However, a notable 41.2% share for Private Rooms suggests opportunities for budget-conscious travelers or hosts renting out spare rooms.
- Looking at the property type distribution in Anahuac, House properties are the most common (88.2%), reflecting the local real estate landscape.
- Houses represent a significant 88.2% portion, catering likely to families or larger groups.
Anahuac Airbnb Room Capacity Analysis (2025): Bedroom Distribution
Distribution of Listings by Number of Bedrooms
Room Capacity Insights for Anahuac
- The dominant room capacity in Anahuac is 5+ bedrooms listings, making up 35.3% of the market. This suggests a strong demand for properties suitable for families or small groups.
- Together, 5+ bedrooms and 1 bedroom properties represent 64.7% of the active Airbnb listings in Anahuac, indicating a high concentration in these sizes.
- A significant 58.8% of listings offer 3+ bedrooms, catering to larger groups and families seeking more space in Anahuac.
Anahuac Vacation Rental Guest Capacity Trends (2025)
Distribution of Listings by Guest Capacity
Guest Capacity Insights for Anahuac
- The most common guest capacity trend in Anahuac vacation rentals is listings accommodating 8+ guests (29.4%). This suggests the primary traveler segment is likely larger groups.
- Properties designed for 8+ guests and 2 guests dominate the Anahuac STR market, accounting for 52.9% of listings.
- 35.3% of properties accommodate 6+ guests, serving the market segment for larger families or group travel in Anahuac.
- On average, properties in Anahuac are equipped to host 4.5 guests.
Anahuac Airbnb Booking Patterns (2025): Available vs. Booked Days
Available Days Distribution
Booked Days Distribution
Booking Pattern Insights for Anahuac
- The most common availability pattern in Anahuac falls within the 271-366 days range, representing 76.5% of listings. This suggests many properties have significant open periods on their calendars.
- Approximately 94.1% of listings show high availability (181+ days open annually), indicating potential for increased bookings or specific owner usage patterns.
- For booked days, the 1-30 days range is most frequent in Anahuac (41.2%), reflecting common guest stay durations or potential owner blocking patterns.
- A notable 5.9% of properties secure long booking periods (181+ days booked per year), highlighting successful long-term rental strategies or significant owner usage.
Anahuac Airbnb Minimum Stay Requirements Analysis
Distribution of Listings by Minimum Night Requirement
1 Night
9 listings
52.9% of total
2 Nights
6 listings
35.3% of total
3 Nights
1 listings
5.9% of total
30+ Nights
1 listings
5.9% of total
Key Insights
- The most prevalent minimum stay requirement in Anahuac is 1 Night, adopted by 52.9% of listings. This highlights the market's preference for shorter, flexible bookings.
- A strong majority (88.2%) of the Anahuac Airbnb data shows acceptance of very short stays (1-2 nights), indicating a dynamic, high-turnover market.
Recommendations
- Align with the market by considering a 1 Night minimum stay, as 52.9% of Anahuac hosts use this setting.
- Explore offering discounts for stays of 30+ nights to attract the 5.9% of the market seeking extended stays.
- Adjust minimum nights based on seasonality – potentially shorter during low season and longer during peak demand periods in Anahuac.
Anahuac Airbnb Cancellation Policy Trends Analysis (2025)
Flexible
6 listings
46.2% of total
Moderate
2 listings
15.4% of total
Firm
2 listings
15.4% of total
Strict
3 listings
23.1% of total
Cancellation Policy Insights for Anahuac
- The prevailing Airbnb cancellation policy trend in Anahuac is Flexible, used by 46.2% of listings.
- There's a relatively balanced mix between guest-friendly (61.6%) and stricter (38.5%) policies, offering choices for different guest needs.
Recommendations for Hosts
- Consider adopting a Flexible policy to align with the 46.2% market standard in Anahuac.
- Regularly review your cancellation policy against competitors and market demand shifts in Anahuac.
Anahuac STR Booking Lead Time Analysis (2025)
Average Booking Lead Time by Month
Booking Lead Time Insights for Anahuac
- The overall average booking lead time for vacation rentals in Anahuac is 43 days.
- Guests book furthest in advance for stays during May (average 73 days), likely coinciding with peak travel demand or local events.
- The shortest booking windows occur for stays in August (average 15 days), indicating more last-minute travel plans during this time.
- Seasonally, Spring (56 days avg.) sees the longest lead times, while Summer (31 days avg.) has the shortest, reflecting typical travel planning cycles.
Recommendations for Hosts
- Use the overall average lead time (43 days) as a baseline for your pricing and availability strategy in Anahuac.
- For May stays, consider implementing length-of-stay discounts or slightly higher rates for bookings made less than 73 days out to capitalize on advance planning.
- Target marketing efforts for the Spring season well in advance (at least 56 days) to capture early planners.
- Monitor your own booking lead times against these Anahuac averages to identify opportunities for dynamic pricing adjustments.
Popular & Essential Airbnb Amenities in Anahuac (2025)
Amenity Prevalence
Amenity Insights for Anahuac
- Essential amenities in Anahuac that guests expect include: Bed linens, Heating, Hair dryer, Dining table, Smoke alarm, TV, Cleaning products, Air conditioning. Lacking these (any) could significantly impact bookings.
- Popular amenities like Free parking on premises, Kitchen are common but not universal. Offering these can provide a competitive edge.
Recommendations for Hosts
- Ensure your listing includes all essential amenities for Anahuac: Bed linens, Heating, Hair dryer, Dining table, Smoke alarm, TV, Cleaning products, Air conditioning.
- Consider adding popular differentiators like Free parking on premises or Kitchen to increase appeal.
- Highlight unique or less common amenities you offer (e.g., hot tub, dedicated workspace, EV charger) in your listing description and photos.
- Regularly check competitor amenities in Anahuac to stay competitive.
Anahuac Airbnb Guest Demographics & Profile Analysis (2025)
Guest Profile Summary for Anahuac
- The typical guest profile for Airbnb in Anahuac consists of primarily domestic travelers (98%), often arriving from nearby Houston, typically belonging to the Post-2000s (Gen Z/Alpha) group (50%), primarily speaking English or Spanish.
- Domestic travelers account for 98.3% of guests.
- Key international markets include United States (98.3%) and Argentina (1.7%).
- Top languages spoken are English (71.4%) followed by Spanish (22.9%).
- A significant demographic segment is the Post-2000s (Gen Z/Alpha) group, representing 50% of guests.
Recommendations for Hosts
- Target domestic marketing efforts towards travelers from Houston and Katy.
- Tailor amenities and listing descriptions to appeal to the dominant Post-2000s (Gen Z/Alpha) demographic (e.g., highlight fast WiFi, smart home features, local guides).
- Highlight unique local experiences or amenities relevant to the primary guest profile.
- Consider seasonal promotions aligned with peak travel times for key origin markets.
Nearby Short-Term Rental Market Comparison
How does the Anahuac Airbnb market stack up against its neighbors? Compare key performance metrics like average monthly revenue, ADR, and occupancy rates in surrounding areas to understand the broader regional STR landscape.
| Market | Active Properties | Monthly Revenue | Daily Rate | Avg. Occupancy |
|---|---|---|---|---|
| Gilchrist | 10 | $4,278 | $370.86 | 35% |
| Friendswood | 28 | $3,947 | $350.60 | 50% |
| Jamaica Beach | 204 | $3,786 | $343.60 | 37% |
| Fairfield | 12 | $3,782 | $312.53 | 46% |
| Crystal Beach | 156 | $3,474 | $385.42 | 31% |
| Bolivar Peninsula | 755 | $3,401 | $352.70 | 34% |
| Waller | 16 | $3,222 | $302.15 | 46% |
| Shenandoah | 13 | $3,114 | $204.71 | 57% |
| Surfside Beach | 420 | $2,724 | $296.04 | 36% |
| Freeport | 157 | $2,708 | $317.62 | 33% |