Aldine Airbnb Market Analysis 2025: Short Term Rental Data & Vacation Rental Statistics in Texas, United States
Is Airbnb profitable in Aldine in 2025? Explore comprehensive Airbnb analytics for Aldine, Texas, United States to uncover income potential. This 2025 STR market report for Aldine, based on AirROI data from June 2024 to May 2025, reveals key trends in the niche market of 20 active listings.
Whether you're considering an Airbnb investment in Aldine, optimizing your existing vacation rental, or exploring rental arbitrage opportunities, understanding the Aldine Airbnb data is crucial. Leveraging the low regulation environment is key to maximizing your short term rental income potential. Let's dive into the specifics.
Key Aldine Airbnb Performance Metrics Overview
Monthly Airbnb Revenue Variations & Income Potential in Aldine (2025)
Understanding the monthly revenue variations for Airbnb listings in Aldine is key to maximizing your short term rental income potential. Seasonality significantly impacts earnings. Our analysis, based on data from the past 12 months, shows that the peak revenue month for STRs in Aldine is typically June, while February often presents the lowest earnings, highlighting opportunities for strategic pricing adjustments during shoulder and low seasons. Explore the typical Airbnb income in Aldine across different performance tiers:
- Best-in-class properties (Top 10%) achieve $1,814+ monthly, often utilizing dynamic pricing and superior guest experiences.
- Strong performing properties (Top 25%) earn $1,497 or more, indicating effective management and desirable locations/amenities.
- Typical properties (Median) generate around $991 per month, representing the average market performance.
- Entry-level properties (Bottom 25%) see earnings around $546, often with potential for optimization.
Average Monthly Airbnb Earnings Trend in Aldine
Aldine Airbnb Occupancy Rate Trends (2025)
Maximize your bookings by understanding the Aldine STR occupancy trends. Seasonal demand shifts significantly influence how often properties are booked. Typically, Junesees the highest demand (peak season occupancy), while February experiences the lowest (low season). Effective strategies, like adjusting minimum stays or offering promotions, can boost occupancy during slower periods. Here's how different property tiers perform in Aldine:
- Best-in-class properties (Top 10%) achieve 74%+ occupancy, indicating high desirability and potentially optimized availability.
- Strong performing properties (Top 25%) maintain 62% or higher occupancy, suggesting good market fit and guest satisfaction.
- Typical properties (Median) have an occupancy rate around 38%.
- Entry-level properties (Bottom 25%) average 19% occupancy, potentially facing higher vacancy.
Average Monthly Occupancy Rate Trend in Aldine
Average Daily Rate (ADR) Airbnb Trends in Aldine (2025)
Effective short term rental pricing strategy in Aldine involves understanding monthly ADR fluctuations. The Average Daily Rate (ADR) for Airbnb in Aldine typically peaks in September and dips lowest during February. Leveraging Airbnb dynamic pricing tools or strategies based on this seasonality can significantly boost revenue. Here's a look at the typical nightly rates achieved:
- Best-in-class properties (Top 10%) command rates of $276+ per night, often due to premium features or locations.
- Strong performing properties (Top 25%) achieve nightly rates of $190 or more.
- Typical properties (Median) charge around $102 per night.
- Entry-level properties (Bottom 25%) earn around $65 per night.
Average Daily Rate (ADR) Trend by Month in Aldine
Get Live Aldine Market Intelligence 👇

Explore Real-time Analytics
Airbnb Seasonality Analysis & Trends in Aldine (2025)
Peak Season (June, August, January)
- Revenue averages $1,224 per month
- Occupancy rates average 47.4%
- Daily rates average $138
Shoulder Season
- Revenue averages $1,071 per month
- Occupancy maintains around 40.9%
- Daily rates hold near $137
Low Season (February, September, October)
- Revenue drops to average $841 per month
- Occupancy decreases to average 35.7%
- Daily rates adjust to average $139
Seasonality Insights for Aldine
- The Airbnb seasonality in Aldine shows moderate seasonality with distinct peak and low periods. While the sections above show seasonal averages, it's also insightful to look at the extremes:
- During the high season, the absolute peak month showcases Aldine's highest earning potential, with monthly revenues capable of climbing to $1,329, occupancy reaching a high of 54.0%, and ADRs peaking at $146.
- Conversely, the slowest single month of the year, typically falling within the low season, marks the market's lowest point. In this month, revenue might dip to $760, occupancy could drop to 30.8%, and ADRs may adjust down to $127.
- Understanding both the seasonal averages and these monthly peaks and troughs in revenue, occupancy, and ADR is crucial for maximizing your Airbnb profit potential in Aldine.
Seasonal Strategies for Maximizing Profit
- Peak Season: Maximize revenue through premium pricing and potentially longer minimum stays. Ensure high availability.
- Low Season: Offer competitive pricing, special promotions (e.g., extended stay discounts), and flexible cancellation policies. Target off-season travelers like remote workers or budget-conscious guests.
- Shoulder Seasons: Implement dynamic pricing that balances peak and low rates. Target weekend travelers or specific events. Offer slightly more flexible terms than peak season.
- Regularly analyze your own performance against these Aldine seasonality benchmarks and adjust your pricing and availability strategy accordingly.
Best Areas for Airbnb Investment in Aldine (2025)
Exploring the top neighborhoods for short-term rentals in Aldine? This section highlights key areas, outlining why they are attractive for hosts and guests, along with notable local attractions. Consider these locations based on your target guest profile and investment strategy.
| Neighborhood / Area | Why Host Here? (Target Guests & Appeal) | Key Attractions & Landmarks |
|---|---|---|
| North Harris County | A rapidly growing area with a mix of residential, commercial, and industrial properties. Ideal for those looking to capture the suburban market near Houston. | Greenspoint Mall, Wet 'n' Wild SplashTown, North Houston District, Humble Museum, Woodlands Mall |
| Aldine ISD Area | Home to many families and students, this area offers a demand for short-term rentals to accommodate education and family visits. | Aldine High School, Aldine Community Center, Klein Memorial Park, Houston Northwest Medical Center |
| Cypress Station | A suburban neighborhood with easy access to major highways and public transport, attracting both families and business travelers. | Hammock Park, Cypress Station Shopping Center, Spring Creek Greenway, Cypresswood Golf Club |
| Fallbrook | A family-friendly neighborhood with parks and amenities, appealing to those looking for suburban comfort near the city. | Fallbrook Park, Ritson Park, Fallbrook Shopping Center, Nearby schools and recreational facilities |
| Houston Intercontinental Airport Area | A prime location for business travelers needing convenient access to the airport, as well as tourists visiting the Houston area. | IAH Airport, Greenspoint Mall, Northgate Country Club, Pine Forest Country Club |
| West Little York | A less crowded area with opportunities for vacation rentals for visitors looking for budget-friendly options while still being near Houston's attractions. | Trinity Gardens Park, Smither Park, Nearby dining options, Easy access to downtown Houston |
| East Aldine | An emerging neighborhood with new developments and investment opportunities, perfect for those looking to capitalize on the area's growth. | East Aldine Management District, Local markets and eateries, Parks and recreation areas, Community centers |
| Spring Branch North | A growing community with a diverse population and many amenities, attracting short-term lease seekers all year round. | Spring Branch High School, Parks and trails, Shopping centers, Nearby dining options |
Understanding Airbnb License Requirements & STR Laws in Aldine (2025)
While Aldine, Texas, United States currently shows low STR regulations, specific Airbnb license requirements might still exist or change. Always verify the latest short term rental regulations and Airbnb license requirements directly with local government authorities for Aldine to ensure full compliance before hosting.
(Source: AirROI data, 2025, based on 5% licensed listings)
Top Performing Airbnb Properties in Aldine (2025)
Benchmark your potential! Explore examples of top-performing Airbnb properties in Aldinebased on Trailing Twelve Month (TTM) revenue. Analyze their characteristics, revenue, occupancy rate, and ADR to understand what drives success in this market.
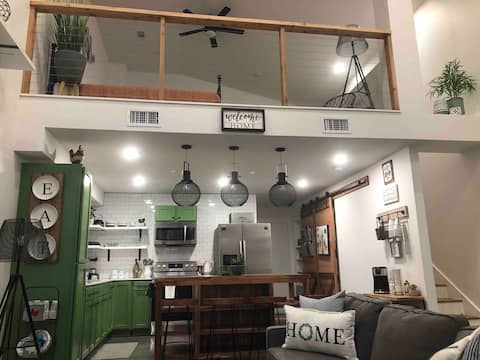
The Loft
Entire Place • 1 bedroom
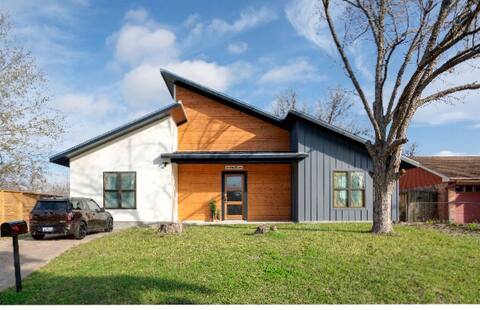
Chic House
Entire Place • 2 bedrooms
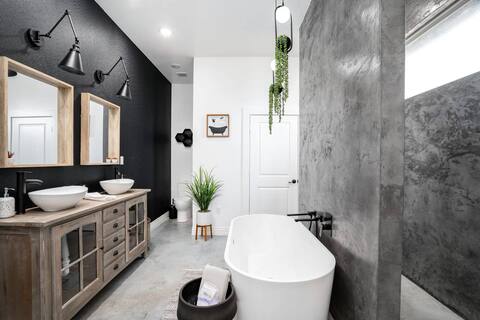
Concrete De Luxe
Private Room • 1 bedroom
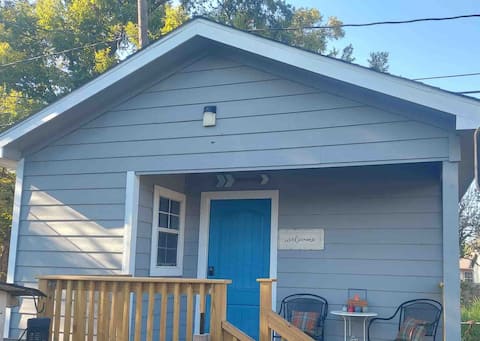
Cozy, modern, beautiful home!
Entire Place • N/A
Jalei House. Cozy 3-bedroom home with huge yard!
Entire Place • 3 bedrooms
THE DECK ROOM
Entire Place • 1 bedroom
Note: Performance varies based on location, size, amenities, seasonality, and management quality. Data reflects the past 12 months.
Top Performing Airbnb Hosts in Aldine (2025)
Learn from the best! This table showcases top-performing Airbnb hosts in Aldine based on the number of properties managed and estimated total revenue over the past year. Analyze their scale and performance metrics.
| Host Name | Properties | Grossing Revenue | Stay Reviews | Avg Rating |
|---|---|---|---|---|
| Rebeca | 4 | $72,203 | 2564 | 4.88/5.0 |
| Stephanie | 1 | $15,380 | 538 | 4.93/5.0 |
| Tatiana | 1 | $13,879 | 91 | 4.73/5.0 |
| Wanda | 2 | $11,350 | 199 | 4.68/5.0 |
| Eduardo | 1 | $8,860 | 69 | 4.90/5.0 |
| Host #465616658 | 1 | $8,739 | 11 | 4.55/5.0 |
| Laura | 1 | $7,808 | 217 | 4.82/5.0 |
| Host #85017713 | 1 | $4,411 | 0 | N/A/5.0 |
| Sandra | 2 | $4,304 | 9 | 4.08/5.0 |
| Host #57556673 | 1 | $4,144 | 1 | N/A/5.0 |
Analyzing the strategies of top hosts, such as their property selection, pricing, and guest communication, can offer valuable lessons for optimizing your own Airbnb operations in Aldine.
Dive Deeper: Advanced Aldine STR Market Data (2025)
Ready to unlock more insights? AirROI provides access to advanced metrics and comprehensive Airbnb data for Aldine. Explore detailed analytics beyond this report to refine your investment strategy, optimize pricing, and maximize your vacation rental profits.
Explore Advanced MetricsAldine Short-Term Rental Market Composition (2025): Property & Room Types
Room Type Distribution
Property Type Distribution
Market Composition Insights for Aldine
- The Aldine Airbnb market composition is heavily skewed towards Entire Home/Apt listings, which make up 75% of the 20 active rentals. This indicates strong guest preference for privacy and space.
- Looking at the property type distribution in Aldine, House properties are the most common (45%), reflecting the local real estate landscape.
- Houses represent a significant 45% portion, catering likely to families or larger groups.
- The presence of 10% Hotel/Boutique listings indicates integration with traditional hospitality.
Aldine Airbnb Room Capacity Analysis (2025): Bedroom Distribution
Distribution of Listings by Number of Bedrooms
Room Capacity Insights for Aldine
- The dominant room capacity in Aldine is 1 bedroom listings, making up 30% of the market. This suggests a strong demand for properties suitable for couples or solo travelers.
- Together, 1 bedroom and 4 bedrooms properties represent 55.0% of the active Airbnb listings in Aldine, indicating a high concentration in these sizes.
- A significant 40.0% of listings offer 3+ bedrooms, catering to larger groups and families seeking more space in Aldine.
Aldine Vacation Rental Guest Capacity Trends (2025)
Distribution of Listings by Guest Capacity
Guest Capacity Insights for Aldine
- The most common guest capacity trend in Aldine vacation rentals is listings accommodating 8+ guests (30%). This suggests the primary traveler segment is likely larger groups.
- Properties designed for 8+ guests and 2 guests dominate the Aldine STR market, accounting for 45.0% of listings.
- 50.0% of properties accommodate 6+ guests, serving the market segment for larger families or group travel in Aldine.
- On average, properties in Aldine are equipped to host 4.8 guests.
Aldine Airbnb Booking Patterns (2025): Available vs. Booked Days
Available Days Distribution
Booked Days Distribution
Booking Pattern Insights for Aldine
- The most common availability pattern in Aldine falls within the 271-366 days range, representing 65% of listings. This suggests many properties have significant open periods on their calendars.
- Approximately 75.0% of listings show high availability (181+ days open annually), indicating potential for increased bookings or specific owner usage patterns.
- For booked days, the 31-90 days range is most frequent in Aldine (35%), reflecting common guest stay durations or potential owner blocking patterns.
- A notable 25.0% of properties secure long booking periods (181+ days booked per year), highlighting successful long-term rental strategies or significant owner usage.
Aldine Airbnb Minimum Stay Requirements Analysis
Distribution of Listings by Minimum Night Requirement
1 Night
12 listings
66.7% of total
2 Nights
4 listings
22.2% of total
4-6 Nights
1 listings
5.6% of total
30+ Nights
1 listings
5.6% of total
Key Insights
- The most prevalent minimum stay requirement in Aldine is 1 Night, adopted by 66.7% of listings. This highlights the market's preference for shorter, flexible bookings.
- A strong majority (88.9%) of the Aldine Airbnb data shows acceptance of very short stays (1-2 nights), indicating a dynamic, high-turnover market.
Recommendations
- Align with the market by considering a 1 Night minimum stay, as 66.7% of Aldine hosts use this setting.
- Explore offering discounts for stays of 30+ nights to attract the 5.6% of the market seeking extended stays.
- Adjust minimum nights based on seasonality – potentially shorter during low season and longer during peak demand periods in Aldine.
Aldine Airbnb Cancellation Policy Trends Analysis (2025)
Flexible
2 listings
11.8% of total
Moderate
5 listings
29.4% of total
Firm
6 listings
35.3% of total
Strict
4 listings
23.5% of total
Cancellation Policy Insights for Aldine
- The prevailing Airbnb cancellation policy trend in Aldine is Firm, used by 35.3% of listings.
- A majority (58.8%) of hosts in Aldine utilize Firm or Strict policies, indicating a market where hosts prioritize booking security.
Recommendations for Hosts
- Consider adopting a Firm policy to align with the 35.3% market standard in Aldine.
- Regularly review your cancellation policy against competitors and market demand shifts in Aldine.
Aldine STR Booking Lead Time Analysis (2025)
Average Booking Lead Time by Month
Booking Lead Time Insights for Aldine
- The overall average booking lead time for vacation rentals in Aldine is 21 days.
- Guests book furthest in advance for stays during May (average 32 days), likely coinciding with peak travel demand or local events.
- The shortest booking windows occur for stays in September (average 14 days), indicating more last-minute travel plans during this time.
- Seasonally, Winter (28 days avg.) sees the longest lead times, while Summer (18 days avg.) has the shortest, reflecting typical travel planning cycles.
Recommendations for Hosts
- Use the overall average lead time (21 days) as a baseline for your pricing and availability strategy in Aldine.
- For May stays, consider implementing length-of-stay discounts or slightly higher rates for bookings made less than 32 days out to capitalize on advance planning.
- Target marketing efforts for the Winter season well in advance (at least 28 days) to capture early planners.
- Monitor your own booking lead times against these Aldine averages to identify opportunities for dynamic pricing adjustments.
Popular & Essential Airbnb Amenities in Aldine (2025)
Amenity Prevalence
Amenity Insights for Aldine
- Essential amenities in Aldine that guests expect include: Wifi, TV, Air conditioning, Free parking on premises, Smoke alarm. Lacking these (any) could significantly impact bookings.
- Popular amenities like Fire extinguisher, Hot water, Heating are common but not universal. Offering these can provide a competitive edge.
Recommendations for Hosts
- Ensure your listing includes all essential amenities for Aldine: Wifi, TV, Air conditioning, Free parking on premises, Smoke alarm.
- Prioritize adding missing essentials: Smoke alarm.
- Consider adding popular differentiators like Fire extinguisher or Hot water to increase appeal.
- Highlight unique or less common amenities you offer (e.g., hot tub, dedicated workspace, EV charger) in your listing description and photos.
- Regularly check competitor amenities in Aldine to stay competitive.
Aldine Airbnb Guest Demographics & Profile Analysis (2025)
Guest Profile Summary for Aldine
- The typical guest profile for Airbnb in Aldine consists of primarily domestic travelers (93%), often arriving from nearby Houston, typically belonging to the Post-2000s (Gen Z/Alpha) group (50%), primarily speaking English or Spanish.
- Domestic travelers account for 92.5% of guests.
- Key international markets include United States (92.5%) and Canada (2.4%).
- Top languages spoken are English (61.8%) followed by Spanish (23.4%).
- A significant demographic segment is the Post-2000s (Gen Z/Alpha) group, representing 50% of guests.
Recommendations for Hosts
- Target domestic marketing efforts towards travelers from Houston and Dallas.
- Tailor amenities and listing descriptions to appeal to the dominant Post-2000s (Gen Z/Alpha) demographic (e.g., highlight fast WiFi, smart home features, local guides).
- Highlight unique local experiences or amenities relevant to the primary guest profile.
- Consider seasonal promotions aligned with peak travel times for key origin markets.
Nearby Short-Term Rental Market Comparison
How does the Aldine Airbnb market stack up against its neighbors? Compare key performance metrics like average monthly revenue, ADR, and occupancy rates in surrounding areas to understand the broader regional STR landscape.
| Market | Active Properties | Monthly Revenue | Daily Rate | Avg. Occupancy |
|---|---|---|---|---|
| Midfield | 10 | $3,817 | $534.05 | 22% |
| Fairfield | 12 | $3,676 | $325.72 | 45% |
| Friendswood | 33 | $3,395 | $339.01 | 50% |
| Columbus | 20 | $3,196 | $373.82 | 29% |
| Jamaica Beach | 206 | $3,161 | $358.62 | 36% |
| Franklin | 11 | $3,146 | $355.40 | 40% |
| Crystal Beach | 157 | $3,024 | $400.30 | 31% |
| Waller | 17 | $2,921 | $308.55 | 44% |
| Hempstead | 20 | $2,754 | $422.26 | 30% |
| Shenandoah | 14 | $2,709 | $211.31 | 58% |