Alamo Heights Airbnb Market Analysis 2025: Short Term Rental Data & Vacation Rental Statistics in Texas, United States
Is Airbnb profitable in Alamo Heights in 2025? Explore comprehensive Airbnb analytics for Alamo Heights, Texas, United States to uncover income potential. This 2025 STR market report for Alamo Heights, based on AirROI data from June 2024 to May 2025, reveals key trends in the niche market of 19 active listings.
Whether you're considering an Airbnb investment in Alamo Heights, optimizing your existing vacation rental, or exploring rental arbitrage opportunities, understanding the Alamo Heights Airbnb data is crucial. Leveraging the low regulation environment is key to maximizing your short term rental income potential. Let's dive into the specifics.
Key Alamo Heights Airbnb Performance Metrics Overview
Monthly Airbnb Revenue Variations & Income Potential in Alamo Heights (2025)
Understanding the monthly revenue variations for Airbnb listings in Alamo Heights is key to maximizing your short term rental income potential. Seasonality significantly impacts earnings. Our analysis, based on data from the past 12 months, shows that the peak revenue month for STRs in Alamo Heights is typically April, while November often presents the lowest earnings, highlighting opportunities for strategic pricing adjustments during shoulder and low seasons. Explore the typical Airbnb income in Alamo Heights across different performance tiers:
- Best-in-class properties (Top 10%) achieve $5,448+ monthly, often utilizing dynamic pricing and superior guest experiences.
- Strong performing properties (Top 25%) earn $3,246 or more, indicating effective management and desirable locations/amenities.
- Typical properties (Median) generate around $2,263 per month, representing the average market performance.
- Entry-level properties (Bottom 25%) see earnings around $1,253, often with potential for optimization.
Average Monthly Airbnb Earnings Trend in Alamo Heights
Alamo Heights Airbnb Occupancy Rate Trends (2025)
Maximize your bookings by understanding the Alamo Heights STR occupancy trends. Seasonal demand shifts significantly influence how often properties are booked. Typically, Februarysees the highest demand (peak season occupancy), while November experiences the lowest (low season). Effective strategies, like adjusting minimum stays or offering promotions, can boost occupancy during slower periods. Here's how different property tiers perform in Alamo Heights:
- Best-in-class properties (Top 10%) achieve 76%+ occupancy, indicating high desirability and potentially optimized availability.
- Strong performing properties (Top 25%) maintain 67% or higher occupancy, suggesting good market fit and guest satisfaction.
- Typical properties (Median) have an occupancy rate around 46%.
- Entry-level properties (Bottom 25%) average 26% occupancy, potentially facing higher vacancy.
Average Monthly Occupancy Rate Trend in Alamo Heights
Average Daily Rate (ADR) Airbnb Trends in Alamo Heights (2025)
Effective short term rental pricing strategy in Alamo Heights involves understanding monthly ADR fluctuations. The Average Daily Rate (ADR) for Airbnb in Alamo Heights typically peaks in May and dips lowest during September. Leveraging Airbnb dynamic pricing tools or strategies based on this seasonality can significantly boost revenue. Here's a look at the typical nightly rates achieved:
- Best-in-class properties (Top 10%) command rates of $429+ per night, often due to premium features or locations.
- Strong performing properties (Top 25%) achieve nightly rates of $228 or more.
- Typical properties (Median) charge around $150 per night.
- Entry-level properties (Bottom 25%) earn around $119 per night.
Average Daily Rate (ADR) Trend by Month in Alamo Heights
Get Live Alamo Heights Market Intelligence 👇

Explore Real-time Analytics
Airbnb Seasonality Analysis & Trends in Alamo Heights (2025)
Peak Season (April, March, February)
- Revenue averages $3,546 per month
- Occupancy rates average 56.5%
- Daily rates average $248
Shoulder Season
- Revenue averages $2,801 per month
- Occupancy maintains around 49.0%
- Daily rates hold near $201
Low Season (June, August, November)
- Revenue drops to average $1,958 per month
- Occupancy decreases to average 34.4%
- Daily rates adjust to average $178
Seasonality Insights for Alamo Heights
- The Airbnb seasonality in Alamo Heights shows highly seasonal trends requiring careful strategy. While the sections above show seasonal averages, it's also insightful to look at the extremes:
- During the high season, the absolute peak month showcases Alamo Heights's highest earning potential, with monthly revenues capable of climbing to $3,803, occupancy reaching a high of 59.7%, and ADRs peaking at $253.
- Conversely, the slowest single month of the year, typically falling within the low season, marks the market's lowest point. In this month, revenue might dip to $1,750, occupancy could drop to 33.8%, and ADRs may adjust down to $175.
- Understanding both the seasonal averages and these monthly peaks and troughs in revenue, occupancy, and ADR is crucial for maximizing your Airbnb profit potential in Alamo Heights.
Seasonal Strategies for Maximizing Profit
- Peak Season: Maximize revenue through premium pricing and potentially longer minimum stays. Ensure high availability.
- Low Season: Offer competitive pricing, special promotions (e.g., extended stay discounts), and flexible cancellation policies. Target off-season travelers like remote workers or budget-conscious guests.
- Shoulder Seasons: Implement dynamic pricing that balances peak and low rates. Target weekend travelers or specific events. Offer slightly more flexible terms than peak season.
- Regularly analyze your own performance against these Alamo Heights seasonality benchmarks and adjust your pricing and availability strategy accordingly.
Best Areas for Airbnb Investment in Alamo Heights (2025)
Exploring the top neighborhoods for short-term rentals in Alamo Heights? This section highlights key areas, outlining why they are attractive for hosts and guests, along with notable local attractions. Consider these locations based on your target guest profile and investment strategy.
| Neighborhood / Area | Why Host Here? (Target Guests & Appeal) | Key Attractions & Landmarks |
|---|---|---|
| Alamo Heights Historic District | Charming area known for its beautiful historic homes and tree-lined streets. Attractive for families and visitors looking for a relaxing stay close to the city. | Landa Library, McNay Art Museum, Alamo Heights Park, San Antonio Country Club, The Shops at Lincoln Heights |
| Alamo Quarry Market | Former brewery turned shopping and dining destination. Popular spot for visitors and locals alike, boasting unique shops and restaurants. | Quarry Market, Alamo Drafthouse Cinema, River Walk access, Art galleries, Public art installations |
| Terrell Hills | Upscale residential community adjacent to Alamo Heights, appealing for those seeking a quiet and safe environment while still being close to city amenities. | Terrell Hills Park, Proximity to Alamo Heights attractions, Local boutiques, Quiet neighborhoods, Scenic streets |
| Olmos Park | Affluent neighborhood known for its beautiful homes and upscale living. Attractive for travelers wanting a high-end experience close to the city. | Olmos Basin Park, Shopping at the Alamo Quarry, Historic architecture, Unique dining, Community events |
| San Antonio Botanical Garden | Popular outdoor space featuring lush gardens and walking trails. Great for nature lovers and families looking for outdoor activities. | Botanical gardens, Lakes and trails, Educational programs, Seasonal events, Picnic areas |
| Brackenridge Park | Large city park with numerous attractions including the San Antonio Zoo. Ideal for families and outdoor enthusiasts. | San Antonio Zoo, Japanese Tea Garden, Brackenridge Park Golf Course, Playgrounds, Hiking trails |
| The Pearl | Trendy area known for its food and drink scene, plus a vibrant market. Great for foodies and those seeking a nightlife experience. | Pearl Brewery, Pearl Farmers Market, Restaurants and bars, River Walk access, Cultural events |
| Downtown San Antonio | Civic and cultural heart of San Antonio, offering a bustling atmosphere with numerous hotels, restaurants, and attractions. Perfect for tourists wanting to stay in the action. | The Alamo, River Walk, San Antonio Market Square, Historic buildings, Cultural institutions |
Understanding Airbnb License Requirements & STR Laws in Alamo Heights (2025)
While Alamo Heights, Texas, United States currently shows low STR regulations, specific Airbnb license requirements might still exist or change. Always verify the latest short term rental regulations and Airbnb license requirements directly with local government authorities for Alamo Heights to ensure full compliance before hosting.
(Source: AirROI data, 2025, based on 5% licensed listings)
Top Performing Airbnb Properties in Alamo Heights (2025)
Benchmark your potential! Explore examples of top-performing Airbnb properties in Alamo Heightsbased on Trailing Twelve Month (TTM) revenue. Analyze their characteristics, revenue, occupancy rate, and ADR to understand what drives success in this market.
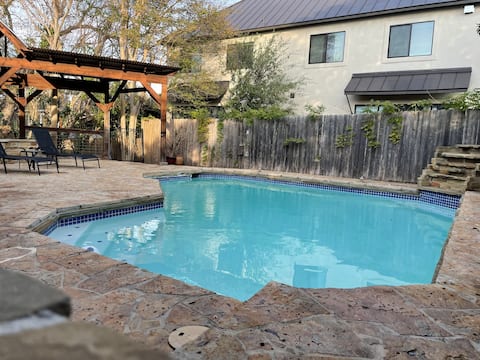
5 Bedroom 4 Bath home with Private Pool & Casita
Entire Place • 5 bedrooms

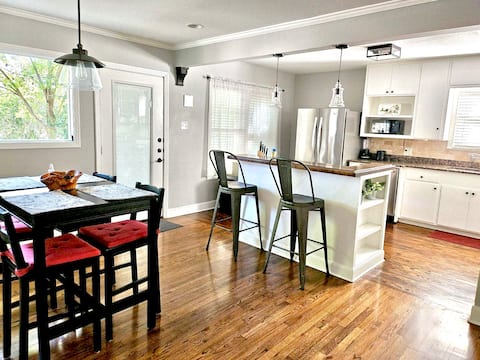
Stylish, Charming Home In The Heart of San Antonio
Entire Place • 2 bedrooms
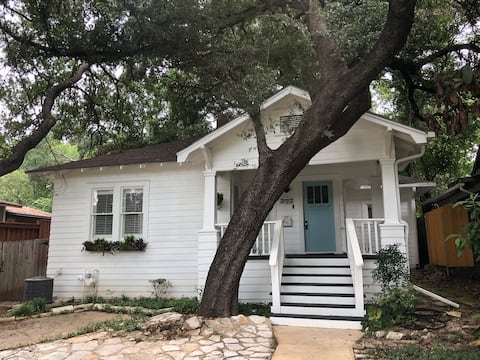
Argo Häuschen Cottage in Alamo Heights, TX
Entire Place • 2 bedrooms

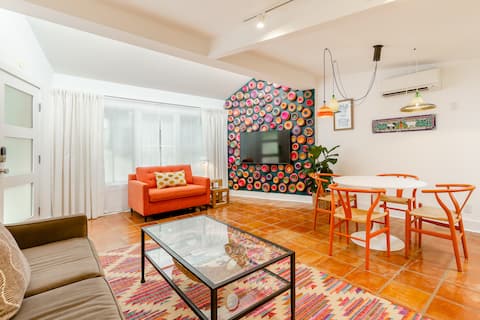
Chic Cottage Home w/ Pool - Centrally Located
Entire Place • 3 bedrooms
Marigold House | Modern Garden Casita
Entire Place • 1 bedroom
Casa Luna
Entire Place • 2 bedrooms
Note: Performance varies based on location, size, amenities, seasonality, and management quality. Data reflects the past 12 months.
Top Performing Airbnb Hosts in Alamo Heights (2025)
Learn from the best! This table showcases top-performing Airbnb hosts in Alamo Heights based on the number of properties managed and estimated total revenue over the past year. Analyze their scale and performance metrics.
| Host Name | Properties | Grossing Revenue | Stay Reviews | Avg Rating |
|---|---|---|---|---|
| Russell | 1 | $99,664 | 146 | 4.95/5.0 |
| Oscar | 1 | $63,293 | 149 | 4.99/5.0 |
| Sue | 4 | $42,062 | 237 | 4.96/5.0 |
| James | 1 | $38,968 | 35 | 4.94/5.0 |
| Kiana | 1 | $37,617 | 45 | 5.00/5.0 |
| Taylor | 1 | $34,356 | 185 | 4.97/5.0 |
| Isabel | 1 | $31,832 | 76 | 4.99/5.0 |
| Kristy | 2 | $30,502 | 12 | 4.90/5.0 |
| Amanda | 1 | $26,865 | 204 | 4.93/5.0 |
| Lisa | 1 | $22,336 | 275 | 4.97/5.0 |
Analyzing the strategies of top hosts, such as their property selection, pricing, and guest communication, can offer valuable lessons for optimizing your own Airbnb operations in Alamo Heights.
Dive Deeper: Advanced Alamo Heights STR Market Data (2025)
Ready to unlock more insights? AirROI provides access to advanced metrics and comprehensive Airbnb data for Alamo Heights. Explore detailed analytics beyond this report to refine your investment strategy, optimize pricing, and maximize your vacation rental profits.
Explore Advanced MetricsAlamo Heights Short-Term Rental Market Composition (2025): Property & Room Types
Room Type Distribution
Property Type Distribution
Market Composition Insights for Alamo Heights
- The Alamo Heights Airbnb market composition is heavily skewed towards Entire Home/Apt listings, which make up 94.7% of the 19 active rentals. This indicates strong guest preference for privacy and space.
- Looking at the property type distribution in Alamo Heights, House properties are the most common (78.9%), reflecting the local real estate landscape.
- Houses represent a significant 78.9% portion, catering likely to families or larger groups.
- The presence of 10.5% Hotel/Boutique listings indicates integration with traditional hospitality.
Alamo Heights Airbnb Room Capacity Analysis (2025): Bedroom Distribution
Distribution of Listings by Number of Bedrooms
Room Capacity Insights for Alamo Heights
- The dominant room capacity in Alamo Heights is 2 bedrooms listings, making up 52.6% of the market. This suggests a strong demand for properties suitable for couples or solo travelers.
- Together, 2 bedrooms and 3 bedrooms properties represent 63.1% of the active Airbnb listings in Alamo Heights, indicating a high concentration in these sizes.
Alamo Heights Vacation Rental Guest Capacity Trends (2025)
Distribution of Listings by Guest Capacity
Guest Capacity Insights for Alamo Heights
- The most common guest capacity trend in Alamo Heights vacation rentals is listings accommodating 4 guests (26.3%). This suggests the primary traveler segment is likely small families or groups.
- Properties designed for 4 guests and 6 guests dominate the Alamo Heights STR market, accounting for 52.6% of listings.
- 36.8% of properties accommodate 6+ guests, serving the market segment for larger families or group travel in Alamo Heights.
- On average, properties in Alamo Heights are equipped to host 4.4 guests.
Alamo Heights Airbnb Booking Patterns (2025): Available vs. Booked Days
Available Days Distribution
Booked Days Distribution
Booking Pattern Insights for Alamo Heights
- The most common availability pattern in Alamo Heights falls within the 271-366 days range, representing 42.1% of listings. This suggests many properties have significant open periods on their calendars.
- Approximately 73.7% of listings show high availability (181+ days open annually), indicating potential for increased bookings or specific owner usage patterns.
- For booked days, the 91-180 days range is most frequent in Alamo Heights (42.1%), reflecting common guest stay durations or potential owner blocking patterns.
- A notable 26.4% of properties secure long booking periods (181+ days booked per year), highlighting successful long-term rental strategies or significant owner usage.
Alamo Heights Airbnb Minimum Stay Requirements Analysis
Distribution of Listings by Minimum Night Requirement
1 Night
3 listings
16.7% of total
2 Nights
6 listings
33.3% of total
3 Nights
5 listings
27.8% of total
4-6 Nights
1 listings
5.6% of total
7-29 Nights
1 listings
5.6% of total
30+ Nights
2 listings
11.1% of total
Key Insights
- The most prevalent minimum stay requirement in Alamo Heights is 2 Nights, adopted by 33.3% of listings. This highlights the market's preference for shorter, flexible bookings.
- A significant segment (11.1%) caters to monthly stays (30+ nights) in Alamo Heights, pointing to opportunities in the extended-stay market.
Recommendations
- Align with the market by considering a 2 Nights minimum stay, as 33.3% of Alamo Heights hosts use this setting.
- If feasible, allowing 1-night stays, especially midweek or during low season, could capture last-minute bookings, as only 16.7% currently do.
- A 2-night minimum appears standard (33.3%). Consider this for weekends or peak periods.
- Explore offering discounts for stays of 30+ nights to attract the 11.1% of the market seeking extended stays.
- Adjust minimum nights based on seasonality – potentially shorter during low season and longer during peak demand periods in Alamo Heights.
Alamo Heights Airbnb Cancellation Policy Trends Analysis (2025)
Flexible
9 listings
47.4% of total
Moderate
5 listings
26.3% of total
Firm
2 listings
10.5% of total
Strict
3 listings
15.8% of total
Cancellation Policy Insights for Alamo Heights
- The prevailing Airbnb cancellation policy trend in Alamo Heights is Flexible, used by 47.4% of listings.
- The market strongly favors guest-friendly terms, with 73.7% of listings offering Flexible or Moderate policies. This suggests guests in Alamo Heights may expect booking flexibility.
Recommendations for Hosts
- Consider adopting a Flexible policy to align with the 47.4% market standard in Alamo Heights.
- Regularly review your cancellation policy against competitors and market demand shifts in Alamo Heights.
Alamo Heights STR Booking Lead Time Analysis (2025)
Average Booking Lead Time by Month
Booking Lead Time Insights for Alamo Heights
- The overall average booking lead time for vacation rentals in Alamo Heights is 29 days.
- Guests book furthest in advance for stays during April (average 54 days), likely coinciding with peak travel demand or local events.
- The shortest booking windows occur for stays in February (average 23 days), indicating more last-minute travel plans during this time.
- Seasonally, Spring (41 days avg.) sees the longest lead times, while Winter (25 days avg.) has the shortest, reflecting typical travel planning cycles.
Recommendations for Hosts
- Use the overall average lead time (29 days) as a baseline for your pricing and availability strategy in Alamo Heights.
- For April stays, consider implementing length-of-stay discounts or slightly higher rates for bookings made less than 54 days out to capitalize on advance planning.
- Target marketing efforts for the Spring season well in advance (at least 41 days) to capture early planners.
- Monitor your own booking lead times against these Alamo Heights averages to identify opportunities for dynamic pricing adjustments.
Popular & Essential Airbnb Amenities in Alamo Heights (2025)
Amenity Prevalence
Amenity Insights for Alamo Heights
- Essential amenities in Alamo Heights that guests expect include: Air conditioning, Free parking on premises, Wifi, Smoke alarm, Heating. Lacking these (any) could significantly impact bookings.
- Popular amenities like First aid kit, Hair dryer, Bed linens are common but not universal. Offering these can provide a competitive edge.
Recommendations for Hosts
- Ensure your listing includes all essential amenities for Alamo Heights: Air conditioning, Free parking on premises, Wifi, Smoke alarm, Heating.
- Consider adding popular differentiators like First aid kit or Hair dryer to increase appeal.
- Highlight unique or less common amenities you offer (e.g., hot tub, dedicated workspace, EV charger) in your listing description and photos.
- Regularly check competitor amenities in Alamo Heights to stay competitive.
Alamo Heights Airbnb Guest Demographics & Profile Analysis (2025)
Guest Profile Summary for Alamo Heights
- The typical guest profile for Airbnb in Alamo Heights consists of primarily domestic travelers (95%), often arriving from nearby Austin, typically belonging to the Post-2000s (Gen Z/Alpha) group (50%), primarily speaking English or Spanish.
- Domestic travelers account for 94.7% of guests.
- Key international markets include United States (94.7%) and Ireland (1.2%).
- Top languages spoken are English (58.5%) followed by Spanish (14%).
- A significant demographic segment is the Post-2000s (Gen Z/Alpha) group, representing 50% of guests.
Recommendations for Hosts
- Target domestic marketing efforts towards travelers from Austin and San Antonio.
- Tailor amenities and listing descriptions to appeal to the dominant Post-2000s (Gen Z/Alpha) demographic (e.g., highlight fast WiFi, smart home features, local guides).
- Highlight unique local experiences or amenities relevant to the primary guest profile.
- Consider seasonal promotions aligned with peak travel times for key origin markets.
Nearby Short-Term Rental Market Comparison
How does the Alamo Heights Airbnb market stack up against its neighbors? Compare key performance metrics like average monthly revenue, ADR, and occupancy rates in surrounding areas to understand the broader regional STR landscape.
| Market | Active Properties | Monthly Revenue | Daily Rate | Avg. Occupancy |
|---|---|---|---|---|
| Jonestown | 63 | $5,090 | $507.48 | 31% |
| Hudson Bend | 65 | $4,407 | $527.36 | 30% |
| West Lake Hills | 23 | $4,206 | $736.27 | 30% |
| Helotes | 48 | $3,582 | $350.14 | 41% |
| Volente | 22 | $3,510 | $438.32 | 31% |
| Dripping Springs | 420 | $3,434 | $388.79 | 34% |
| Briarcliff | 40 | $3,394 | $393.95 | 30% |
| Kingsland | 267 | $3,379 | $528.30 | 26% |
| Martindale | 41 | $3,247 | $382.53 | 32% |
| Cottonwood Shores | 24 | $3,222 | $346.87 | 37% |