North Union Township Airbnb Market Analysis 2025: Short Term Rental Data & Vacation Rental Statistics in Pennsylvania, United States
Is Airbnb profitable in North Union Township in 2025? Explore comprehensive Airbnb analytics for North Union Township, Pennsylvania, United States to uncover income potential. This 2025 STR market report for North Union Township, based on AirROI data from April 2024 to March 2025, reveals key trends in the niche market of 18 active listings.
Whether you're considering an Airbnb investment in North Union Township, optimizing your existing vacation rental, or exploring rental arbitrage opportunities, understanding the North Union Township Airbnb data is crucial. Leveraging the low regulation environment is key to maximizing your short term rental income potential. Let's dive into the specifics.
Key North Union Township Airbnb Performance Metrics Overview
Monthly Airbnb Revenue Variations & Income Potential in North Union Township (2025)
Understanding the monthly revenue variations for Airbnb listings in North Union Township is key to maximizing your short term rental income potential. Seasonality significantly impacts earnings. Our analysis, based on data from the past 12 months, shows that the peak revenue month for STRs in North Union Township is typically June, while January often presents the lowest earnings, highlighting opportunities for strategic pricing adjustments during shoulder and low seasons. Explore the typical Airbnb income in North Union Township across different performance tiers:
- Best-in-class properties (Top 10%) achieve $3,858+ monthly, often utilizing dynamic pricing and superior guest experiences.
- Strong performing properties (Top 25%) earn $2,152 or more, indicating effective management and desirable locations/amenities.
- Typical properties (Median) generate around $1,191 per month, representing the average market performance.
- Entry-level properties (Bottom 25%) see earnings around $742, often with potential for optimization.
Average Monthly Airbnb Earnings Trend in North Union Township
North Union Township Airbnb Occupancy Rate Trends (2025)
Maximize your bookings by understanding the North Union Township STR occupancy trends. Seasonal demand shifts significantly influence how often properties are booked. Typically, Julysees the highest demand (peak season occupancy), while February experiences the lowest (low season). Effective strategies, like adjusting minimum stays or offering promotions, can boost occupancy during slower periods. Here's how different property tiers perform in North Union Township:
- Best-in-class properties (Top 10%) achieve 67%+ occupancy, indicating high desirability and potentially optimized availability.
- Strong performing properties (Top 25%) maintain 56% or higher occupancy, suggesting good market fit and guest satisfaction.
- Typical properties (Median) have an occupancy rate around 37%.
- Entry-level properties (Bottom 25%) average 21% occupancy, potentially facing higher vacancy.
Average Monthly Occupancy Rate Trend in North Union Township
Average Daily Rate (ADR) Airbnb Trends in North Union Township (2025)
Effective short term rental pricing strategy in North Union Township involves understanding monthly ADR fluctuations. The Average Daily Rate (ADR) for Airbnb in North Union Township typically peaks in June and dips lowest during December. Leveraging Airbnb dynamic pricing tools or strategies based on this seasonality can significantly boost revenue. Here's a look at the typical nightly rates achieved:
- Best-in-class properties (Top 10%) command rates of $313+ per night, often due to premium features or locations.
- Strong performing properties (Top 25%) achieve nightly rates of $142 or more.
- Typical properties (Median) charge around $81 per night.
- Entry-level properties (Bottom 25%) earn around $61 per night.
Average Daily Rate (ADR) Trend by Month in North Union Township
Get Live North Union Township Market Intelligence 👇

Explore Real-time Analytics
Airbnb Seasonality Analysis & Trends in North Union Township (2025)
Peak Season (June, July, May)
- Revenue averages $2,149 per month
- Occupancy rates average 49.1%
- Daily rates average $141
Shoulder Season
- Revenue averages $1,653 per month
- Occupancy maintains around 37.7%
- Daily rates hold near $131
Low Season (January, March, April)
- Revenue drops to average $1,416 per month
- Occupancy decreases to average 33.4%
- Daily rates adjust to average $129
Seasonality Insights for North Union Township
- The Airbnb seasonality in North Union Township shows moderate seasonality with distinct peak and low periods. While the sections above show seasonal averages, it's also insightful to look at the extremes:
- During the high season, the absolute peak month showcases North Union Township's highest earning potential, with monthly revenues capable of climbing to $2,354, occupancy reaching a high of 57.4%, and ADRs peaking at $143.
- Conversely, the slowest single month of the year, typically falling within the low season, marks the market's lowest point. In this month, revenue might dip to $1,272, occupancy could drop to 26.3%, and ADRs may adjust down to $122.
- Understanding both the seasonal averages and these monthly peaks and troughs in revenue, occupancy, and ADR is crucial for maximizing your Airbnb profit potential in North Union Township.
Seasonal Strategies for Maximizing Profit
- Peak Season: Maximize revenue through premium pricing and potentially longer minimum stays. Ensure high availability.
- Low Season: Offer competitive pricing, special promotions (e.g., extended stay discounts), and flexible cancellation policies. Target off-season travelers like remote workers or budget-conscious guests.
- Shoulder Seasons: Implement dynamic pricing that balances peak and low rates. Target weekend travelers or specific events. Offer slightly more flexible terms than peak season.
- Regularly analyze your own performance against these North Union Township seasonality benchmarks and adjust your pricing and availability strategy accordingly.
Best Areas for Airbnb Investment in North Union Township (2025)
Exploring the top neighborhoods for short-term rentals in North Union Township? This section highlights key areas, outlining why they are attractive for hosts and guests, along with notable local attractions. Consider these locations based on your target guest profile and investment strategy.
| Neighborhood / Area | Why Host Here? (Target Guests & Appeal) | Key Attractions & Landmarks |
|---|---|---|
| Union Township Recreation Center | A perfect spot for families visiting for outdoor activities and community events. Offers access to sports fields and recreational facilities. | Union Township Park, Nearby hiking trails, Local sports events, Community festivals |
| Nearby Pittsburgh | Close to the cultural and economic hub of Pittsburgh, attracting visitors for business and leisure. | Andy Warhol Museum, Point State Park, Pittsburgh Zoo, Heinz Field, Cultural District, Carnegie Museum of Art |
| California University of Pennsylvania | Attracts students and visitors during school events, conferences, and sports games. Popular among parents visiting for ceremonies or campus events. | California University Campus, Local dining and shopping, Annual commencement events, Sporting events |
| Monongahela River | Scenic river location with opportunities for boating and fishing, appealing to those looking for a relaxing getaway. | Parks along the river, Fishing spots, Biking trails, Scenic views and picnic areas |
| Local Wineries | Pennsylvania is known for its vineyards and wineries, attracting wine enthusiasts and tourists looking for unique experiences. | Wine tastings, Tours of local vineyards, Wine festivals, Scenic drives through the vineyards |
| Historic Downtown Belle Vernon | Charming downtown area with unique shops and eateries, attracting visitors interested in local culture and history. | Local diners, Historic architecture, Community events, Shopping in unique boutiques |
| Geyer Performing Arts Center | A hub for entertainment and performances, drawing guests looking for cultural experiences and live shows. | Theater performances, Community events, Music concerts, Art shows |
| State Parks | Close proximity to several state parks offers opportunities for hiking, camping, and nature lovers, attracting outdoor enthusiasts. | Ohiopyle State Park, Little Beaver State Park, Pine Creek Gorge, Rivers and hiking trails |
Understanding Airbnb License Requirements & STR Laws in North Union Township (2025)
While North Union Township, Pennsylvania, United States currently shows low STR regulations, specific Airbnb license requirements might still exist or change. Always verify the latest short term rental regulations and Airbnb license requirements directly with local government authorities for North Union Township to ensure full compliance before hosting.
(Source: AirROI data, 2025, finding no licensed listings among those analyzed)
Top Performing Airbnb Properties in North Union Township (2025)
Benchmark your potential! Explore examples of top-performing Airbnb properties in North Union Townshipbased on Trailing Twelve Month (TTM) revenue. Analyze their characteristics, revenue, occupancy rate, and ADR to understand what drives success in this market.
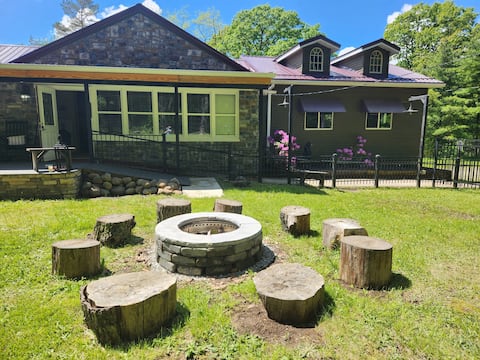
The Kalli-Ru minutes from Ohiopyle, Fallingwater
Entire Place • 4 bedrooms
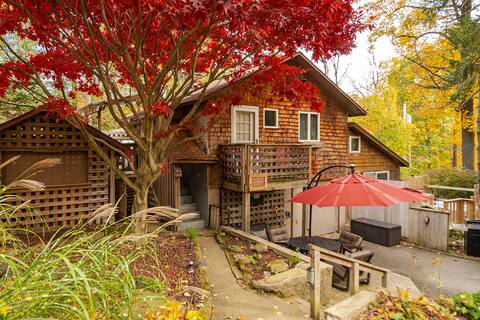
Hygge House | 1BR,1BA, Hot Tub, Dog Friendly
Entire Place • 1 bedroom

Five Bears Lodge at Eagle Rock Resort
Entire Place • 5 bedrooms
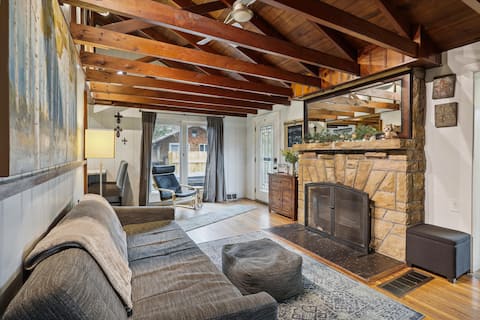
Tiny Casita | 1BR, 1BA, Loft Tiny Home, Hot Tub
Entire Place • 1 bedroom
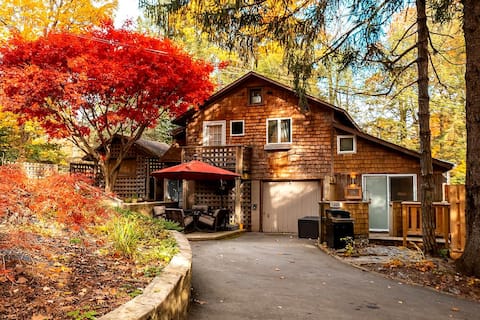
1BR Cozy Cottage close to Ohiopyle State Park!
Entire Place • 1 bedroom
Orlyn's Place Charming
Private Room • 1 bedroom
Note: Performance varies based on location, size, amenities, seasonality, and management quality. Data reflects the past 12 months.
Top Performing Airbnb Hosts in North Union Township (2025)
Learn from the best! This table showcases top-performing Airbnb hosts in North Union Township based on the number of properties managed and estimated total revenue over the past year. Analyze their scale and performance metrics.
| Host Name | Properties | Grossing Revenue | Stay Reviews | Avg Rating |
|---|---|---|---|---|
| Orlyn | 8 | $72,851 | 254 | 4.77/5.0 |
| Ohiopyle Vacation Rentals | 3 | $68,661 | 181 | 4.60/5.0 |
| Keithette M | 1 | $55,553 | 35 | 5.00/5.0 |
| William | 1 | $28,452 | 19 | 4.89/5.0 |
| Chandra | 2 | $16,576 | 13 | 5.00/5.0 |
| Linda | 1 | $12,814 | 12 | 4.83/5.0 |
| Host #57254612 | 1 | $12,339 | 286 | 4.98/5.0 |
| Shanda And Keith | 1 | $6,857 | 304 | 4.96/5.0 |
Analyzing the strategies of top hosts, such as their property selection, pricing, and guest communication, can offer valuable lessons for optimizing your own Airbnb operations in North Union Township.
Dive Deeper: Advanced North Union Township STR Market Data (2025)
Ready to unlock more insights? AirROI provides access to advanced metrics and comprehensive Airbnb data for North Union Township. Explore detailed analytics beyond this report to refine your investment strategy, optimize pricing, and maximize your vacation rental profits.
Explore Advanced MetricsNorth Union Township Short-Term Rental Market Composition (2025): Property & Room Types
Room Type Distribution
Property Type Distribution
Market Composition Insights for North Union Township
- The North Union Township Airbnb market composition is heavily skewed towards Private Room listings, which make up 61.1% of the 18 active rentals. This indicates strong guest preference for privacy and space.
- Looking at the property type distribution in North Union Township, House properties are the most common (50%), reflecting the local real estate landscape.
- Houses represent a significant 50% portion, catering likely to families or larger groups.
- The presence of 44.4% Hotel/Boutique listings indicates integration with traditional hospitality.
North Union Township Airbnb Room Capacity Analysis (2025): Bedroom Distribution
Distribution of Listings by Number of Bedrooms
Room Capacity Insights for North Union Township
- The dominant room capacity in North Union Township is 1 bedroom listings, making up 72.2% of the market. This suggests a strong demand for properties suitable for couples or solo travelers.
- Together, 1 bedroom and 2 bedrooms properties represent 83.3% of the active Airbnb listings in North Union Township, indicating a high concentration in these sizes.
- With over half the market (72.2%) consisting of studios or 1-bedroom units, North Union Township is particularly well-suited for individuals or couples.
North Union Township Vacation Rental Guest Capacity Trends (2025)
Distribution of Listings by Guest Capacity
Guest Capacity Insights for North Union Township
- The most common guest capacity trend in North Union Township vacation rentals is listings accommodating 2 guests (61.1%). This suggests the primary traveler segment is likely couples or solo travelers.
- Properties designed for 2 guests and 4 guests dominate the North Union Township STR market, accounting for 77.8% of listings.
- A significant 61.1% of listings cater specifically to 1-2 guests, highlighting strong demand from couples and solo travelers in North Union Township.
- 11.1% of properties accommodate 6+ guests, serving the market segment for larger families or group travel in North Union Township.
- On average, properties in North Union Township are equipped to host 2.8 guests.
North Union Township Airbnb Booking Patterns (2025): Available vs. Booked Days
Available Days Distribution
Booked Days Distribution
Booking Pattern Insights for North Union Township
- The most common availability pattern in North Union Township falls within the 181-270 days range, representing 61.1% of listings. This suggests many properties have significant open periods on their calendars.
- Approximately 83.3% of listings show high availability (181+ days open annually), indicating potential for increased bookings or specific owner usage patterns.
- For booked days, the 91-180 days range is most frequent in North Union Township (61.1%), reflecting common guest stay durations or potential owner blocking patterns.
- A notable 16.7% of properties secure long booking periods (181+ days booked per year), highlighting successful long-term rental strategies or significant owner usage.
North Union Township Airbnb Minimum Stay Requirements Analysis
Distribution of Listings by Minimum Night Requirement
1 Night
11 listings
78.6% of total
2 Nights
3 listings
21.4% of total
Key Insights
- The most prevalent minimum stay requirement in North Union Township is 1 Night, adopted by 78.6% of listings. This highlights the market's preference for shorter, flexible bookings.
- A strong majority (100.0%) of the North Union Township Airbnb data shows acceptance of very short stays (1-2 nights), indicating a dynamic, high-turnover market.
Recommendations
- Align with the market by considering a 1 Night minimum stay, as 78.6% of North Union Township hosts use this setting.
- Adjust minimum nights based on seasonality – potentially shorter during low season and longer during peak demand periods in North Union Township.
North Union Township Airbnb Cancellation Policy Trends Analysis (2025)
Flexible
11 listings
68.8% of total
Moderate
3 listings
18.8% of total
Firm
1 listings
6.3% of total
Strict
1 listings
6.3% of total
Cancellation Policy Insights for North Union Township
- The prevailing Airbnb cancellation policy trend in North Union Township is Flexible, used by 68.8% of listings.
- The market strongly favors guest-friendly terms, with 87.6% of listings offering Flexible or Moderate policies. This suggests guests in North Union Township may expect booking flexibility.
- Strict cancellation policies are quite rare (6.3%), potentially making listings with this policy less competitive unless justified by high demand or property type.
Recommendations for Hosts
- Consider adopting a Flexible policy to align with the 68.8% market standard in North Union Township.
- Given the high prevalence of Flexible policies (68.8%), offering this can enhance booking appeal, especially during shoulder seasons.
- Using a Strict policy might deter some guests, as only 6.3% of listings use it. Evaluate if potential revenue protection outweighs possible lower booking rates.
- Regularly review your cancellation policy against competitors and market demand shifts in North Union Township.
North Union Township STR Booking Lead Time Analysis (2025)
Average Booking Lead Time by Month
Booking Lead Time Insights for North Union Township
- The overall average booking lead time for vacation rentals in North Union Township is 50 days.
- Guests book furthest in advance for stays during December (average 87 days), likely coinciding with peak travel demand or local events.
- The shortest booking windows occur for stays in April (average 41 days), indicating more last-minute travel plans during this time.
- Seasonally, Winter (76 days avg.) sees the longest lead times, while Spring (57 days avg.) has the shortest, reflecting typical travel planning cycles.
Recommendations for Hosts
- Use the overall average lead time (50 days) as a baseline for your pricing and availability strategy in North Union Township.
- For December stays, consider implementing length-of-stay discounts or slightly higher rates for bookings made less than 87 days out to capitalize on advance planning.
- Target marketing efforts for the Winter season well in advance (at least 76 days) to capture early planners.
- Monitor your own booking lead times against these North Union Township averages to identify opportunities for dynamic pricing adjustments.
Popular & Essential Airbnb Amenities in North Union Township (2025)
Amenity Prevalence
Amenity Insights for North Union Township
- Essential amenities in North Union Township that guests expect include: Smoke alarm, Air conditioning, Wifi, TV, Free parking on premises. Lacking these (any) could significantly impact bookings.
- Popular amenities like Hot water, Fire extinguisher, Heating are common but not universal. Offering these can provide a competitive edge.
Recommendations for Hosts
- Ensure your listing includes all essential amenities for North Union Township: Smoke alarm, Air conditioning, Wifi, TV, Free parking on premises.
- Consider adding popular differentiators like Hot water or Fire extinguisher to increase appeal.
- Highlight unique or less common amenities you offer (e.g., hot tub, dedicated workspace, EV charger) in your listing description and photos.
- Regularly check competitor amenities in North Union Township to stay competitive.
North Union Township Airbnb Guest Demographics & Profile Analysis (2025)
Guest Profile Summary for North Union Township
- The typical guest profile for Airbnb in North Union Township consists of primarily domestic travelers (93%), often arriving from nearby Pittsburgh, typically belonging to the Post-2000s (Gen Z/Alpha) group (50%), primarily speaking English or Spanish.
- Domestic travelers account for 93.4% of guests.
- Key international markets include United States (93.4%) and Canada (3.6%).
- Top languages spoken are English (78.3%) followed by Spanish (7.6%).
- A significant demographic segment is the Post-2000s (Gen Z/Alpha) group, representing 50% of guests.
Recommendations for Hosts
- Target domestic marketing efforts towards travelers from Pittsburgh and Erie.
- Tailor amenities and listing descriptions to appeal to the dominant Post-2000s (Gen Z/Alpha) demographic (e.g., highlight fast WiFi, smart home features, local guides).
- Highlight unique local experiences or amenities relevant to the primary guest profile.
- Consider seasonal promotions aligned with peak travel times for key origin markets.
Nearby Short-Term Rental Market Comparison
How does the North Union Township Airbnb market stack up against its neighbors? Compare key performance metrics like average monthly revenue, ADR, and occupancy rates in surrounding areas to understand the broader regional STR landscape.
| Market | Active Properties | Monthly Revenue | Daily Rate | Avg. Occupancy |
|---|---|---|---|---|
| Lemont | 22 | $8,558 | $812.80 | 42% |
| State College | 158 | $7,525 | $751.34 | 44% |
| Ferguson Township | 120 | $5,810 | $785.97 | 40% |
| College Township | 65 | $5,752 | $809.46 | 40% |
| Shannondale | 47 | $5,288 | $292.94 | 56% |
| Benner Township | 67 | $5,036 | $564.36 | 42% |
| Friendsville | 12 | $5,012 | $493.24 | 39% |
| Halfmoon Township | 17 | $4,992 | $691.16 | 36% |
| Patton Township | 183 | $4,682 | $646.54 | 39% |
| Travilah | 10 | $4,650 | $414.77 | 47% |