Hebron Township Airbnb Market Analysis 2025: Short Term Rental Data & Vacation Rental Statistics in Pennsylvania, United States
Is Airbnb profitable in Hebron Township in 2025? Explore comprehensive Airbnb analytics for Hebron Township, Pennsylvania, United States to uncover income potential. This 2025 STR market report for Hebron Township, based on AirROI data from April 2024 to March 2025, reveals key trends in the niche market of 17 active listings.
Whether you're considering an Airbnb investment in Hebron Township, optimizing your existing vacation rental, or exploring rental arbitrage opportunities, understanding the Hebron Township Airbnb data is crucial. Leveraging the low regulation environment is key to maximizing your short term rental income potential. Let's dive into the specifics.
Key Hebron Township Airbnb Performance Metrics Overview
Monthly Airbnb Revenue Variations & Income Potential in Hebron Township (2025)
Understanding the monthly revenue variations for Airbnb listings in Hebron Township is key to maximizing your short term rental income potential. Seasonality significantly impacts earnings. Our analysis, based on data from the past 12 months, shows that the peak revenue month for STRs in Hebron Township is typically June, while February often presents the lowest earnings, highlighting opportunities for strategic pricing adjustments during shoulder and low seasons. Explore the typical Airbnb income in Hebron Township across different performance tiers:
- Best-in-class properties (Top 10%) achieve $5,581+ monthly, often utilizing dynamic pricing and superior guest experiences.
- Strong performing properties (Top 25%) earn $2,781 or more, indicating effective management and desirable locations/amenities.
- Typical properties (Median) generate around $1,226 per month, representing the average market performance.
- Entry-level properties (Bottom 25%) see earnings around $546, often with potential for optimization.
Average Monthly Airbnb Earnings Trend in Hebron Township
Hebron Township Airbnb Occupancy Rate Trends (2025)
Maximize your bookings by understanding the Hebron Township STR occupancy trends. Seasonal demand shifts significantly influence how often properties are booked. Typically, Junesees the highest demand (peak season occupancy), while February experiences the lowest (low season). Effective strategies, like adjusting minimum stays or offering promotions, can boost occupancy during slower periods. Here's how different property tiers perform in Hebron Township:
- Best-in-class properties (Top 10%) achieve 70%+ occupancy, indicating high desirability and potentially optimized availability.
- Strong performing properties (Top 25%) maintain 45% or higher occupancy, suggesting good market fit and guest satisfaction.
- Typical properties (Median) have an occupancy rate around 23%.
- Entry-level properties (Bottom 25%) average 10% occupancy, potentially facing higher vacancy.
Average Monthly Occupancy Rate Trend in Hebron Township
Average Daily Rate (ADR) Airbnb Trends in Hebron Township (2025)
Effective short term rental pricing strategy in Hebron Township involves understanding monthly ADR fluctuations. The Average Daily Rate (ADR) for Airbnb in Hebron Township typically peaks in June and dips lowest during February. Leveraging Airbnb dynamic pricing tools or strategies based on this seasonality can significantly boost revenue. Here's a look at the typical nightly rates achieved:
- Best-in-class properties (Top 10%) command rates of $256+ per night, often due to premium features or locations.
- Strong performing properties (Top 25%) achieve nightly rates of $188 or more.
- Typical properties (Median) charge around $156 per night.
- Entry-level properties (Bottom 25%) earn around $138 per night.
Average Daily Rate (ADR) Trend by Month in Hebron Township
Get Live Hebron Township Market Intelligence 👇

Explore Real-time Analytics
Airbnb Seasonality Analysis & Trends in Hebron Township (2025)
Peak Season (June, May, July)
- Revenue averages $2,917 per month
- Occupancy rates average 37.7%
- Daily rates average $179
Shoulder Season
- Revenue averages $2,331 per month
- Occupancy maintains around 34.4%
- Daily rates hold near $172
Low Season (February, April, September)
- Revenue drops to average $1,680 per month
- Occupancy decreases to average 20.7%
- Daily rates adjust to average $170
Seasonality Insights for Hebron Township
- The Airbnb seasonality in Hebron Township shows highly seasonal trends requiring careful strategy. While the sections above show seasonal averages, it's also insightful to look at the extremes:
- During the high season, the absolute peak month showcases Hebron Township's highest earning potential, with monthly revenues capable of climbing to $3,253, occupancy reaching a high of 46.9%, and ADRs peaking at $181.
- Conversely, the slowest single month of the year, typically falling within the low season, marks the market's lowest point. In this month, revenue might dip to $1,514, occupancy could drop to 13.6%, and ADRs may adjust down to $165.
- Understanding both the seasonal averages and these monthly peaks and troughs in revenue, occupancy, and ADR is crucial for maximizing your Airbnb profit potential in Hebron Township.
Seasonal Strategies for Maximizing Profit
- Peak Season: Maximize revenue through premium pricing and potentially longer minimum stays. Ensure high availability.
- Low Season: Offer competitive pricing, special promotions (e.g., extended stay discounts), and flexible cancellation policies. Target off-season travelers like remote workers or budget-conscious guests.
- Shoulder Seasons: Implement dynamic pricing that balances peak and low rates. Target weekend travelers or specific events. Offer slightly more flexible terms than peak season.
- Regularly analyze your own performance against these Hebron Township seasonality benchmarks and adjust your pricing and availability strategy accordingly.
Best Areas for Airbnb Investment in Hebron Township (2025)
Exploring the top neighborhoods for short-term rentals in Hebron Township? This section highlights key areas, outlining why they are attractive for hosts and guests, along with notable local attractions. Consider these locations based on your target guest profile and investment strategy.
| Neighborhood / Area | Why Host Here? (Target Guests & Appeal) | Key Attractions & Landmarks |
|---|---|---|
| Historic Bethlehem | A charming town filled with historic sites, arts and culture. Its Christmas festivities attract visitors year-round, making it a prime location for Airbnb hosting. | Bethlehem SteelStacks, Moravian Museum, Historic Bethlehem Museum & Sites, Burnside Plantation, The Lehigh River |
| Allentown | As the third largest city in Pennsylvania, it offers urban amenities and is close to attractions like the Lehigh Valley Zoo, making it great for both business and leisure travelers. | Allentown Art Museum, Dorney Park & Wildwater Kingdom, Allentown Fairgrounds, Mack Truck Historical Museum, Cedar Beach Park |
| Jim Thorpe | Known as the 'Switzerland of America', this town is famous for its outdoor activities and stunning scenery, drawing nature lovers and adventure enthusiasts. | Lehigh Gorge State Park, Old Jail Museum, Mauch Chunk Opera House, Bicycle trails, Saengerbund Hall |
| Poconos | A year-round destination with ski resorts, lakes, and hiking trails. Ideal for those looking to host guests seeking relaxation or adventure in nature. | Camelback Mountain Resort, Lake Wallenpaupack, Kalahari Indoor Waterpark, Big Pocono State Park, Delaware Water Gap |
| Harrisburg | The state capital with rich history and cultural attractions. It attracts government officials and tourists alike, making it a solid choice for Airbnb hosts. | Pennsylvania State Capitol, The National Civil War Museum, Harrisburg Museum, City Island, Susquehanna Riverwalk |
| Lancaster | Known for its Amish community and rich farmland, Lancaster draws visitors interested in cultural experiences and local craftsmanship. | The Amish Farm and House, Dutch Wonderland, Lancaster Central Market, The Sight and Sound Theatre, Fulton Theatre |
| Scranton | Famous for its history with coal mining, Scranton also offers a vibrant arts scene and is the home of many attractions linked to the hit TV show 'The Office.' | Steamtown National Historic Site, The Electric City Trolley Museum, Lackawanna Coal Mine Tour, Everhart Museum |
| Reading | A diverse city that hosts events throughout the year, including the Reading Pagoda and the nearby outdoor activities, it is becoming popular among tourists and business travelers. | Reading Public Museum, The Pagoda, Lake Ontelaunee, VF Outlets, Gring's Mill Recreation Area |
Understanding Airbnb License Requirements & STR Laws in Hebron Township (2025)
While Hebron Township, Pennsylvania, United States currently shows low STR regulations, specific Airbnb license requirements might still exist or change. Always verify the latest short term rental regulations and Airbnb license requirements directly with local government authorities for Hebron Township to ensure full compliance before hosting.
(Source: AirROI data, 2025, finding no licensed listings among those analyzed)
Top Performing Airbnb Properties in Hebron Township (2025)
Benchmark your potential! Explore examples of top-performing Airbnb properties in Hebron Townshipbased on Trailing Twelve Month (TTM) revenue. Analyze their characteristics, revenue, occupancy rate, and ADR to understand what drives success in this market.
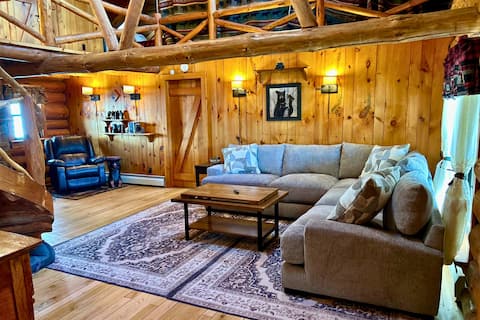
Quaint Log Cabin | Dark Skies PA Retreat w/Hot Tub
Entire Place • 3 bedrooms
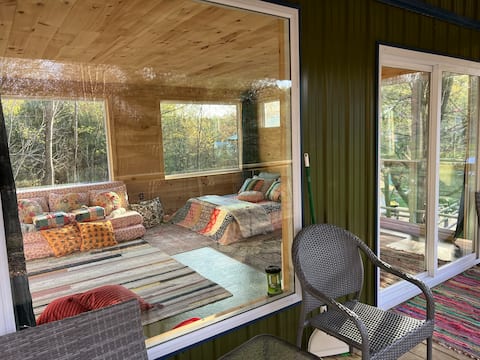
Serenity Cabin by Stargazing Field
Entire Place • N/A

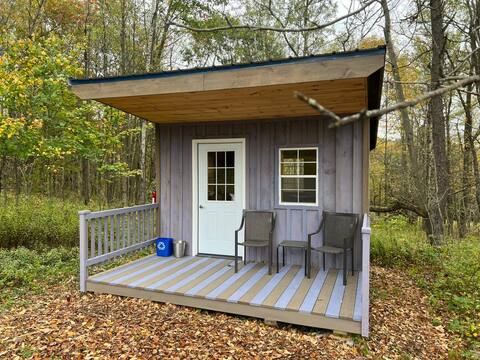
BRAND NEW~Mimi's Country Cabin~
Entire Place • 2 bedrooms
Sunset Cabin in Your Own Private Stargazing Field
Entire Place • 1 bedroom

Forest Cabin in Stargazing Field
Entire Place • 1 bedroom
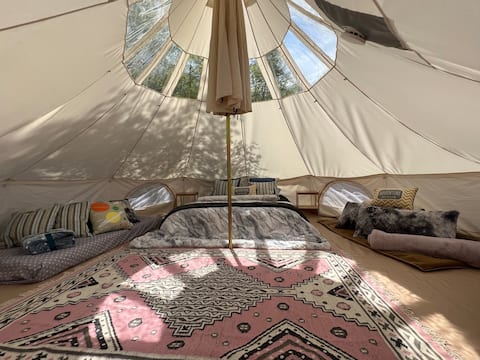
Stargazer Glamping Tent II
Entire Place • 1 bedroom
Note: Performance varies based on location, size, amenities, seasonality, and management quality. Data reflects the past 12 months.
Top Performing Airbnb Hosts in Hebron Township (2025)
Learn from the best! This table showcases top-performing Airbnb hosts in Hebron Township based on the number of properties managed and estimated total revenue over the past year. Analyze their scale and performance metrics.
| Host Name | Properties | Grossing Revenue | Stay Reviews | Avg Rating |
|---|---|---|---|---|
| John & Olga | 14 | $176,074 | 698 | 4.99/5.0 |
| Josh | 1 | $114,456 | 160 | 4.99/5.0 |
| Cathy | 1 | $28,173 | 4 | 5.00/5.0 |
| Karl | 1 | $18,038 | 366 | 4.91/5.0 |
Analyzing the strategies of top hosts, such as their property selection, pricing, and guest communication, can offer valuable lessons for optimizing your own Airbnb operations in Hebron Township.
Dive Deeper: Advanced Hebron Township STR Market Data (2025)
Ready to unlock more insights? AirROI provides access to advanced metrics and comprehensive Airbnb data for Hebron Township. Explore detailed analytics beyond this report to refine your investment strategy, optimize pricing, and maximize your vacation rental profits.
Explore Advanced MetricsHebron Township Short-Term Rental Market Composition (2025): Property & Room Types
Room Type Distribution
Property Type Distribution
Market Composition Insights for Hebron Township
- The Hebron Township Airbnb market composition is heavily skewed towards Entire Home/Apt listings, which make up 88.2% of the 17 active rentals. This indicates strong guest preference for privacy and space.
- Looking at the property type distribution in Hebron Township, Outdoor/Unique properties are the most common (82.4%), reflecting the local real estate landscape.
Hebron Township Airbnb Room Capacity Analysis (2025): Bedroom Distribution
Distribution of Listings by Number of Bedrooms
Room Capacity Insights for Hebron Township
- The dominant room capacity in Hebron Township is 1 bedroom listings, making up 47.1% of the market. This suggests a strong demand for properties suitable for couples or solo travelers.
- Together, 1 bedroom and 2 bedrooms properties represent 58.9% of the active Airbnb listings in Hebron Township, indicating a high concentration in these sizes.
- Listings with 3+ bedrooms (5.9%) represent a smaller niche, potentially indicating an underserved market for larger group accommodations in Hebron Township.
Hebron Township Vacation Rental Guest Capacity Trends (2025)
Distribution of Listings by Guest Capacity
Guest Capacity Insights for Hebron Township
- The most common guest capacity trend in Hebron Township vacation rentals is listings accommodating 5 guests (47.1%). This suggests the primary traveler segment is likely larger groups.
- Properties designed for 5 guests and 3 guests dominate the Hebron Township STR market, accounting for 76.5% of listings.
- 11.8% of properties accommodate 6+ guests, serving the market segment for larger families or group travel in Hebron Township.
- On average, properties in Hebron Township are equipped to host 4.1 guests.
Hebron Township Airbnb Booking Patterns (2025): Available vs. Booked Days
Available Days Distribution
Booked Days Distribution
Booking Pattern Insights for Hebron Township
- The most common availability pattern in Hebron Township falls within the 271-366 days range, representing 52.9% of listings. This suggests many properties have significant open periods on their calendars.
- Approximately 88.2% of listings show high availability (181+ days open annually), indicating potential for increased bookings or specific owner usage patterns.
- For booked days, the 91-180 days range is most frequent in Hebron Township (35.3%), reflecting common guest stay durations or potential owner blocking patterns.
- A notable 11.8% of properties secure long booking periods (181+ days booked per year), highlighting successful long-term rental strategies or significant owner usage.
Hebron Township Airbnb Minimum Stay Requirements Analysis
Distribution of Listings by Minimum Night Requirement
1 Night
15 listings
88.2% of total
2 Nights
1 listings
5.9% of total
30+ Nights
1 listings
5.9% of total
Key Insights
- The most prevalent minimum stay requirement in Hebron Township is 1 Night, adopted by 88.2% of listings. This highlights the market's preference for shorter, flexible bookings.
- A strong majority (94.1%) of the Hebron Township Airbnb data shows acceptance of very short stays (1-2 nights), indicating a dynamic, high-turnover market.
Recommendations
- Align with the market by considering a 1 Night minimum stay, as 88.2% of Hebron Township hosts use this setting.
- Explore offering discounts for stays of 30+ nights to attract the 5.9% of the market seeking extended stays.
- Adjust minimum nights based on seasonality – potentially shorter during low season and longer during peak demand periods in Hebron Township.
Hebron Township Airbnb Cancellation Policy Trends Analysis (2025)
Flexible
3 listings
17.6% of total
Firm
11 listings
64.7% of total
Strict
3 listings
17.6% of total
Cancellation Policy Insights for Hebron Township
- The prevailing Airbnb cancellation policy trend in Hebron Township is Firm, used by 64.7% of listings.
- A majority (82.3%) of hosts in Hebron Township utilize Firm or Strict policies, indicating a market where hosts prioritize booking security.
Recommendations for Hosts
- Consider adopting a Firm policy to align with the 64.7% market standard in Hebron Township.
- Regularly review your cancellation policy against competitors and market demand shifts in Hebron Township.
Hebron Township STR Booking Lead Time Analysis (2025)
Average Booking Lead Time by Month
Booking Lead Time Insights for Hebron Township
- The overall average booking lead time for vacation rentals in Hebron Township is 29 days.
- Guests book furthest in advance for stays during November (average 62 days), likely coinciding with peak travel demand or local events.
- The shortest booking windows occur for stays in June (average 22 days), indicating more last-minute travel plans during this time.
- Seasonally, Fall (40 days avg.) sees the longest lead times, while Summer (25 days avg.) has the shortest, reflecting typical travel planning cycles.
Recommendations for Hosts
- Use the overall average lead time (29 days) as a baseline for your pricing and availability strategy in Hebron Township.
- For November stays, consider implementing length-of-stay discounts or slightly higher rates for bookings made less than 62 days out to capitalize on advance planning.
- Target marketing efforts for the Fall season well in advance (at least 40 days) to capture early planners.
- Monitor your own booking lead times against these Hebron Township averages to identify opportunities for dynamic pricing adjustments.
Popular & Essential Airbnb Amenities in Hebron Township (2025)
Amenity Prevalence
Amenity Insights for Hebron Township
- Essential amenities in Hebron Township that guests expect include: Fire extinguisher, Carbon monoxide alarm, Free parking on premises, Smoke alarm. Lacking these (any) could significantly impact bookings.
- Popular amenities like First aid kit, Bed linens, Backyard are common but not universal. Offering these can provide a competitive edge.
- Warning: Wifi is not universally provided but is considered essential globally. Ensure reliable Wifi is offered.
Recommendations for Hosts
- Ensure your listing includes all essential amenities for Hebron Township: Fire extinguisher, Carbon monoxide alarm, Free parking on premises, Smoke alarm.
- Consider adding popular differentiators like First aid kit or Bed linens to increase appeal.
- Highlight unique or less common amenities you offer (e.g., hot tub, dedicated workspace, EV charger) in your listing description and photos.
- Regularly check competitor amenities in Hebron Township to stay competitive.
Hebron Township Airbnb Guest Demographics & Profile Analysis (2025)
Guest Profile Summary for Hebron Township
- The typical guest profile for Airbnb in Hebron Township consists of primarily domestic travelers (96%), often arriving from nearby Pittsburgh, typically belonging to the Post-2000s (Gen Z/Alpha) group (50%), primarily speaking English or Spanish.
- Domestic travelers account for 96.4% of guests.
- Key international markets include United States (96.4%) and Canada (1.2%).
- Top languages spoken are English (72%) followed by Spanish (11.2%).
- A significant demographic segment is the Post-2000s (Gen Z/Alpha) group, representing 50% of guests.
Recommendations for Hosts
- Target domestic marketing efforts towards travelers from Pittsburgh and Philadelphia.
- Tailor amenities and listing descriptions to appeal to the dominant Post-2000s (Gen Z/Alpha) demographic (e.g., highlight fast WiFi, smart home features, local guides).
- Highlight unique local experiences or amenities relevant to the primary guest profile.
- Consider seasonal promotions aligned with peak travel times for key origin markets.
Nearby Short-Term Rental Market Comparison
How does the Hebron Township Airbnb market stack up against its neighbors? Compare key performance metrics like average monthly revenue, ADR, and occupancy rates in surrounding areas to understand the broader regional STR landscape.
| Market | Active Properties | Monthly Revenue | Daily Rate | Avg. Occupancy |
|---|---|---|---|---|
| Lemont | 22 | $8,558 | $812.80 | 42% |
| State College | 158 | $7,525 | $751.34 | 44% |
| Rushville | 13 | $6,613 | $489.17 | 50% |
| Naples | 21 | $6,262 | $553.45 | 47% |
| Ferguson Township | 120 | $5,810 | $785.97 | 40% |
| College Township | 65 | $5,752 | $809.46 | 40% |
| Benner Township | 67 | $5,036 | $564.36 | 42% |
| Halfmoon Township | 17 | $4,992 | $691.16 | 36% |
| Town of Canandaigua | 84 | $4,922 | $429.04 | 44% |
| Patton Township | 183 | $4,682 | $646.54 | 39% |