Ringold Airbnb Market Analysis 2025: Short Term Rental Data & Vacation Rental Statistics in Oklahoma, United States
Is Airbnb profitable in Ringold in 2025? Explore comprehensive Airbnb analytics for Ringold, Oklahoma, United States to uncover income potential. This 2025 STR market report for Ringold, based on AirROI data from April 2024 to March 2025, reveals key trends in the niche market of 17 active listings.
Whether you're considering an Airbnb investment in Ringold, optimizing your existing vacation rental, or exploring rental arbitrage opportunities, understanding the Ringold Airbnb data is crucial. Leveraging the low regulation environment is key to maximizing your short term rental income potential. Let's dive into the specifics.
Key Ringold Airbnb Performance Metrics Overview
Monthly Airbnb Revenue Variations & Income Potential in Ringold (2025)
Understanding the monthly revenue variations for Airbnb listings in Ringold is key to maximizing your short term rental income potential. Seasonality significantly impacts earnings. Our analysis, based on data from the past 12 months, shows that the peak revenue month for STRs in Ringold is typically June, while August often presents the lowest earnings, highlighting opportunities for strategic pricing adjustments during shoulder and low seasons. Explore the typical Airbnb income in Ringold across different performance tiers:
- Best-in-class properties (Top 10%) achieve $3,536+ monthly, often utilizing dynamic pricing and superior guest experiences.
- Strong performing properties (Top 25%) earn $2,745 or more, indicating effective management and desirable locations/amenities.
- Typical properties (Median) generate around $1,904 per month, representing the average market performance.
- Entry-level properties (Bottom 25%) see earnings around $1,038, often with potential for optimization.
Average Monthly Airbnb Earnings Trend in Ringold
Ringold Airbnb Occupancy Rate Trends (2025)
Maximize your bookings by understanding the Ringold STR occupancy trends. Seasonal demand shifts significantly influence how often properties are booked. Typically, Junesees the highest demand (peak season occupancy), while August experiences the lowest (low season). Effective strategies, like adjusting minimum stays or offering promotions, can boost occupancy during slower periods. Here's how different property tiers perform in Ringold:
- Best-in-class properties (Top 10%) achieve 50%+ occupancy, indicating high desirability and potentially optimized availability.
- Strong performing properties (Top 25%) maintain 41% or higher occupancy, suggesting good market fit and guest satisfaction.
- Typical properties (Median) have an occupancy rate around 34%.
- Entry-level properties (Bottom 25%) average 17% occupancy, potentially facing higher vacancy.
Average Monthly Occupancy Rate Trend in Ringold
Average Daily Rate (ADR) Airbnb Trends in Ringold (2025)
Effective short term rental pricing strategy in Ringold involves understanding monthly ADR fluctuations. The Average Daily Rate (ADR) for Airbnb in Ringold typically peaks in November and dips lowest during September. Leveraging Airbnb dynamic pricing tools or strategies based on this seasonality can significantly boost revenue. Here's a look at the typical nightly rates achieved:
- Best-in-class properties (Top 10%) command rates of $272+ per night, often due to premium features or locations.
- Strong performing properties (Top 25%) achieve nightly rates of $245 or more.
- Typical properties (Median) charge around $165 per night.
- Entry-level properties (Bottom 25%) earn around $146 per night.
Average Daily Rate (ADR) Trend by Month in Ringold
Get Live Ringold Market Intelligence 👇

Explore Real-time Analytics
Airbnb Seasonality Analysis & Trends in Ringold (2025)
Peak Season (June, May, April)
- Revenue averages $3,672 per month
- Occupancy rates average 60.3%
- Daily rates average $192
Shoulder Season
- Revenue averages $1,663 per month
- Occupancy maintains around 27.1%
- Daily rates hold near $191
Low Season (January, February, August)
- Revenue drops to average $1,204 per month
- Occupancy decreases to average 17.0%
- Daily rates adjust to average $189
Seasonality Insights for Ringold
- The Airbnb seasonality in Ringold shows highly seasonal trends requiring careful strategy. While the sections above show seasonal averages, it's also insightful to look at the extremes:
- During the high season, the absolute peak month showcases Ringold's highest earning potential, with monthly revenues capable of climbing to $4,844, occupancy reaching a high of 73.3%, and ADRs peaking at $197.
- Conversely, the slowest single month of the year, typically falling within the low season, marks the market's lowest point. In this month, revenue might dip to $980, occupancy could drop to 14.8%, and ADRs may adjust down to $188.
- Understanding both the seasonal averages and these monthly peaks and troughs in revenue, occupancy, and ADR is crucial for maximizing your Airbnb profit potential in Ringold.
Seasonal Strategies for Maximizing Profit
- Peak Season: Maximize revenue through premium pricing and potentially longer minimum stays. Ensure high availability.
- Low Season: Offer competitive pricing, special promotions (e.g., extended stay discounts), and flexible cancellation policies. Target off-season travelers like remote workers or budget-conscious guests.
- Shoulder Seasons: Implement dynamic pricing that balances peak and low rates. Target weekend travelers or specific events. Offer slightly more flexible terms than peak season.
- Regularly analyze your own performance against these Ringold seasonality benchmarks and adjust your pricing and availability strategy accordingly.
Best Areas for Airbnb Investment in Ringold (2025)
Exploring the top neighborhoods for short-term rentals in Ringold? This section highlights key areas, outlining why they are attractive for hosts and guests, along with notable local attractions. Consider these locations based on your target guest profile and investment strategy.
| Neighborhood / Area | Why Host Here? (Target Guests & Appeal) | Key Attractions & Landmarks |
|---|---|---|
| Lake Eufaula | A popular destination for outdoor enthusiasts, Lake Eufaula is known for its beautiful beaches, fishing, and boating opportunities. It's ideal for families and vacationers seeking recreational activities. | Lake Eufaula State Park, Eufaula Cove Marina, Fishing spots, Public beaches, Nature trails |
| Historic Downtown | The historic downtown area of Ringold offers charm and a glimpse into the local culture with unique shops, restaurants, and events. It's a lovely place for travelers looking to experience the local lifestyle. | Local shops, Restaurants, Historic buildings, Community events, Outdoor markets |
| Kiamichi Mountains | This area is perfect for nature lovers, offering stunning mountain views, hiking trails, and the opportunity to discover Oklahoma's beautiful landscapes. Attracts those interested in outdoor adventures. | Kiamichi Mountain hiking trails, Scenic views, Wildlife watching, Picnic areas, Camping |
| Red River | The Red River area provides excellent opportunities for fishing and water sports. It's a great spot for families and guests looking to engage in water activities during their stay. | Fishing spots, Boat ramps, Picnic areas, Nature parks, Scenic views |
| Local Vineyards | Ringold has several vineyards nearby which appeal to wine enthusiasts. It is an attractive area for couples and groups looking for a peaceful and relaxing getaway. | Wine tastings, Vineyard tours, Scenic picnics, Wine festivals |
| Cultural Heritage Sites | The area is rich in Native American history, making it informative and attractive to those interested in learning about local culture. | Historic sites, Cultural centers, Museums, Traditional craft shops |
| Outdoor Recreation Areas | With numerous parks and recreational facilities, Ringold is appealing to those seeking outdoor activities such as hiking, camping, and family outings. | State parks, Hiking trails, Biking paths, Recreational facilities, Playgrounds |
| Community Events Venue | Ringold hosts various local events throughout the year that draw visitors, making it an exciting place to stay during these times. | Local fairs, Music festivals, Farmers markets, Art shows, Community gatherings |
Understanding Airbnb License Requirements & STR Laws in Ringold (2025)
While Ringold, Oklahoma, United States currently shows low STR regulations, specific Airbnb license requirements might still exist or change. Always verify the latest short term rental regulations and Airbnb license requirements directly with local government authorities for Ringold to ensure full compliance before hosting.
(Source: AirROI data, 2025, finding no licensed listings among those analyzed)
Top Performing Airbnb Properties in Ringold (2025)
Benchmark your potential! Explore examples of top-performing Airbnb properties in Ringoldbased on Trailing Twelve Month (TTM) revenue. Analyze their characteristics, revenue, occupancy rate, and ADR to understand what drives success in this market.

"Bella Louise"Hot tub,perfect for romantic getaway
Entire Place • 1 bedroom

“The Place 2B”Sleeps 8-Gameroom-Hottub-Fireplace
Entire Place • 2 bedrooms
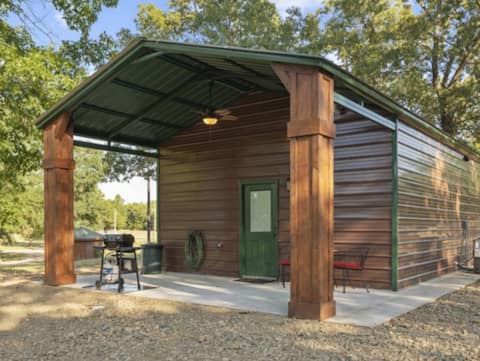
Harmony - a Fisherman's Delight w/ Grill & Firepit
Entire Place • 1 bedroom

"Pine Knot" Heart shaped hottub for 2, fireplace,
Entire Place • 1 bedroom
"Timber Top"Hot tub, luxury cabin perfect for two
Entire Place • 1 bedroom
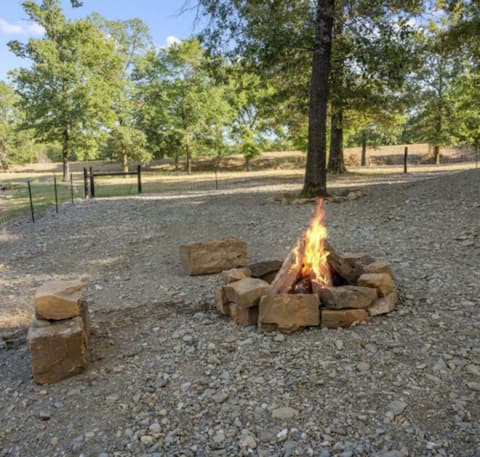
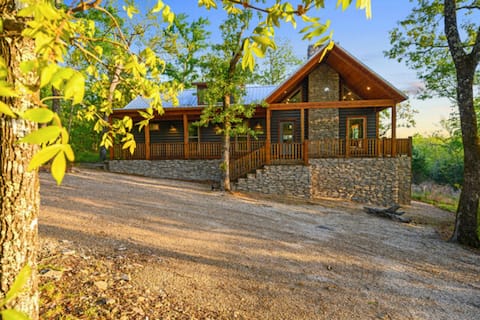
Tranquility - Secluded Cabin w/Grill & Firepit
Entire Place • 1 bedroom
Note: Performance varies based on location, size, amenities, seasonality, and management quality. Data reflects the past 12 months.
Top Performing Airbnb Hosts in Ringold (2025)
Learn from the best! This table showcases top-performing Airbnb hosts in Ringold based on the number of properties managed and estimated total revenue over the past year. Analyze their scale and performance metrics.
| Host Name | Properties | Grossing Revenue | Stay Reviews | Avg Rating |
|---|---|---|---|---|
| Teresa | 10 | $153,310 | 19 | 1.44/5.0 |
| Ree | 3 | $37,710 | 8 | 1.61/5.0 |
| Stephanie | 4 | $17,868 | 4 | 1.13/5.0 |
Analyzing the strategies of top hosts, such as their property selection, pricing, and guest communication, can offer valuable lessons for optimizing your own Airbnb operations in Ringold.
Dive Deeper: Advanced Ringold STR Market Data (2025)
Ready to unlock more insights? AirROI provides access to advanced metrics and comprehensive Airbnb data for Ringold. Explore detailed analytics beyond this report to refine your investment strategy, optimize pricing, and maximize your vacation rental profits.
Explore Advanced MetricsRingold Short-Term Rental Market Composition (2025): Property & Room Types
Room Type Distribution
Property Type Distribution
Market Composition Insights for Ringold
- The Ringold Airbnb market composition is heavily skewed towards Entire Home/Apt listings, which make up 100% of the 17 active rentals. This indicates strong guest preference for privacy and space.
- Looking at the property type distribution in Ringold, Outdoor/Unique properties are the most common (100%), reflecting the local real estate landscape.
Ringold Airbnb Room Capacity Analysis (2025): Bedroom Distribution
Distribution of Listings by Number of Bedrooms
Room Capacity Insights for Ringold
- The dominant room capacity in Ringold is 1 bedroom listings, making up 64.7% of the market. This suggests a strong demand for properties suitable for couples or solo travelers.
- Together, 1 bedroom and 2 bedrooms properties represent 94.1% of the active Airbnb listings in Ringold, indicating a high concentration in these sizes.
- With over half the market (64.7%) consisting of studios or 1-bedroom units, Ringold is particularly well-suited for individuals or couples.
- Listings with 3+ bedrooms (5.9%) represent a smaller niche, potentially indicating an underserved market for larger group accommodations in Ringold.
Ringold Vacation Rental Guest Capacity Trends (2025)
Distribution of Listings by Guest Capacity
Guest Capacity Insights for Ringold
- The most common guest capacity trend in Ringold vacation rentals is listings accommodating 4 guests (41.2%). This suggests the primary traveler segment is likely small families or groups.
- Properties designed for 4 guests and 2 guests dominate the Ringold STR market, accounting for 70.6% of listings.
- 23.6% of properties accommodate 6+ guests, serving the market segment for larger families or group travel in Ringold.
- On average, properties in Ringold are equipped to host 4.1 guests.
Ringold Airbnb Booking Patterns (2025): Available vs. Booked Days
Available Days Distribution
Booked Days Distribution
Booking Pattern Insights for Ringold
- The most common availability pattern in Ringold falls within the 271-366 days range, representing 88.2% of listings. This suggests many properties have significant open periods on their calendars.
- Approximately 100.0% of listings show high availability (181+ days open annually), indicating potential for increased bookings or specific owner usage patterns.
- For booked days, the 31-90 days range is most frequent in Ringold (70.6%), reflecting common guest stay durations or potential owner blocking patterns.
Ringold Airbnb Minimum Stay Requirements Analysis
Distribution of Listings by Minimum Night Requirement
1 Night
4 listings
23.5% of total
2 Nights
10 listings
58.8% of total
30+ Nights
3 listings
17.6% of total
Key Insights
- The most prevalent minimum stay requirement in Ringold is 2 Nights, adopted by 58.8% of listings. This highlights the market's preference for shorter, flexible bookings.
- A strong majority (82.3%) of the Ringold Airbnb data shows acceptance of very short stays (1-2 nights), indicating a dynamic, high-turnover market.
- A significant segment (17.6%) caters to monthly stays (30+ nights) in Ringold, pointing to opportunities in the extended-stay market.
Recommendations
- Align with the market by considering a 2 Nights minimum stay, as 58.8% of Ringold hosts use this setting.
- If feasible, allowing 1-night stays, especially midweek or during low season, could capture last-minute bookings, as only 23.5% currently do.
- Explore offering discounts for stays of 30+ nights to attract the 17.6% of the market seeking extended stays.
- Adjust minimum nights based on seasonality – potentially shorter during low season and longer during peak demand periods in Ringold.
Ringold Airbnb Cancellation Policy Trends Analysis (2025)
Flexible
2 listings
40% of total
Strict
3 listings
60% of total
Cancellation Policy Insights for Ringold
- The prevailing Airbnb cancellation policy trend in Ringold is Strict, used by 60% of listings.
- A majority (60.0%) of hosts in Ringold utilize Firm or Strict policies, indicating a market where hosts prioritize booking security.
Recommendations for Hosts
- Consider adopting a Strict policy to align with the 60% market standard in Ringold.
- With 60% using Strict terms, this is a viable option in Ringold, particularly for high-value properties or during peak demand periods.
- Regularly review your cancellation policy against competitors and market demand shifts in Ringold.
Ringold STR Booking Lead Time Analysis (2025)
Average Booking Lead Time by Month
Booking Lead Time Insights for Ringold
- The overall average booking lead time for vacation rentals in Ringold is 32 days.
- Guests book furthest in advance for stays during April (average 181 days), likely coinciding with peak travel demand or local events.
- The shortest booking windows occur for stays in June (average 0 days), indicating more last-minute travel plans during this time.
- Seasonally, Spring (76 days avg.) sees the longest lead times, while Winter (18 days avg.) has the shortest, reflecting typical travel planning cycles.
Recommendations for Hosts
- Use the overall average lead time (32 days) as a baseline for your pricing and availability strategy in Ringold.
- For April stays, consider implementing length-of-stay discounts or slightly higher rates for bookings made less than 181 days out to capitalize on advance planning.
- During June, focus on last-minute booking availability and promotions, as guests book with very short notice (0 days avg.).
- Target marketing efforts for the Spring season well in advance (at least 76 days) to capture early planners.
- Monitor your own booking lead times against these Ringold averages to identify opportunities for dynamic pricing adjustments.
Popular & Essential Airbnb Amenities in Ringold (2025)
Amenity Prevalence
Amenity Insights for Ringold
- Essential amenities in Ringold that guests expect include: Free parking on premises, Air conditioning, TV. Lacking these (any) could significantly impact bookings.
- Popular amenities like Hot water, Wifi, Washer are common but not universal. Offering these can provide a competitive edge.
- Warning: Wifi is not universally provided but is considered essential globally. Ensure reliable Wifi is offered.
Recommendations for Hosts
- Ensure your listing includes all essential amenities for Ringold: Free parking on premises, Air conditioning, TV.
- Consider adding popular differentiators like Hot water or Wifi to increase appeal.
- Highlight unique or less common amenities you offer (e.g., hot tub, dedicated workspace, EV charger) in your listing description and photos.
- Regularly check competitor amenities in Ringold to stay competitive.
Ringold Airbnb Guest Demographics & Profile Analysis (2025)
Guest Profile Summary for Ringold
- The typical guest profile for Airbnb in Ringold consists of primarily domestic travelers (100%), often arriving from nearby De Kalb, typically belonging to the Post-2000s (Gen Z/Alpha) group (50%), primarily speaking English.
- Domestic travelers account for 100.0% of guests.
- A significant demographic segment is the Post-2000s (Gen Z/Alpha) group, representing 50% of guests.
Recommendations for Hosts
- Target domestic marketing efforts towards travelers from De Kalb and South Carolina.
- Tailor amenities and listing descriptions to appeal to the dominant Post-2000s (Gen Z/Alpha) demographic (e.g., highlight fast WiFi, smart home features, local guides).
- Highlight unique local experiences or amenities relevant to the primary guest profile.
- Consider seasonal promotions aligned with peak travel times for key origin markets.
Nearby Short-Term Rental Market Comparison
How does the Ringold Airbnb market stack up against its neighbors? Compare key performance metrics like average monthly revenue, ADR, and occupancy rates in surrounding areas to understand the broader regional STR landscape.
| Market | Active Properties | Monthly Revenue | Daily Rate | Avg. Occupancy |
|---|---|---|---|---|
| Anna | 13 | $5,170 | $298.78 | 44% |
| McCurtain County | 78 | $5,102 | $445.84 | 39% |
| Broken Bow | 2,448 | $4,754 | $386.94 | 39% |
| Hochatown | 14 | $4,436 | $383.19 | 38% |
| Coweta | 13 | $4,285 | $444.14 | 49% |
| Wilburton | 18 | $4,124 | $268.85 | 39% |
| Pilot Point | 15 | $3,291 | $362.83 | 36% |
| Carlton Landing | 91 | $3,106 | $369.31 | 29% |
| Canadian | 33 | $3,096 | $317.49 | 34% |
| broken bow | 13 | $2,898 | $467.10 | 23% |