University Heights Airbnb Market Analysis 2025: Short Term Rental Data & Vacation Rental Statistics in Ohio, United States
Is Airbnb profitable in University Heights in 2025? Explore comprehensive Airbnb analytics for University Heights, Ohio, United States to uncover income potential. This 2025 STR market report for University Heights, based on AirROI data from June 2024 to May 2025, reveals key trends in the niche market of 20 active listings.
Whether you're considering an Airbnb investment in University Heights, optimizing your existing vacation rental, or exploring rental arbitrage opportunities, understanding the University Heights Airbnb data is crucial. Leveraging the low regulation environment is key to maximizing your short term rental income potential. Let's dive into the specifics.
Key University Heights Airbnb Performance Metrics Overview
Monthly Airbnb Revenue Variations & Income Potential in University Heights (2025)
Understanding the monthly revenue variations for Airbnb listings in University Heights is key to maximizing your short term rental income potential. Seasonality significantly impacts earnings. Our analysis, based on data from the past 12 months, shows that the peak revenue month for STRs in University Heights is typically August, while January often presents the lowest earnings, highlighting opportunities for strategic pricing adjustments during shoulder and low seasons. Explore the typical Airbnb income in University Heights across different performance tiers:
- Best-in-class properties (Top 10%) achieve $4,525+ monthly, often utilizing dynamic pricing and superior guest experiences.
- Strong performing properties (Top 25%) earn $3,207 or more, indicating effective management and desirable locations/amenities.
- Typical properties (Median) generate around $2,393 per month, representing the average market performance.
- Entry-level properties (Bottom 25%) see earnings around $1,158, often with potential for optimization.
Average Monthly Airbnb Earnings Trend in University Heights
University Heights Airbnb Occupancy Rate Trends (2025)
Maximize your bookings by understanding the University Heights STR occupancy trends. Seasonal demand shifts significantly influence how often properties are booked. Typically, Augustsees the highest demand (peak season occupancy), while November experiences the lowest (low season). Effective strategies, like adjusting minimum stays or offering promotions, can boost occupancy during slower periods. Here's how different property tiers perform in University Heights:
- Best-in-class properties (Top 10%) achieve 75%+ occupancy, indicating high desirability and potentially optimized availability.
- Strong performing properties (Top 25%) maintain 66% or higher occupancy, suggesting good market fit and guest satisfaction.
- Typical properties (Median) have an occupancy rate around 46%.
- Entry-level properties (Bottom 25%) average 26% occupancy, potentially facing higher vacancy.
Average Monthly Occupancy Rate Trend in University Heights
Average Daily Rate (ADR) Airbnb Trends in University Heights (2025)
Effective short term rental pricing strategy in University Heights involves understanding monthly ADR fluctuations. The Average Daily Rate (ADR) for Airbnb in University Heights typically peaks in November and dips lowest during January. Leveraging Airbnb dynamic pricing tools or strategies based on this seasonality can significantly boost revenue. Here's a look at the typical nightly rates achieved:
- Best-in-class properties (Top 10%) command rates of $479+ per night, often due to premium features or locations.
- Strong performing properties (Top 25%) achieve nightly rates of $234 or more.
- Typical properties (Median) charge around $156 per night.
- Entry-level properties (Bottom 25%) earn around $105 per night.
Average Daily Rate (ADR) Trend by Month in University Heights
Get Live University Heights Market Intelligence 👇

Explore Real-time Analytics
Airbnb Seasonality Analysis & Trends in University Heights (2025)
Peak Season (August, July, May)
- Revenue averages $3,121 per month
- Occupancy rates average 53.8%
- Daily rates average $242
Shoulder Season
- Revenue averages $2,393 per month
- Occupancy maintains around 46.2%
- Daily rates hold near $240
Low Season (January, February, November)
- Revenue drops to average $1,791 per month
- Occupancy decreases to average 39.2%
- Daily rates adjust to average $206
Seasonality Insights for University Heights
- The Airbnb seasonality in University Heights shows moderate seasonality with distinct peak and low periods. While the sections above show seasonal averages, it's also insightful to look at the extremes:
- During the high season, the absolute peak month showcases University Heights's highest earning potential, with monthly revenues capable of climbing to $3,263, occupancy reaching a high of 58.2%, and ADRs peaking at $272.
- Conversely, the slowest single month of the year, typically falling within the low season, marks the market's lowest point. In this month, revenue might dip to $1,640, occupancy could drop to 37.1%, and ADRs may adjust down to $167.
- Understanding both the seasonal averages and these monthly peaks and troughs in revenue, occupancy, and ADR is crucial for maximizing your Airbnb profit potential in University Heights.
Seasonal Strategies for Maximizing Profit
- Peak Season: Maximize revenue through premium pricing and potentially longer minimum stays. Ensure high availability.
- Low Season: Offer competitive pricing, special promotions (e.g., extended stay discounts), and flexible cancellation policies. Target off-season travelers like remote workers or budget-conscious guests.
- Shoulder Seasons: Implement dynamic pricing that balances peak and low rates. Target weekend travelers or specific events. Offer slightly more flexible terms than peak season.
- Regularly analyze your own performance against these University Heights seasonality benchmarks and adjust your pricing and availability strategy accordingly.
Best Areas for Airbnb Investment in University Heights (2025)
Exploring the top neighborhoods for short-term rentals in University Heights? This section highlights key areas, outlining why they are attractive for hosts and guests, along with notable local attractions. Consider these locations based on your target guest profile and investment strategy.
| Neighborhood / Area | Why Host Here? (Target Guests & Appeal) | Key Attractions & Landmarks |
|---|---|---|
| Cedar Fairmount | A lively area featuring shops, restaurants, and bars that cater to both locals and visitors. It is situated close to cultural landmarks and has a youthful vibe due to nearby universities. | Cedar Lee Theatre, Cleveland Heights Community Center, Cleveland Institute of Art, Murty Park, Local art galleries |
| Shaker Square | Historic district known for its diverse dining options and unique marketplace. It serves as a hub for visitors wanting to experience the local community. | Shaker Square Shopping Center, Shaker Historical Society, Shaker Heights Park, Local farmer's market, Art exhibits |
| South Park Mall | A popular shopping and entertainment destination that attracts families and shoppers. Ideal for hosting guests looking for convenience and accessibility to major retail stores. | South Park Mall, Surrounding restaurants, Cinemark Theatres, Fitness centers, Gathering spaces |
| University Circle | Home to cultural institutions, museums, and universities, making it an appealing location for academic visitors, families, and tourists interested in arts and education. | Cleveland Museum of Art, Cleveland Orchestra, Cleveland Botanical Garden, Case Western Reserve University, Cleveland Museum of Natural History |
| Shaker Heights | A beautiful suburban area known for its impressive architecture and family-friendly environment. Appeals to those seeking tranquility while being close to urban amenities. | Shaker Lakes Park, Historical homes, Local dining options, Outdoors and recreation, Community events |
| Cleveland Heights | A vibrant neighborhood with a mix of residential housing and lively commercial areas. Attracts a diverse group of visitors due to its cultural offerings and neighborhood charm. | Cleveland Heights Historical Society, Local parks, Cleveland Heights Library, Dining on Coventry Road, Annual street fairs |
| Lee Road | A notable commercial corridor with a mix of local businesses and restaurants. Its central location makes it easy for visitors to access various attractions in the region. | Local eateries, Shopping options, Public transport access, Cultural venues, Community hubs |
| Doan Brook | A scenic area featuring nature trails and beautiful landscapes. Ideal for those looking to escape the urban hustle and enjoy outdoor activities while still having access to city amenities. | Doan Brook Reservation, Walking trails, Nature centers, Picnic areas, Bird watching spots |
Understanding Airbnb License Requirements & STR Laws in University Heights (2025)
While University Heights, Ohio, United States currently shows low STR regulations, specific Airbnb license requirements might still exist or change. Always verify the latest short term rental regulations and Airbnb license requirements directly with local government authorities for University Heights to ensure full compliance before hosting.
(Source: AirROI data, 2025, based on 5% licensed listings)
Top Performing Airbnb Properties in University Heights (2025)
Benchmark your potential! Explore examples of top-performing Airbnb properties in University Heightsbased on Trailing Twelve Month (TTM) revenue. Analyze their characteristics, revenue, occupancy rate, and ADR to understand what drives success in this market.
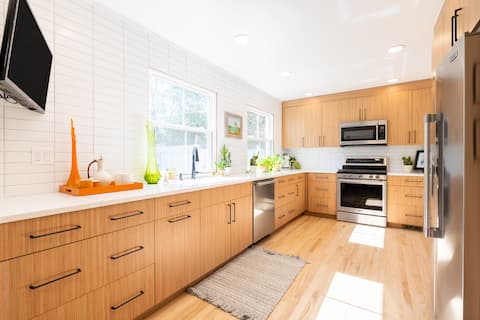
Cozy Mid-Century Modern University Heights Getaway
Entire Place • 3 bedrooms

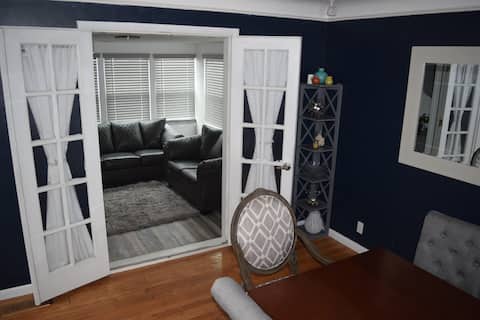
Modern 3BR home next to park, office space, & more
Entire Place • 3 bedrooms
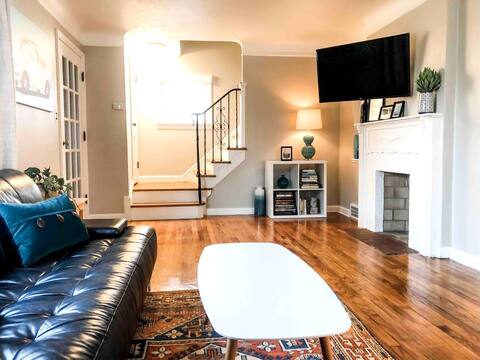
Beautiful spacious 4 bedroom with large backyard
Entire Place • 4 bedrooms
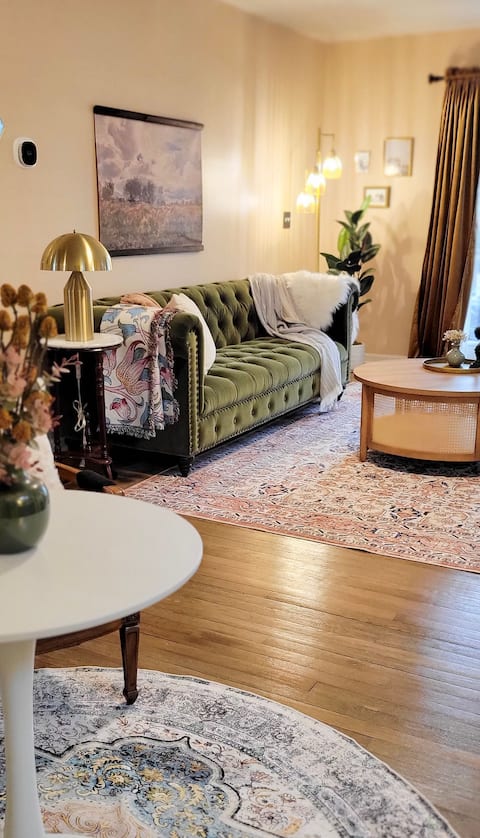
Stylish&Bright 4BR w/Sun Deck-Close To Everything!
Entire Place • 3 bedrooms
Charming Tudor near Cleveland’s best sites!
Entire Place • 3 bedrooms
Welcome to Cleveland Heights!
Entire Place • 3 bedrooms
Note: Performance varies based on location, size, amenities, seasonality, and management quality. Data reflects the past 12 months.
Top Performing Airbnb Hosts in University Heights (2025)
Learn from the best! This table showcases top-performing Airbnb hosts in University Heights based on the number of properties managed and estimated total revenue over the past year. Analyze their scale and performance metrics.
| Host Name | Properties | Grossing Revenue | Stay Reviews | Avg Rating |
|---|---|---|---|---|
| Jill | 1 | $60,690 | 78 | 4.95/5.0 |
| Ken | 2 | $49,936 | 117 | 4.76/5.0 |
| HomeHop | 1 | $38,909 | 45 | 4.82/5.0 |
| Misty And Jose | 1 | $27,865 | 91 | 4.88/5.0 |
| Heather | 1 | $26,539 | 19 | 4.95/5.0 |
| Nicholas | 1 | $26,323 | 33 | 4.82/5.0 |
| Barry | 1 | $24,172 | 114 | 4.84/5.0 |
| Michelle | 1 | $20,086 | 26 | 4.62/5.0 |
| Einat | 1 | $19,607 | 23 | 4.91/5.0 |
| Laura | 1 | $14,555 | 48 | 4.81/5.0 |
Analyzing the strategies of top hosts, such as their property selection, pricing, and guest communication, can offer valuable lessons for optimizing your own Airbnb operations in University Heights.
Dive Deeper: Advanced University Heights STR Market Data (2025)
Ready to unlock more insights? AirROI provides access to advanced metrics and comprehensive Airbnb data for University Heights. Explore detailed analytics beyond this report to refine your investment strategy, optimize pricing, and maximize your vacation rental profits.
Explore Advanced MetricsUniversity Heights Short-Term Rental Market Composition (2025): Property & Room Types
Room Type Distribution
Property Type Distribution
Market Composition Insights for University Heights
- The University Heights Airbnb market composition is heavily skewed towards Entire Home/Apt listings, which make up 95% of the 20 active rentals. This indicates strong guest preference for privacy and space.
- Looking at the property type distribution in University Heights, House properties are the most common (95%), reflecting the local real estate landscape.
- Houses represent a significant 95% portion, catering likely to families or larger groups.
University Heights Airbnb Room Capacity Analysis (2025): Bedroom Distribution
Distribution of Listings by Number of Bedrooms
Room Capacity Insights for University Heights
- The dominant room capacity in University Heights is 3 bedrooms listings, making up 50% of the market. This suggests a strong demand for properties suitable for families or small groups.
- Together, 3 bedrooms and 4 bedrooms properties represent 80.0% of the active Airbnb listings in University Heights, indicating a high concentration in these sizes.
- A significant 80.0% of listings offer 3+ bedrooms, catering to larger groups and families seeking more space in University Heights.
University Heights Vacation Rental Guest Capacity Trends (2025)
Distribution of Listings by Guest Capacity
Guest Capacity Insights for University Heights
- The most common guest capacity trend in University Heights vacation rentals is listings accommodating 6 guests (35%). This suggests the primary traveler segment is likely larger groups.
- Properties designed for 6 guests and 8+ guests dominate the University Heights STR market, accounting for 60.0% of listings.
- 75.0% of properties accommodate 6+ guests, serving the market segment for larger families or group travel in University Heights.
- On average, properties in University Heights are equipped to host 6.0 guests.
University Heights Airbnb Booking Patterns (2025): Available vs. Booked Days
Available Days Distribution
Booked Days Distribution
Booking Pattern Insights for University Heights
- The most common availability pattern in University Heights falls within the 271-366 days range, representing 45% of listings. This suggests many properties have significant open periods on their calendars.
- Approximately 75.0% of listings show high availability (181+ days open annually), indicating potential for increased bookings or specific owner usage patterns.
- For booked days, the 31-90 days range is most frequent in University Heights (40%), reflecting common guest stay durations or potential owner blocking patterns.
- A notable 25.0% of properties secure long booking periods (181+ days booked per year), highlighting successful long-term rental strategies or significant owner usage.
University Heights Airbnb Minimum Stay Requirements Analysis
Distribution of Listings by Minimum Night Requirement
1 Night
1 listings
5.6% of total
2 Nights
8 listings
44.4% of total
3 Nights
2 listings
11.1% of total
4-6 Nights
2 listings
11.1% of total
7-29 Nights
4 listings
22.2% of total
30+ Nights
1 listings
5.6% of total
Key Insights
- The most prevalent minimum stay requirement in University Heights is 2 Nights, adopted by 44.4% of listings. This highlights the market's preference for shorter, flexible bookings.
Recommendations
- Align with the market by considering a 2 Nights minimum stay, as 44.4% of University Heights hosts use this setting.
- If feasible, allowing 1-night stays, especially midweek or during low season, could capture last-minute bookings, as only 5.6% currently do.
- A 2-night minimum appears standard (44.4%). Consider this for weekends or peak periods.
- Explore offering discounts for stays of 30+ nights to attract the 5.6% of the market seeking extended stays.
- Adjust minimum nights based on seasonality – potentially shorter during low season and longer during peak demand periods in University Heights.
University Heights Airbnb Cancellation Policy Trends Analysis (2025)
Flexible
1 listings
5.9% of total
Moderate
2 listings
11.8% of total
Firm
7 listings
41.2% of total
Strict
7 listings
41.2% of total
Cancellation Policy Insights for University Heights
- The prevailing Airbnb cancellation policy trend in University Heights is Firm, used by 41.2% of listings.
- A majority (82.4%) of hosts in University Heights utilize Firm or Strict policies, indicating a market where hosts prioritize booking security.
Recommendations for Hosts
- Consider adopting a Firm policy to align with the 41.2% market standard in University Heights.
- With 41.2% using Strict terms, this is a viable option in University Heights, particularly for high-value properties or during peak demand periods.
- Regularly review your cancellation policy against competitors and market demand shifts in University Heights.
University Heights STR Booking Lead Time Analysis (2025)
Average Booking Lead Time by Month
Booking Lead Time Insights for University Heights
- The overall average booking lead time for vacation rentals in University Heights is 41 days.
- Guests book furthest in advance for stays during June (average 81 days), likely coinciding with peak travel demand or local events.
- The shortest booking windows occur for stays in March (average 13 days), indicating more last-minute travel plans during this time.
- Seasonally, Summer (62 days avg.) sees the longest lead times, while Fall (33 days avg.) has the shortest, reflecting typical travel planning cycles.
Recommendations for Hosts
- Use the overall average lead time (41 days) as a baseline for your pricing and availability strategy in University Heights.
- For June stays, consider implementing length-of-stay discounts or slightly higher rates for bookings made less than 81 days out to capitalize on advance planning.
- During March, focus on last-minute booking availability and promotions, as guests book with very short notice (13 days avg.).
- Target marketing efforts for the Summer season well in advance (at least 62 days) to capture early planners.
- Monitor your own booking lead times against these University Heights averages to identify opportunities for dynamic pricing adjustments.
Popular & Essential Airbnb Amenities in University Heights (2025)
Amenity Prevalence
Amenity Insights for University Heights
- Essential amenities in University Heights that guests expect include: Wifi, TV, Heating, Free parking on premises, Air conditioning, Kitchen, Smoke alarm, Fire extinguisher, Bed linens, Iron. Lacking these (any) could significantly impact bookings.
Recommendations for Hosts
- Ensure your listing includes all essential amenities for University Heights: Wifi, TV, Heating, Free parking on premises, Air conditioning, Kitchen, Smoke alarm, Fire extinguisher, Bed linens, Iron.
- Prioritize adding missing essentials: Fire extinguisher, Bed linens, Iron.
- Highlight unique or less common amenities you offer (e.g., hot tub, dedicated workspace, EV charger) in your listing description and photos.
- Regularly check competitor amenities in University Heights to stay competitive.
University Heights Airbnb Guest Demographics & Profile Analysis (2025)
Guest Profile Summary for University Heights
- The typical guest profile for Airbnb in University Heights consists of primarily domestic travelers (94%), often arriving from nearby New York, typically belonging to the Post-2000s (Gen Z/Alpha) group (50%), primarily speaking English or Spanish.
- Domestic travelers account for 93.8% of guests.
- Key international markets include United States (93.8%) and DC (1.7%).
- Top languages spoken are English (72.1%) followed by Spanish (10.5%).
- A significant demographic segment is the Post-2000s (Gen Z/Alpha) group, representing 50% of guests.
Recommendations for Hosts
- Target domestic marketing efforts towards travelers from New York and Cleveland.
- Tailor amenities and listing descriptions to appeal to the dominant Post-2000s (Gen Z/Alpha) demographic (e.g., highlight fast WiFi, smart home features, local guides).
- Highlight unique local experiences or amenities relevant to the primary guest profile.
- Consider seasonal promotions aligned with peak travel times for key origin markets.
Nearby Short-Term Rental Market Comparison
How does the University Heights Airbnb market stack up against its neighbors? Compare key performance metrics like average monthly revenue, ADR, and occupancy rates in surrounding areas to understand the broader regional STR landscape.
| Market | Active Properties | Monthly Revenue | Daily Rate | Avg. Occupancy |
|---|---|---|---|---|
| Huron Township | 16 | $4,491 | $436.47 | 40% |
| Peninsula | 16 | $4,341 | $316.09 | 53% |
| Berlin Township | 12 | $4,280 | $367.66 | 44% |
| Mentor-on-the-Lake | 10 | $3,578 | $254.16 | 55% |
| Catawba Island Township | 13 | $3,494 | $394.56 | 45% |
| Put-in-Bay | 42 | $3,403 | $489.38 | 42% |
| Sewickley | 15 | $3,378 | $209.59 | 64% |
| Chagrin Falls | 18 | $3,325 | $247.62 | 53% |
| Castle Shannon | 10 | $3,308 | $165.88 | 66% |
| Lake Township | 14 | $3,254 | $257.67 | 40% |