Tarboro Airbnb Market Analysis 2025: Short Term Rental Data & Vacation Rental Statistics in North Carolina, United States
Is Airbnb profitable in Tarboro in 2025? Explore comprehensive Airbnb analytics for Tarboro, North Carolina, United States to uncover income potential. This 2025 STR market report for Tarboro, based on AirROI data from June 2024 to May 2025, reveals key trends in the niche market of 19 active listings.
Whether you're considering an Airbnb investment in Tarboro, optimizing your existing vacation rental, or exploring rental arbitrage opportunities, understanding the Tarboro Airbnb data is crucial. Leveraging the low regulation environment is key to maximizing your short term rental income potential. Let's dive into the specifics.
Key Tarboro Airbnb Performance Metrics Overview
Monthly Airbnb Revenue Variations & Income Potential in Tarboro (2025)
Understanding the monthly revenue variations for Airbnb listings in Tarboro is key to maximizing your short term rental income potential. Seasonality significantly impacts earnings. Our analysis, based on data from the past 12 months, shows that the peak revenue month for STRs in Tarboro is typically July, while January often presents the lowest earnings, highlighting opportunities for strategic pricing adjustments during shoulder and low seasons. Explore the typical Airbnb income in Tarboro across different performance tiers:
- Best-in-class properties (Top 10%) achieve $2,729+ monthly, often utilizing dynamic pricing and superior guest experiences.
- Strong performing properties (Top 25%) earn $1,852 or more, indicating effective management and desirable locations/amenities.
- Typical properties (Median) generate around $1,036 per month, representing the average market performance.
- Entry-level properties (Bottom 25%) see earnings around $521, often with potential for optimization.
Average Monthly Airbnb Earnings Trend in Tarboro
Tarboro Airbnb Occupancy Rate Trends (2025)
Maximize your bookings by understanding the Tarboro STR occupancy trends. Seasonal demand shifts significantly influence how often properties are booked. Typically, Julysees the highest demand (peak season occupancy), while January experiences the lowest (low season). Effective strategies, like adjusting minimum stays or offering promotions, can boost occupancy during slower periods. Here's how different property tiers perform in Tarboro:
- Best-in-class properties (Top 10%) achieve 65%+ occupancy, indicating high desirability and potentially optimized availability.
- Strong performing properties (Top 25%) maintain 49% or higher occupancy, suggesting good market fit and guest satisfaction.
- Typical properties (Median) have an occupancy rate around 30%.
- Entry-level properties (Bottom 25%) average 17% occupancy, potentially facing higher vacancy.
Average Monthly Occupancy Rate Trend in Tarboro
Average Daily Rate (ADR) Airbnb Trends in Tarboro (2025)
Effective short term rental pricing strategy in Tarboro involves understanding monthly ADR fluctuations. The Average Daily Rate (ADR) for Airbnb in Tarboro typically peaks in May and dips lowest during June. Leveraging Airbnb dynamic pricing tools or strategies based on this seasonality can significantly boost revenue. Here's a look at the typical nightly rates achieved:
- Best-in-class properties (Top 10%) command rates of $162+ per night, often due to premium features or locations.
- Strong performing properties (Top 25%) achieve nightly rates of $111 or more.
- Typical properties (Median) charge around $91 per night.
- Entry-level properties (Bottom 25%) earn around $77 per night.
Average Daily Rate (ADR) Trend by Month in Tarboro
Get Live Tarboro Market Intelligence 👇

Explore Real-time Analytics
Airbnb Seasonality Analysis & Trends in Tarboro (2025)
Peak Season (July, June, October)
- Revenue averages $1,859 per month
- Occupancy rates average 45.0%
- Daily rates average $93
Shoulder Season
- Revenue averages $1,247 per month
- Occupancy maintains around 36.5%
- Daily rates hold near $102
Low Season (January, February, September)
- Revenue drops to average $853 per month
- Occupancy decreases to average 26.1%
- Daily rates adjust to average $104
Seasonality Insights for Tarboro
- The Airbnb seasonality in Tarboro shows highly seasonal trends requiring careful strategy. While the sections above show seasonal averages, it's also insightful to look at the extremes:
- During the high season, the absolute peak month showcases Tarboro's highest earning potential, with monthly revenues capable of climbing to $2,116, occupancy reaching a high of 52.3%, and ADRs peaking at $114.
- Conversely, the slowest single month of the year, typically falling within the low season, marks the market's lowest point. In this month, revenue might dip to $691, occupancy could drop to 20.5%, and ADRs may adjust down to $93.
- Understanding both the seasonal averages and these monthly peaks and troughs in revenue, occupancy, and ADR is crucial for maximizing your Airbnb profit potential in Tarboro.
Seasonal Strategies for Maximizing Profit
- Peak Season: Maximize revenue through premium pricing and potentially longer minimum stays. Ensure high availability.
- Low Season: Offer competitive pricing, special promotions (e.g., extended stay discounts), and flexible cancellation policies. Target off-season travelers like remote workers or budget-conscious guests.
- Shoulder Seasons: Implement dynamic pricing that balances peak and low rates. Target weekend travelers or specific events. Offer slightly more flexible terms than peak season.
- Regularly analyze your own performance against these Tarboro seasonality benchmarks and adjust your pricing and availability strategy accordingly.
Best Areas for Airbnb Investment in Tarboro (2025)
Exploring the top neighborhoods for short-term rentals in Tarboro? This section highlights key areas, outlining why they are attractive for hosts and guests, along with notable local attractions. Consider these locations based on your target guest profile and investment strategy.
| Neighborhood / Area | Why Host Here? (Target Guests & Appeal) | Key Attractions & Landmarks |
|---|---|---|
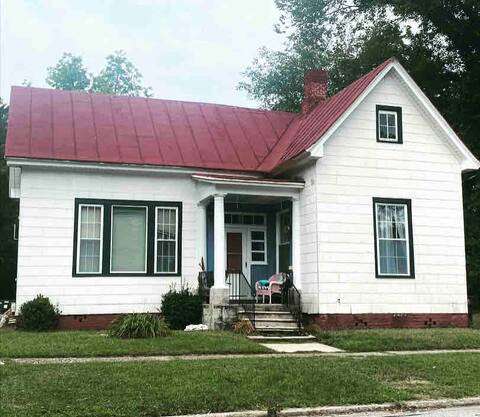
| Historic Downtown Tarboro | Charming and historic area with antique shops, cafes, and a friendly local vibe. Ideal for guests interested in exploring local history and culture. | Tarboro Town Common, Tarboro Historic District, Edgecombe County Cultural Arts Council, Happy Trails Cattle Company, Caleb Bradham House |
| Caleb's Creek | A serene neighborhood with beautiful homes and a creek. Perfect for families and nature lovers looking for a peaceful getaway close to nature. | Caleb's Creek Park, Nature trails, Picnic areas, Nearby fishing spots |
| Tar River | A beautiful location along the Tar River, great for outdoor activities. Attractive to visitors looking to enjoy nature, fishing, and kayaking. | Tar River Park, Kayaking and Canoeing, Fishing areas, Walking trails, Scenic river views |
| Princeville | A nearby town with rich African American history and cultural significance. Offers guests a unique perspective on the local heritage. | Historical Princeville Cemetery, Princeville Heritage Center, Local events and festivals, Nearby parks |
| Lakeside | A quiet residential area near lakes and parks. Inviting for guests seeking outdoor activities and relaxation by the water. | Lakeside Park, Fishing and boating, Walking trails, Picnic areas |
| Pinetops | A small rural town offering a quaint experience. Ideal for guests looking to escape the city hustle and enjoy a slower pace of life. | Pinetops Farmers Market, Local dining options, Community events |
| Battleboro | A peaceful town just outside of Tarboro with a friendly community. Suitable for visitors wanting a small-town experience with local charm. | Battleboro Park, Local dining, Historic sites |
| Conetoe | A small community surrounded by farms and natural scenery. Attractive for guests interested in rural life and agriculture. | Agricultural tours, Conetoe Community Center, Local festivals |
Understanding Airbnb License Requirements & STR Laws in Tarboro (2025)
While Tarboro, North Carolina, United States currently shows low STR regulations, specific Airbnb license requirements might still exist or change. Always verify the latest short term rental regulations and Airbnb license requirements directly with local government authorities for Tarboro to ensure full compliance before hosting.
(Source: AirROI data, 2025, based on 5% licensed listings)
Top Performing Airbnb Properties in Tarboro (2025)
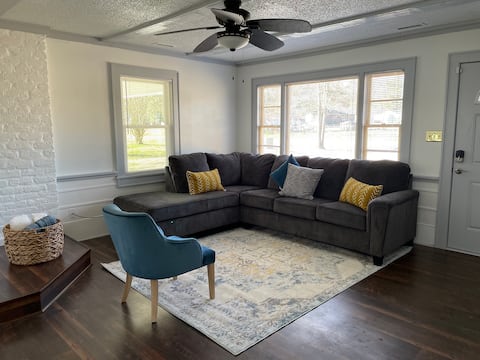
Benchmark your potential! Explore examples of top-performing Airbnb properties in Tarborobased on Trailing Twelve Month (TTM) revenue. Analyze their characteristics, revenue, occupancy rate, and ADR to understand what drives success in this market.
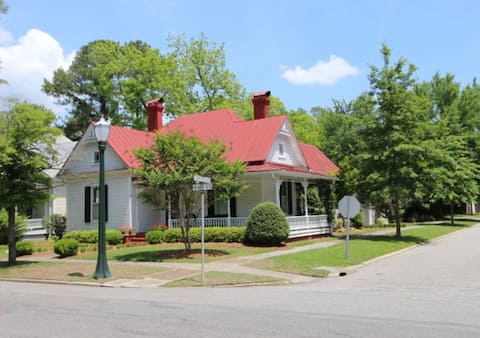
Beautifully Decorated, Historic, Main St home.
Entire Place • 2 bedrooms

Farm Stay: on a Hundred Acre Farm
Entire Place • 3 bedrooms
It’s a Family Affair
Entire Place • 3 bedrooms

The Archibald White House - historic 2 bedroom apt
Entire Place • 2 bedrooms

Apt. A - Mary Jacocks House - Historic Downtown
Entire Place • 1 bedroom
Magnolia Blossom Cottage Apt. A
Entire Place • 1 bedroom
Note: Performance varies based on location, size, amenities, seasonality, and management quality. Data reflects the past 12 months.
Top Performing Airbnb Hosts in Tarboro (2025)
Learn from the best! This table showcases top-performing Airbnb hosts in Tarboro based on the number of properties managed and estimated total revenue over the past year. Analyze their scale and performance metrics.
| Host Name | Properties | Grossing Revenue | Stay Reviews | Avg Rating |
|---|---|---|---|---|
| Tim | 2 | $30,791 | 55 | 4.88/5.0 |
| Bryan | 2 | $26,063 | 265 | 4.93/5.0 |
| Brendan | 1 | $26,018 | 65 | 4.97/5.0 |
| Matthew | 1 | $25,492 | 32 | 4.97/5.0 |
| William | 1 | $18,220 | 113 | 4.88/5.0 |
| Maggie | 1 | $13,353 | 59 | 4.92/5.0 |
| George | 1 | $12,358 | 30 | 4.93/5.0 |
| Paul | 2 | $10,709 | 53 | 4.96/5.0 |
| Kinga | 2 | $9,176 | 52 | 4.97/5.0 |
| Joseph | 1 | $7,387 | 57 | 4.88/5.0 |
Analyzing the strategies of top hosts, such as their property selection, pricing, and guest communication, can offer valuable lessons for optimizing your own Airbnb operations in Tarboro.
Dive Deeper: Advanced Tarboro STR Market Data (2025)
Ready to unlock more insights? AirROI provides access to advanced metrics and comprehensive Airbnb data for Tarboro. Explore detailed analytics beyond this report to refine your investment strategy, optimize pricing, and maximize your vacation rental profits.
Explore Advanced MetricsTarboro Short-Term Rental Market Composition (2025): Property & Room Types
Room Type Distribution
Property Type Distribution
Market Composition Insights for Tarboro
- The Tarboro Airbnb market composition is heavily skewed towards Entire Home/Apt listings, which make up 84.2% of the 19 active rentals. This indicates strong guest preference for privacy and space.
- Looking at the property type distribution in Tarboro, House properties are the most common (57.9%), reflecting the local real estate landscape.
- Houses represent a significant 57.9% portion, catering likely to families or larger groups.
Tarboro Airbnb Room Capacity Analysis (2025): Bedroom Distribution
Distribution of Listings by Number of Bedrooms
Room Capacity Insights for Tarboro
- The dominant room capacity in Tarboro is 1 bedroom listings, making up 42.1% of the market. This suggests a strong demand for properties suitable for couples or solo travelers.
- Together, 1 bedroom and 2 bedrooms properties represent 68.4% of the active Airbnb listings in Tarboro, indicating a high concentration in these sizes.
- A significant 26.4% of listings offer 3+ bedrooms, catering to larger groups and families seeking more space in Tarboro.
Tarboro Vacation Rental Guest Capacity Trends (2025)
Distribution of Listings by Guest Capacity
Guest Capacity Insights for Tarboro
- The most common guest capacity trend in Tarboro vacation rentals is listings accommodating 2 guests (26.3%). This suggests the primary traveler segment is likely couples or solo travelers.
- Properties designed for 2 guests and 4 guests dominate the Tarboro STR market, accounting for 47.4% of listings.
- 26.4% of properties accommodate 6+ guests, serving the market segment for larger families or group travel in Tarboro.
- On average, properties in Tarboro are equipped to host 3.6 guests.
Tarboro Airbnb Booking Patterns (2025): Available vs. Booked Days
Available Days Distribution
Booked Days Distribution
Booking Pattern Insights for Tarboro
- The most common availability pattern in Tarboro falls within the 271-366 days range, representing 52.6% of listings. This suggests many properties have significant open periods on their calendars.
- Approximately 100.0% of listings show high availability (181+ days open annually), indicating potential for increased bookings or specific owner usage patterns.
- For booked days, the 91-180 days range is most frequent in Tarboro (52.6%), reflecting common guest stay durations or potential owner blocking patterns.
Tarboro Airbnb Minimum Stay Requirements Analysis
Distribution of Listings by Minimum Night Requirement
1 Night
5 listings
27.8% of total
2 Nights
8 listings
44.4% of total
7-29 Nights
4 listings
22.2% of total
30+ Nights
1 listings
5.6% of total
Key Insights
- The most prevalent minimum stay requirement in Tarboro is 2 Nights, adopted by 44.4% of listings. This highlights the market's preference for shorter, flexible bookings.
- A strong majority (72.2%) of the Tarboro Airbnb data shows acceptance of very short stays (1-2 nights), indicating a dynamic, high-turnover market.
Recommendations
- Align with the market by considering a 2 Nights minimum stay, as 44.4% of Tarboro hosts use this setting.
- If feasible, allowing 1-night stays, especially midweek or during low season, could capture last-minute bookings, as only 27.8% currently do.
- Explore offering discounts for stays of 30+ nights to attract the 5.6% of the market seeking extended stays.
- Adjust minimum nights based on seasonality – potentially shorter during low season and longer during peak demand periods in Tarboro.
Tarboro Airbnb Cancellation Policy Trends Analysis (2025)
Flexible
7 listings
41.2% of total
Moderate
6 listings
35.3% of total
Firm
4 listings
23.5% of total
Cancellation Policy Insights for Tarboro
- The prevailing Airbnb cancellation policy trend in Tarboro is Flexible, used by 41.2% of listings.
- The market strongly favors guest-friendly terms, with 76.5% of listings offering Flexible or Moderate policies. This suggests guests in Tarboro may expect booking flexibility.
Recommendations for Hosts
- Consider adopting a Flexible policy to align with the 41.2% market standard in Tarboro.
- Regularly review your cancellation policy against competitors and market demand shifts in Tarboro.
Tarboro STR Booking Lead Time Analysis (2025)
Average Booking Lead Time by Month
Booking Lead Time Insights for Tarboro
- The overall average booking lead time for vacation rentals in Tarboro is 32 days.
- Guests book furthest in advance for stays during June (average 56 days), likely coinciding with peak travel demand or local events.
- The shortest booking windows occur for stays in February (average 19 days), indicating more last-minute travel plans during this time.
- Seasonally, Spring (39 days avg.) sees the longest lead times, while Fall (32 days avg.) has the shortest, reflecting typical travel planning cycles.
Recommendations for Hosts
- Use the overall average lead time (32 days) as a baseline for your pricing and availability strategy in Tarboro.
- For June stays, consider implementing length-of-stay discounts or slightly higher rates for bookings made less than 56 days out to capitalize on advance planning.
- Target marketing efforts for the Spring season well in advance (at least 39 days) to capture early planners.
- Monitor your own booking lead times against these Tarboro averages to identify opportunities for dynamic pricing adjustments.
Popular & Essential Airbnb Amenities in Tarboro (2025)
Amenity Prevalence
Amenity Insights for Tarboro
- Popular amenities like Kitchen, Air conditioning, Smoke alarm are common but not universal. Offering these can provide a competitive edge.
- Warning: Wifi is not universally provided but is considered essential globally. Ensure reliable Wifi is offered.
Recommendations for Hosts
- Consider adding popular differentiators like Kitchen or Air conditioning to increase appeal.
- Highlight unique or less common amenities you offer (e.g., hot tub, dedicated workspace, EV charger) in your listing description and photos.
- Regularly check competitor amenities in Tarboro to stay competitive.
Tarboro Airbnb Guest Demographics & Profile Analysis (2025)
Guest Profile Summary for Tarboro
- The typical guest profile for Airbnb in Tarboro consists of primarily domestic travelers (100%), often arriving from nearby Alexandria, typically belonging to the Post-2000s (Gen Z/Alpha) group (50%), primarily speaking English or Spanish.
- Domestic travelers account for 100.0% of guests.
- Top languages spoken are English (78.8%) followed by Spanish (15.2%).
- A significant demographic segment is the Post-2000s (Gen Z/Alpha) group, representing 50% of guests.
Recommendations for Hosts
- Target domestic marketing efforts towards travelers from Alexandria and Raleigh.
- Tailor amenities and listing descriptions to appeal to the dominant Post-2000s (Gen Z/Alpha) demographic (e.g., highlight fast WiFi, smart home features, local guides).
- Highlight unique local experiences or amenities relevant to the primary guest profile.
- Consider seasonal promotions aligned with peak travel times for key origin markets.
Nearby Short-Term Rental Market Comparison
How does the Tarboro Airbnb market stack up against its neighbors? Compare key performance metrics like average monthly revenue, ADR, and occupancy rates in surrounding areas to understand the broader regional STR landscape.
| Market | Active Properties | Monthly Revenue | Daily Rate | Avg. Occupancy |
|---|---|---|---|---|
| Wrightsville Beach | 453 | $4,019 | $487.73 | 38% |
| Littleton | 114 | $3,840 | $440.03 | 41% |
| Macon | 39 | $3,573 | $484.69 | 35% |
| Henrico | 71 | $3,480 | $418.21 | 39% |
| Bracey | 51 | $3,409 | $415.51 | 41% |
| Cedar Point | 25 | $3,197 | $270.75 | 48% |
| Emerald Isle | 478 | $3,049 | $349.75 | 41% |
| Indian Beach | 18 | $2,952 | $319.61 | 37% |
| Roxboro | 30 | $2,862 | $282.02 | 46% |
| Pine Knoll Shores | 79 | $2,807 | $382.46 | 36% |