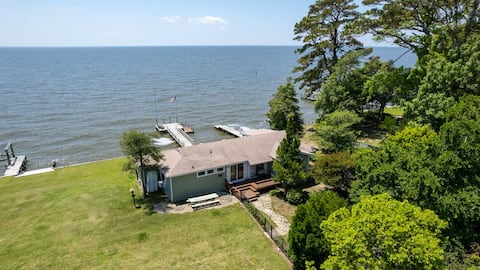
Point Harbor Airbnb Market Analysis 2025: Short Term Rental Data & Vacation Rental Statistics in North Carolina, United States
Is Airbnb profitable in Point Harbor in 2025? Explore comprehensive Airbnb analytics for Point Harbor, North Carolina, United States to uncover income potential. This 2025 STR market report for Point Harbor, based on AirROI data from April 2024 to March 2025, reveals key trends in the niche market of 17 active listings.
Whether you're considering an Airbnb investment in Point Harbor, optimizing your existing vacation rental, or exploring rental arbitrage opportunities, understanding the Point Harbor Airbnb data is crucial. Leveraging the low regulation environment is key to maximizing your short term rental income potential. Let's dive into the specifics.
Key Point Harbor Airbnb Performance Metrics Overview
Monthly Airbnb Revenue Variations & Income Potential in Point Harbor (2025)
Understanding the monthly revenue variations for Airbnb listings in Point Harbor is key to maximizing your short term rental income potential. Seasonality significantly impacts earnings. Our analysis, based on data from the past 12 months, shows that the peak revenue month for STRs in Point Harbor is typically July, while February often presents the lowest earnings, highlighting opportunities for strategic pricing adjustments during shoulder and low seasons. Explore the typical Airbnb income in Point Harbor across different performance tiers:
- Best-in-class properties (Top 10%) achieve $6,040+ monthly, often utilizing dynamic pricing and superior guest experiences.
- Strong performing properties (Top 25%) earn $4,425 or more, indicating effective management and desirable locations/amenities.
- Typical properties (Median) generate around $2,672 per month, representing the average market performance.
- Entry-level properties (Bottom 25%) see earnings around $1,290, often with potential for optimization.
Average Monthly Airbnb Earnings Trend in Point Harbor
Point Harbor Airbnb Occupancy Rate Trends (2025)
Maximize your bookings by understanding the Point Harbor STR occupancy trends. Seasonal demand shifts significantly influence how often properties are booked. Typically, Julysees the highest demand (peak season occupancy), while February experiences the lowest (low season). Effective strategies, like adjusting minimum stays or offering promotions, can boost occupancy during slower periods. Here's how different property tiers perform in Point Harbor:
- Best-in-class properties (Top 10%) achieve 83%+ occupancy, indicating high desirability and potentially optimized availability.
- Strong performing properties (Top 25%) maintain 57% or higher occupancy, suggesting good market fit and guest satisfaction.
- Typical properties (Median) have an occupancy rate around 40%.
- Entry-level properties (Bottom 25%) average 18% occupancy, potentially facing higher vacancy.
Average Monthly Occupancy Rate Trend in Point Harbor
Average Daily Rate (ADR) Airbnb Trends in Point Harbor (2025)
Effective short term rental pricing strategy in Point Harbor involves understanding monthly ADR fluctuations. The Average Daily Rate (ADR) for Airbnb in Point Harbor typically peaks in July and dips lowest during April. Leveraging Airbnb dynamic pricing tools or strategies based on this seasonality can significantly boost revenue. Here's a look at the typical nightly rates achieved:
- Best-in-class properties (Top 10%) command rates of $436+ per night, often due to premium features or locations.
- Strong performing properties (Top 25%) achieve nightly rates of $295 or more.
- Typical properties (Median) charge around $193 per night.
- Entry-level properties (Bottom 25%) earn around $115 per night.
Average Daily Rate (ADR) Trend by Month in Point Harbor
Get Live Point Harbor Market Intelligence 👇

Explore Real-time Analytics
Airbnb Seasonality Analysis & Trends in Point Harbor (2025)
Peak Season (July, June, August)
- Revenue averages $4,935 per month
- Occupancy rates average 52.8%
- Daily rates average $252
Shoulder Season
- Revenue averages $2,878 per month
- Occupancy maintains around 42.2%
- Daily rates hold near $215
Low Season (February, November, December)
- Revenue drops to average $1,968 per month
- Occupancy decreases to average 30.9%
- Daily rates adjust to average $209
Seasonality Insights for Point Harbor
- The Airbnb seasonality in Point Harbor shows highly seasonal trends requiring careful strategy. While the sections above show seasonal averages, it's also insightful to look at the extremes:
- During the high season, the absolute peak month showcases Point Harbor's highest earning potential, with monthly revenues capable of climbing to $5,227, occupancy reaching a high of 57.6%, and ADRs peaking at $257.
- Conversely, the slowest single month of the year, typically falling within the low season, marks the market's lowest point. In this month, revenue might dip to $1,832, occupancy could drop to 30.3%, and ADRs may adjust down to $203.
- Understanding both the seasonal averages and these monthly peaks and troughs in revenue, occupancy, and ADR is crucial for maximizing your Airbnb profit potential in Point Harbor.
Seasonal Strategies for Maximizing Profit
- Peak Season: Maximize revenue through premium pricing and potentially longer minimum stays. Ensure high availability.
- Low Season: Offer competitive pricing, special promotions (e.g., extended stay discounts), and flexible cancellation policies. Target off-season travelers like remote workers or budget-conscious guests.
- Shoulder Seasons: Implement dynamic pricing that balances peak and low rates. Target weekend travelers or specific events. Offer slightly more flexible terms than peak season.
- Regularly analyze your own performance against these Point Harbor seasonality benchmarks and adjust your pricing and availability strategy accordingly.
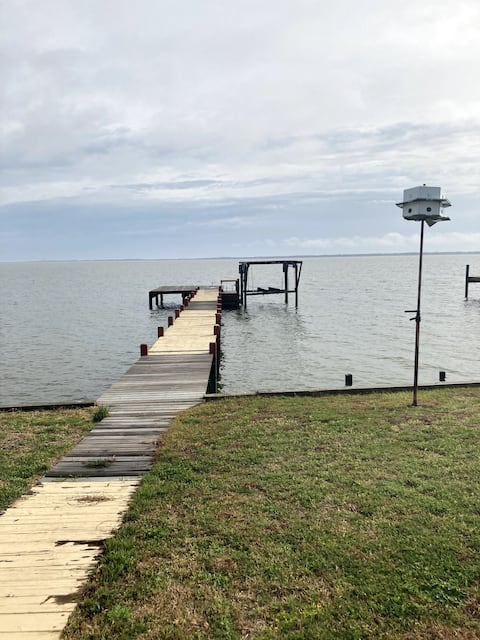
Best Areas for Airbnb Investment in Point Harbor (2025)
Exploring the top neighborhoods for short-term rentals in Point Harbor? This section highlights key areas, outlining why they are attractive for hosts and guests, along with notable local attractions. Consider these locations based on your target guest profile and investment strategy.
| Neighborhood / Area | Why Host Here? (Target Guests & Appeal) | Key Attractions & Landmarks |
|---|---|---|
| The Outer Banks | A popular vacation destination known for its beautiful beaches, water sports, and charming seaside communities. Ideal for families and beach lovers looking for a relaxed getaway. | Cape Hatteras National Seashore, Jockey's Ridge State Park, Wright Brothers National Memorial, Roanoke Island Festival Park, Nags Head Fishing, Water sports activities |
| Kitty Hawk | Famed for being the site of the Wright brothers' first flight, it offers a mix of historical significance and scenic beaches, attracting both history buffs and vacationers. | Wright Brothers National Memorial, Kitty Hawk Woods Coastal Reserve, Hiking and biking trails, Fishing spots, Local restaurants |
| Duck | Charming coastal town known for its family-friendly atmosphere, beautiful boardwalk, and scenic soundside views, making it a serene retreat. | Duck Town Park, Boardwalk and soundside shops, Oceanfront beaches, Kayaking and paddleboarding, Local art galleries |
| Corolla | Home to the famous wild horses and stunning natural beauty, Corolla is perfect for those seeking adventure and tranquility away from the crowds. | Corolla Wild Horse Tours, Currituck Beach Lighthouse, Historic Corolla Park, Wildlife viewing, Access to beautiful beaches |
| Elizabeth City | A historic city with a charming waterfront, Elizabeth City offers a unique blend of small-town charm and outdoor activities, appealing to a diverse range of visitors. | Museum of the Albemarle, Elizabeth City State University, Bertie County's historic sites, Waterfront parks, Local dining experiences |
| Manteo | Located on Roanoke Island, Manteo is rich in history and culture, featuring a quaint downtown area and access to the Outer Banks attractions. | Roanoke Island Festival Park, Elizabethan Gardens, Historic Manteo, Waterfront boardwalk, Local shops and eateries |
| Hatteras Island | A hidden gem known for its pristine beaches, fishing, and outdoor activities, Hatteras Island attracts nature enthusiasts and adventure seekers. | Cape Hatteras Lighthouse, Fishing piers and charters, Ocracoke Island access, Wildlife and bird watching, Diverse water activities |
| Nags Head | A vibrant beach town known for its beautiful sandy beaches, Nags Head offers plenty of entertainment options and natural beauty, making it a favorite among tourists. | Nags Head Pier, Jockey's Ridge State Park, Dunes and beaches, Local restaurants and shops, Water sports galore |
Understanding Airbnb License Requirements & STR Laws in Point Harbor (2025)
While Point Harbor, North Carolina, United States currently shows low STR regulations, specific Airbnb license requirements might still exist or change. Always verify the latest short term rental regulations and Airbnb license requirements directly with local government authorities for Point Harbor to ensure full compliance before hosting.
(Source: AirROI data, 2025, finding no licensed listings among those analyzed)
Top Performing Airbnb Properties in Point Harbor (2025)
Benchmark your potential! Explore examples of top-performing Airbnb properties in Point Harborbased on Trailing Twelve Month (TTM) revenue. Analyze their characteristics, revenue, occupancy rate, and ADR to understand what drives success in this market.

Morris Oasis, Pool, Hot Tub, Game Room, Fast Wifi
Entire Place • 4 bedrooms
Waveney Cottage 2 Bedroom Home , Now Pet Friendly!
Entire Place • 2 bedrooms

Romantic Soundfront retreat private hot tub/deck
Entire Place • 1 bedroom
Cozy 4 bedroom cottage on the Currituck Sound
Entire Place • 4 bedrooms
Anchors Away II Enjoy the beautiful Sound View
Entire Place • 4 bedrooms
HELLO SUNSHINE...THE CURRITUCK SOUND AWAITS YOU
Entire Place • 3 bedrooms
Note: Performance varies based on location, size, amenities, seasonality, and management quality. Data reflects the past 12 months.
Top Performing Airbnb Hosts in Point Harbor (2025)
Learn from the best! This table showcases top-performing Airbnb hosts in Point Harbor based on the number of properties managed and estimated total revenue over the past year. Analyze their scale and performance metrics.
| Host Name | Properties | Grossing Revenue | Stay Reviews | Avg Rating |
|---|---|---|---|---|
| Nancy | 1 | $77,840 | 165 | 4.87/5.0 |
| Kees Vacations | 1 | $58,930 | 64 | 4.69/5.0 |
| Jimmy | 4 | $55,929 | 81 | 4.93/5.0 |
| Donna | 1 | $52,749 | 430 | 4.95/5.0 |
| Russell | 1 | $36,524 | 47 | 4.91/5.0 |
| Host #130507405 | 1 | $32,307 | 0 | 0.00/5.0 |
| Host #400363701 | 1 | $31,893 | 127 | 4.63/5.0 |
| Terri | 1 | $31,346 | 54 | 5.00/5.0 |
| Adriel | 1 | $23,527 | 12 | 4.83/5.0 |
| Tina And David | 1 | $19,118 | 9 | 5.00/5.0 |
Analyzing the strategies of top hosts, such as their property selection, pricing, and guest communication, can offer valuable lessons for optimizing your own Airbnb operations in Point Harbor.
Dive Deeper: Advanced Point Harbor STR Market Data (2025)
Ready to unlock more insights? AirROI provides access to advanced metrics and comprehensive Airbnb data for Point Harbor. Explore detailed analytics beyond this report to refine your investment strategy, optimize pricing, and maximize your vacation rental profits.
Explore Advanced MetricsPoint Harbor Short-Term Rental Market Composition (2025): Property & Room Types
Room Type Distribution
Property Type Distribution
Market Composition Insights for Point Harbor
- The Point Harbor Airbnb market composition is heavily skewed towards Entire Home/Apt listings, which make up 76.5% of the 17 active rentals. This indicates strong guest preference for privacy and space.
- Looking at the property type distribution in Point Harbor, House properties are the most common (82.4%), reflecting the local real estate landscape.
- Houses represent a significant 82.4% portion, catering likely to families or larger groups.
- The presence of 5.9% Hotel/Boutique listings indicates integration with traditional hospitality.
Point Harbor Airbnb Room Capacity Analysis (2025): Bedroom Distribution
Distribution of Listings by Number of Bedrooms
Room Capacity Insights for Point Harbor
- The dominant room capacity in Point Harbor is 4 bedrooms listings, making up 29.4% of the market. This suggests a strong demand for properties suitable for families or small groups.
- Together, 4 bedrooms and 1 bedroom properties represent 52.9% of the active Airbnb listings in Point Harbor, indicating a high concentration in these sizes.
- A significant 47.0% of listings offer 3+ bedrooms, catering to larger groups and families seeking more space in Point Harbor.
Point Harbor Vacation Rental Guest Capacity Trends (2025)
Distribution of Listings by Guest Capacity
Guest Capacity Insights for Point Harbor
- The most common guest capacity trend in Point Harbor vacation rentals is listings accommodating 8+ guests (35.3%). This suggests the primary traveler segment is likely larger groups.
- Properties designed for 8+ guests and 2 guests dominate the Point Harbor STR market, accounting for 64.7% of listings.
- 47.1% of properties accommodate 6+ guests, serving the market segment for larger families or group travel in Point Harbor.
- On average, properties in Point Harbor are equipped to host 4.6 guests.
Point Harbor Airbnb Booking Patterns (2025): Available vs. Booked Days
Available Days Distribution
Booked Days Distribution
Booking Pattern Insights for Point Harbor
- The most common availability pattern in Point Harbor falls within the 181-270 days range, representing 47.1% of listings. This suggests many properties have significant open periods on their calendars.
- Approximately 82.4% of listings show high availability (181+ days open annually), indicating potential for increased bookings or specific owner usage patterns.
- For booked days, the 91-180 days range is most frequent in Point Harbor (47.1%), reflecting common guest stay durations or potential owner blocking patterns.
- A notable 17.7% of properties secure long booking periods (181+ days booked per year), highlighting successful long-term rental strategies or significant owner usage.
Point Harbor Airbnb Minimum Stay Requirements Analysis
Distribution of Listings by Minimum Night Requirement
1 Night
6 listings
42.9% of total
2 Nights
5 listings
35.7% of total
3 Nights
2 listings
14.3% of total
30+ Nights
1 listings
7.1% of total
Key Insights
- The most prevalent minimum stay requirement in Point Harbor is 1 Night, adopted by 42.9% of listings. This highlights the market's preference for shorter, flexible bookings.
- A strong majority (78.6%) of the Point Harbor Airbnb data shows acceptance of very short stays (1-2 nights), indicating a dynamic, high-turnover market.
Recommendations
- Align with the market by considering a 1 Night minimum stay, as 42.9% of Point Harbor hosts use this setting.
- Explore offering discounts for stays of 30+ nights to attract the 7.1% of the market seeking extended stays.
- Adjust minimum nights based on seasonality – potentially shorter during low season and longer during peak demand periods in Point Harbor.
Point Harbor Airbnb Cancellation Policy Trends Analysis (2025)
Super Strict 60 Days
1 listings
7.1% of total
Flexible
2 listings
14.3% of total
Moderate
3 listings
21.4% of total
Firm
3 listings
21.4% of total
Strict
5 listings
35.7% of total
Cancellation Policy Insights for Point Harbor
- The prevailing Airbnb cancellation policy trend in Point Harbor is Strict, used by 35.7% of listings.
- A majority (57.1%) of hosts in Point Harbor utilize Firm or Strict policies, indicating a market where hosts prioritize booking security.
Recommendations for Hosts
- Consider adopting a Strict policy to align with the 35.7% market standard in Point Harbor.
- With 35.7% using Strict terms, this is a viable option in Point Harbor, particularly for high-value properties or during peak demand periods.
- Regularly review your cancellation policy against competitors and market demand shifts in Point Harbor.
Point Harbor STR Booking Lead Time Analysis (2025)
Average Booking Lead Time by Month
Booking Lead Time Insights for Point Harbor
- The overall average booking lead time for vacation rentals in Point Harbor is 45 days.
- Guests book furthest in advance for stays during June (average 102 days), likely coinciding with peak travel demand or local events.
- The shortest booking windows occur for stays in January (average 14 days), indicating more last-minute travel plans during this time.
- Seasonally, Summer (78 days avg.) sees the longest lead times, while Winter (26 days avg.) has the shortest, reflecting typical travel planning cycles.
Recommendations for Hosts
- Use the overall average lead time (45 days) as a baseline for your pricing and availability strategy in Point Harbor.
- For June stays, consider implementing length-of-stay discounts or slightly higher rates for bookings made less than 102 days out to capitalize on advance planning.
- During January, focus on last-minute booking availability and promotions, as guests book with very short notice (14 days avg.).
- Target marketing efforts for the Summer season well in advance (at least 78 days) to capture early planners.
- Monitor your own booking lead times against these Point Harbor averages to identify opportunities for dynamic pricing adjustments.
Popular & Essential Airbnb Amenities in Point Harbor (2025)
Amenity Prevalence
Amenity Insights for Point Harbor
- Essential amenities in Point Harbor that guests expect include: Air conditioning, Free parking on premises. Lacking these (any) could significantly impact bookings.
- Popular amenities like Bed linens, Essentials, Hangers are common but not universal. Offering these can provide a competitive edge.
- Warning: Wifi is not universally provided but is considered essential globally. Ensure reliable Wifi is offered.
Recommendations for Hosts
- Ensure your listing includes all essential amenities for Point Harbor: Air conditioning, Free parking on premises.
- Consider adding popular differentiators like Bed linens or Essentials to increase appeal.
- Highlight unique or less common amenities you offer (e.g., hot tub, dedicated workspace, EV charger) in your listing description and photos.
- Regularly check competitor amenities in Point Harbor to stay competitive.
Point Harbor Airbnb Guest Demographics & Profile Analysis (2025)
Guest Profile Summary for Point Harbor
- The typical guest profile for Airbnb in Point Harbor consists of primarily domestic travelers (98%), often arriving from nearby Raleigh, typically belonging to the Post-2000s (Gen Z/Alpha) group (50%), primarily speaking English or Spanish.
- Domestic travelers account for 97.5% of guests.
- Key international markets include United States (97.5%) and Canada (1.3%).
- Top languages spoken are English (67%) followed by Spanish (13%).
- A significant demographic segment is the Post-2000s (Gen Z/Alpha) group, representing 50% of guests.
Recommendations for Hosts
- Target domestic marketing efforts towards travelers from Raleigh and Wilmington.
- Tailor amenities and listing descriptions to appeal to the dominant Post-2000s (Gen Z/Alpha) demographic (e.g., highlight fast WiFi, smart home features, local guides).
- Highlight unique local experiences or amenities relevant to the primary guest profile.
- Consider seasonal promotions aligned with peak travel times for key origin markets.
Nearby Short-Term Rental Market Comparison
How does the Point Harbor Airbnb market stack up against its neighbors? Compare key performance metrics like average monthly revenue, ADR, and occupancy rates in surrounding areas to understand the broader regional STR landscape.
| Market | Active Properties | Monthly Revenue | Daily Rate | Avg. Occupancy |
|---|---|---|---|---|
| Nashville | 14 | $5,539 | $688.07 | 47% |
| Salvo | 86 | $4,434 | $438.60 | 40% |
| Weems | 10 | $4,181 | $292.24 | 51% |
| White Stone | 39 | $4,160 | $359.94 | 45% |
| Lanexa | 13 | $4,132 | $286.24 | 49% |
| Cobbs Creek | 11 | $3,910 | $294.28 | 45% |
| Gloucester County | 11 | $3,725 | $219.31 | 49% |
| Cape Charles | 226 | $3,692 | $371.98 | 40% |
| Corolla | 775 | $3,626 | $445.01 | 40% |
| Rodanthe | 125 | $3,625 | $362.82 | 42% |