Arapahoe Airbnb Market Analysis 2025: Short Term Rental Data & Vacation Rental Statistics in North Carolina, United States
Is Airbnb profitable in Arapahoe in 2025? Explore comprehensive Airbnb analytics for Arapahoe, North Carolina, United States to uncover income potential. This 2025 STR market report for Arapahoe, based on AirROI data from April 2024 to March 2025, reveals key trends in the niche market of 18 active listings.
Whether you're considering an Airbnb investment in Arapahoe, optimizing your existing vacation rental, or exploring rental arbitrage opportunities, understanding the Arapahoe Airbnb data is crucial. Leveraging the low regulation environment is key to maximizing your short term rental income potential. Let's dive into the specifics.
Key Arapahoe Airbnb Performance Metrics Overview
Monthly Airbnb Revenue Variations & Income Potential in Arapahoe (2025)
Understanding the monthly revenue variations for Airbnb listings in Arapahoe is key to maximizing your short term rental income potential. Seasonality significantly impacts earnings. Our analysis, based on data from the past 12 months, shows that the peak revenue month for STRs in Arapahoe is typically June, while January often presents the lowest earnings, highlighting opportunities for strategic pricing adjustments during shoulder and low seasons. Explore the typical Airbnb income in Arapahoe across different performance tiers:
- Best-in-class properties (Top 10%) achieve $4,292+ monthly, often utilizing dynamic pricing and superior guest experiences.
- Strong performing properties (Top 25%) earn $3,129 or more, indicating effective management and desirable locations/amenities.
- Typical properties (Median) generate around $2,118 per month, representing the average market performance.
- Entry-level properties (Bottom 25%) see earnings around $1,193, often with potential for optimization.
Average Monthly Airbnb Earnings Trend in Arapahoe
Arapahoe Airbnb Occupancy Rate Trends (2025)
Maximize your bookings by understanding the Arapahoe STR occupancy trends. Seasonal demand shifts significantly influence how often properties are booked. Typically, Junesees the highest demand (peak season occupancy), while February experiences the lowest (low season). Effective strategies, like adjusting minimum stays or offering promotions, can boost occupancy during slower periods. Here's how different property tiers perform in Arapahoe:
- Best-in-class properties (Top 10%) achieve 61%+ occupancy, indicating high desirability and potentially optimized availability.
- Strong performing properties (Top 25%) maintain 45% or higher occupancy, suggesting good market fit and guest satisfaction.
- Typical properties (Median) have an occupancy rate around 32%.
- Entry-level properties (Bottom 25%) average 19% occupancy, potentially facing higher vacancy.
Average Monthly Occupancy Rate Trend in Arapahoe
Average Daily Rate (ADR) Airbnb Trends in Arapahoe (2025)
Effective short term rental pricing strategy in Arapahoe involves understanding monthly ADR fluctuations. The Average Daily Rate (ADR) for Airbnb in Arapahoe typically peaks in July and dips lowest during December. Leveraging Airbnb dynamic pricing tools or strategies based on this seasonality can significantly boost revenue. Here's a look at the typical nightly rates achieved:
- Best-in-class properties (Top 10%) command rates of $306+ per night, often due to premium features or locations.
- Strong performing properties (Top 25%) achieve nightly rates of $275 or more.
- Typical properties (Median) charge around $222 per night.
- Entry-level properties (Bottom 25%) earn around $164 per night.
Average Daily Rate (ADR) Trend by Month in Arapahoe
Get Live Arapahoe Market Intelligence 👇

Explore Real-time Analytics
Airbnb Seasonality Analysis & Trends in Arapahoe (2025)
Peak Season (June, July, August)
- Revenue averages $4,096 per month
- Occupancy rates average 53.9%
- Daily rates average $251
Shoulder Season
- Revenue averages $2,148 per month
- Occupancy maintains around 32.1%
- Daily rates hold near $223
Low Season (January, February, March)
- Revenue drops to average $957 per month
- Occupancy decreases to average 19.2%
- Daily rates adjust to average $192
Seasonality Insights for Arapahoe
- The Airbnb seasonality in Arapahoe shows highly seasonal trends requiring careful strategy. While the sections above show seasonal averages, it's also insightful to look at the extremes:
- During the high season, the absolute peak month showcases Arapahoe's highest earning potential, with monthly revenues capable of climbing to $4,334, occupancy reaching a high of 59.5%, and ADRs peaking at $251.
- Conversely, the slowest single month of the year, typically falling within the low season, marks the market's lowest point. In this month, revenue might dip to $841, occupancy could drop to 17.9%, and ADRs may adjust down to $191.
- Understanding both the seasonal averages and these monthly peaks and troughs in revenue, occupancy, and ADR is crucial for maximizing your Airbnb profit potential in Arapahoe.
Seasonal Strategies for Maximizing Profit
- Peak Season: Maximize revenue through premium pricing and potentially longer minimum stays. Ensure high availability.
- Low Season: Offer competitive pricing, special promotions (e.g., extended stay discounts), and flexible cancellation policies. Target off-season travelers like remote workers or budget-conscious guests.
- Shoulder Seasons: Implement dynamic pricing that balances peak and low rates. Target weekend travelers or specific events. Offer slightly more flexible terms than peak season.
- Regularly analyze your own performance against these Arapahoe seasonality benchmarks and adjust your pricing and availability strategy accordingly.
Best Areas for Airbnb Investment in Arapahoe (2025)
Exploring the top neighborhoods for short-term rentals in Arapahoe? This section highlights key areas, outlining why they are attractive for hosts and guests, along with notable local attractions. Consider these locations based on your target guest profile and investment strategy.
| Neighborhood / Area | Why Host Here? (Target Guests & Appeal) | Key Attractions & Landmarks |
|---|---|---|
| Arapahoe Village | A serene and charming village atmosphere with a welcoming community that's perfect for families and travelers seeking a peaceful getaway. Close to natural beauty and outdoor activities. | Lake Mattamuskeet, Pungo River, Historic Churches, Local Farm Stands, Nature Trails |
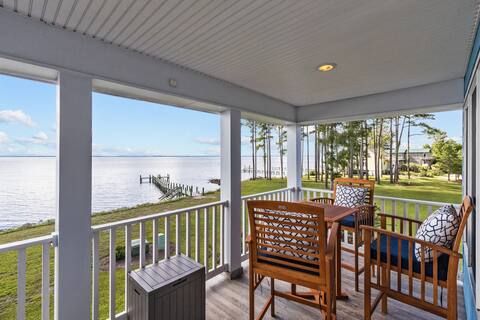
| Arapahoe waterfront | Stunning views and a relaxing experience by the water, ideal for those who love water activities and fishing. A picturesque spot that attracts tourists looking for tranquility. | Dockside Fish Markets, Fishing Spots, Waterfront Parks, Boating Opportunities, Local Restaurants with Seafood |
| Near Pamlico Sound | A prime location for water sports enthusiasts and nature lovers, with easy access to the beautiful Pamlico Sound and its natural surroundings. | Pamlico Sound, Kayaking and Canoeing, Wildlife Watching, Scenic Hikes, Historic Sites |
| Hunting Creek | A quiet community that offers great access to outdoor adventures and an authentic Southern living experience. Perfect for guests looking to explore rural North Carolina. | Hunting Creek Park, Local Wildlife, Cycling Trails, Hiking Routes, Community Events |
| Historic Arapahoe | Rich in history with preserved sites and stories from the past. Ideal for history buffs who appreciate local culture and heritage. | Historic Landmarks, Local Museums, Cultural Events, Art Exhibits, College/University History |
| Arapahoe Farms | A rural area with beautiful farmland views, perfect for those seeking a peaceful countryside escape. Great for families and pets. | Farm Tours, Local Produce Sales, Scenic Views, Camping/Outdoor Activities, Family-Friendly Attractions |
| Coastal Region of Arapahoe | Close proximity to the coast, attracting beach lovers and vacationers wanting sun and fun by the sea. A great place for summer activities. | Beach Access, Water Sports, Coastal Dining, Fisheries, Community Festivals |
| Arapahoe Arts District | An emerging arts scene with local galleries, studios, and vibrant community events. Suitable for tourists looking for a creative vibe and local art. | Art Galleries, Local Art Shows, Craft Workshops, Cultural Festivals, Food Markets |
Understanding Airbnb License Requirements & STR Laws in Arapahoe (2025)
While Arapahoe, North Carolina, United States currently shows low STR regulations, specific Airbnb license requirements might still exist or change. Always verify the latest short term rental regulations and Airbnb license requirements directly with local government authorities for Arapahoe to ensure full compliance before hosting.
(Source: AirROI data, 2025, finding no licensed listings among those analyzed)
Top Performing Airbnb Properties in Arapahoe (2025)
Benchmark your potential! Explore examples of top-performing Airbnb properties in Arapahoebased on Trailing Twelve Month (TTM) revenue. Analyze their characteristics, revenue, occupancy rate, and ADR to understand what drives success in this market.
Neuse Village #3 - Check out the amazing views!
Entire Place • 2 bedrooms
Romantic Sunrise Waterfront Cottage Oriental NC
Entire Place • 3 bedrooms
Neuse Village #6 - You'll want to stay forever
Entire Place • 2 bedrooms
Neuse River Cottage
Entire Place • 2 bedrooms
Jasmine Cottage - Enjoy the breathtaking views!
Entire Place • 2 bedrooms
Neuse Village #5 - Quaint cottage & amazing views
Entire Place • 2 bedrooms
Note: Performance varies based on location, size, amenities, seasonality, and management quality. Data reflects the past 12 months.
Top Performing Airbnb Hosts in Arapahoe (2025)
Learn from the best! This table showcases top-performing Airbnb hosts in Arapahoe based on the number of properties managed and estimated total revenue over the past year. Analyze their scale and performance metrics.
| Host Name | Properties | Grossing Revenue | Stay Reviews | Avg Rating |
|---|---|---|---|---|
| Beth Frazer & Associates, Inc. | 8 | $178,167 | 200 | 4.78/5.0 |
| Glenda | 3 | $69,975 | 139 | 4.88/5.0 |
| Dana | 1 | $39,431 | 71 | 4.96/5.0 |
| Chris And Bill | 1 | $18,836 | 369 | 4.97/5.0 |
| Sabrina | 1 | $17,243 | 12 | 5.00/5.0 |
| Maria Machle | 1 | $17,028 | 56 | 4.79/5.0 |
| Beth | 1 | $14,802 | 60 | 4.95/5.0 |
| Kimberly | 1 | $6,366 | 32 | 4.97/5.0 |
| Evolve | 1 | $4,213 | 23 | 4.74/5.0 |
Analyzing the strategies of top hosts, such as their property selection, pricing, and guest communication, can offer valuable lessons for optimizing your own Airbnb operations in Arapahoe.
Dive Deeper: Advanced Arapahoe STR Market Data (2025)
Ready to unlock more insights? AirROI provides access to advanced metrics and comprehensive Airbnb data for Arapahoe. Explore detailed analytics beyond this report to refine your investment strategy, optimize pricing, and maximize your vacation rental profits.
Explore Advanced MetricsArapahoe Short-Term Rental Market Composition (2025): Property & Room Types
Room Type Distribution
Property Type Distribution
Market Composition Insights for Arapahoe
- The Arapahoe Airbnb market composition is heavily skewed towards Entire Home/Apt listings, which make up 100% of the 18 active rentals. This indicates strong guest preference for privacy and space.
- Looking at the property type distribution in Arapahoe, House properties are the most common (94.4%), reflecting the local real estate landscape.
- Houses represent a significant 94.4% portion, catering likely to families or larger groups.
- The presence of 5.6% Hotel/Boutique listings indicates integration with traditional hospitality.
Arapahoe Airbnb Room Capacity Analysis (2025): Bedroom Distribution
Distribution of Listings by Number of Bedrooms
Room Capacity Insights for Arapahoe
- The dominant room capacity in Arapahoe is 2 bedrooms listings, making up 66.7% of the market. This suggests a strong demand for properties suitable for couples or solo travelers.
- Together, 2 bedrooms and 3 bedrooms properties represent 94.5% of the active Airbnb listings in Arapahoe, indicating a high concentration in these sizes.
- A significant 27.8% of listings offer 3+ bedrooms, catering to larger groups and families seeking more space in Arapahoe.
Arapahoe Vacation Rental Guest Capacity Trends (2025)
Distribution of Listings by Guest Capacity
Guest Capacity Insights for Arapahoe
- The most common guest capacity trend in Arapahoe vacation rentals is listings accommodating 4 guests (61.1%). This suggests the primary traveler segment is likely small families or groups.
- Properties designed for 4 guests and 6 guests dominate the Arapahoe STR market, accounting for 77.8% of listings.
- 33.4% of properties accommodate 6+ guests, serving the market segment for larger families or group travel in Arapahoe.
- On average, properties in Arapahoe are equipped to host 4.9 guests.
Arapahoe Airbnb Booking Patterns (2025): Available vs. Booked Days
Available Days Distribution
Booked Days Distribution
Booking Pattern Insights for Arapahoe
- The most common availability pattern in Arapahoe falls within the 271-366 days range, representing 55.6% of listings. This suggests many properties have significant open periods on their calendars.
- Approximately 94.5% of listings show high availability (181+ days open annually), indicating potential for increased bookings or specific owner usage patterns.
- For booked days, the 91-180 days range is most frequent in Arapahoe (44.4%), reflecting common guest stay durations or potential owner blocking patterns.
- A notable 5.6% of properties secure long booking periods (181+ days booked per year), highlighting successful long-term rental strategies or significant owner usage.
Arapahoe Airbnb Minimum Stay Requirements Analysis
Distribution of Listings by Minimum Night Requirement
1 Night
2 listings
11.1% of total
2 Nights
15 listings
83.3% of total
30+ Nights
1 listings
5.6% of total
Key Insights
- The most prevalent minimum stay requirement in Arapahoe is 2 Nights, adopted by 83.3% of listings. This highlights the market's preference for shorter, flexible bookings.
- A strong majority (94.4%) of the Arapahoe Airbnb data shows acceptance of very short stays (1-2 nights), indicating a dynamic, high-turnover market.
Recommendations
- Align with the market by considering a 2 Nights minimum stay, as 83.3% of Arapahoe hosts use this setting.
- If feasible, allowing 1-night stays, especially midweek or during low season, could capture last-minute bookings, as only 11.1% currently do.
- A 2-night minimum appears standard (83.3%). Consider this for weekends or peak periods.
- Explore offering discounts for stays of 30+ nights to attract the 5.6% of the market seeking extended stays.
- Adjust minimum nights based on seasonality – potentially shorter during low season and longer during peak demand periods in Arapahoe.
Arapahoe Airbnb Cancellation Policy Trends Analysis (2025)
Flexible
2 listings
11.1% of total
Moderate
2 listings
11.1% of total
Firm
3 listings
16.7% of total
Strict
11 listings
61.1% of total
Cancellation Policy Insights for Arapahoe
- The prevailing Airbnb cancellation policy trend in Arapahoe is Strict, used by 61.1% of listings.
- A majority (77.8%) of hosts in Arapahoe utilize Firm or Strict policies, indicating a market where hosts prioritize booking security.
Recommendations for Hosts
- Consider adopting a Strict policy to align with the 61.1% market standard in Arapahoe.
- With 61.1% using Strict terms, this is a viable option in Arapahoe, particularly for high-value properties or during peak demand periods.
- Regularly review your cancellation policy against competitors and market demand shifts in Arapahoe.
Arapahoe STR Booking Lead Time Analysis (2025)
Average Booking Lead Time by Month
Booking Lead Time Insights for Arapahoe
- The overall average booking lead time for vacation rentals in Arapahoe is 56 days.
- Guests book furthest in advance for stays during June (average 106 days), likely coinciding with peak travel demand or local events.
- The shortest booking windows occur for stays in January (average 32 days), indicating more last-minute travel plans during this time.
- Seasonally, Summer (83 days avg.) sees the longest lead times, while Spring (53 days avg.) has the shortest, reflecting typical travel planning cycles.
Recommendations for Hosts
- Use the overall average lead time (56 days) as a baseline for your pricing and availability strategy in Arapahoe.
- For June stays, consider implementing length-of-stay discounts or slightly higher rates for bookings made less than 106 days out to capitalize on advance planning.
- Target marketing efforts for the Summer season well in advance (at least 83 days) to capture early planners.
- Monitor your own booking lead times against these Arapahoe averages to identify opportunities for dynamic pricing adjustments.
Popular & Essential Airbnb Amenities in Arapahoe (2025)
Amenity Prevalence
Amenity Insights for Arapahoe
- Essential amenities in Arapahoe that guests expect include: TV, Wifi, Washer, Air conditioning. Lacking these (any) could significantly impact bookings.
- Popular amenities like Bed linens, Oven, Smoke alarm are common but not universal. Offering these can provide a competitive edge.
Recommendations for Hosts
- Ensure your listing includes all essential amenities for Arapahoe: TV, Wifi, Washer, Air conditioning.
- Consider adding popular differentiators like Bed linens or Oven to increase appeal.
- Highlight unique or less common amenities you offer (e.g., hot tub, dedicated workspace, EV charger) in your listing description and photos.
- Regularly check competitor amenities in Arapahoe to stay competitive.
Arapahoe Airbnb Guest Demographics & Profile Analysis (2025)
Guest Profile Summary for Arapahoe
- The typical guest profile for Airbnb in Arapahoe consists of primarily domestic travelers (99%), often arriving from nearby Raleigh, typically belonging to the Post-2000s (Gen Z/Alpha) group (50%), primarily speaking English or Spanish.
- Domestic travelers account for 99.0% of guests.
- Key international markets include United States (99%) and DC (1%).
- Top languages spoken are English (77.8%) followed by Spanish (11.1%).
- A significant demographic segment is the Post-2000s (Gen Z/Alpha) group, representing 50% of guests.
Recommendations for Hosts
- Target domestic marketing efforts towards travelers from Raleigh and Winston-Salem.
- Tailor amenities and listing descriptions to appeal to the dominant Post-2000s (Gen Z/Alpha) demographic (e.g., highlight fast WiFi, smart home features, local guides).
- Highlight unique local experiences or amenities relevant to the primary guest profile.
- Consider seasonal promotions aligned with peak travel times for key origin markets.
Nearby Short-Term Rental Market Comparison
How does the Arapahoe Airbnb market stack up against its neighbors? Compare key performance metrics like average monthly revenue, ADR, and occupancy rates in surrounding areas to understand the broader regional STR landscape.
| Market | Active Properties | Monthly Revenue | Daily Rate | Avg. Occupancy |
|---|---|---|---|---|
| Salvo | 86 | $4,434 | $438.60 | 40% |
| Wrightsville Beach | 438 | $4,415 | $480.27 | 40% |
| Indian Beach | 15 | $3,989 | $334.51 | 41% |
| Bald Head Island | 174 | $3,933 | $508.25 | 35% |
| Cedar Point | 24 | $3,702 | $272.42 | 48% |
| Emerald Isle | 449 | $3,694 | $347.49 | 42% |
| Rodanthe | 125 | $3,625 | $362.82 | 42% |
| Kure Beach | 453 | $3,526 | $371.29 | 41% |
| Nags Head | 741 | $3,468 | $359.74 | 42% |
| Surf City | 632 | $3,311 | $323.50 | 41% |