Tuckerton Airbnb Market Analysis 2025: Short Term Rental Data & Vacation Rental Statistics in New Jersey, United States
Is Airbnb profitable in Tuckerton in 2025? Explore comprehensive Airbnb analytics for Tuckerton, New Jersey, United States to uncover income potential. This 2025 STR market report for Tuckerton, based on AirROI data from April 2024 to March 2025, reveals key trends in the niche market of 17 active listings.
Whether you're considering an Airbnb investment in Tuckerton, optimizing your existing vacation rental, or exploring rental arbitrage opportunities, understanding the Tuckerton Airbnb data is crucial. Leveraging the low regulation environment is key to maximizing your short term rental income potential. Let's dive into the specifics.
Key Tuckerton Airbnb Performance Metrics Overview
Monthly Airbnb Revenue Variations & Income Potential in Tuckerton (2025)
Understanding the monthly revenue variations for Airbnb listings in Tuckerton is key to maximizing your short term rental income potential. Seasonality significantly impacts earnings. Our analysis, based on data from the past 12 months, shows that the peak revenue month for STRs in Tuckerton is typically August, while January often presents the lowest earnings, highlighting opportunities for strategic pricing adjustments during shoulder and low seasons. Explore the typical Airbnb income in Tuckerton across different performance tiers:
- Best-in-class properties (Top 10%) achieve $8,208+ monthly, often utilizing dynamic pricing and superior guest experiences.
- Strong performing properties (Top 25%) earn $6,103 or more, indicating effective management and desirable locations/amenities.
- Typical properties (Median) generate around $3,589 per month, representing the average market performance.
- Entry-level properties (Bottom 25%) see earnings around $1,990, often with potential for optimization.
Average Monthly Airbnb Earnings Trend in Tuckerton
Tuckerton Airbnb Occupancy Rate Trends (2025)
Maximize your bookings by understanding the Tuckerton STR occupancy trends. Seasonal demand shifts significantly influence how often properties are booked. Typically, Augustsees the highest demand (peak season occupancy), while January experiences the lowest (low season). Effective strategies, like adjusting minimum stays or offering promotions, can boost occupancy during slower periods. Here's how different property tiers perform in Tuckerton:
- Best-in-class properties (Top 10%) achieve 80%+ occupancy, indicating high desirability and potentially optimized availability.
- Strong performing properties (Top 25%) maintain 58% or higher occupancy, suggesting good market fit and guest satisfaction.
- Typical properties (Median) have an occupancy rate around 30%.
- Entry-level properties (Bottom 25%) average 20% occupancy, potentially facing higher vacancy.
Average Monthly Occupancy Rate Trend in Tuckerton
Average Daily Rate (ADR) Airbnb Trends in Tuckerton (2025)
Effective short term rental pricing strategy in Tuckerton involves understanding monthly ADR fluctuations. The Average Daily Rate (ADR) for Airbnb in Tuckerton typically peaks in March and dips lowest during October. Leveraging Airbnb dynamic pricing tools or strategies based on this seasonality can significantly boost revenue. Here's a look at the typical nightly rates achieved:
- Best-in-class properties (Top 10%) command rates of $528+ per night, often due to premium features or locations.
- Strong performing properties (Top 25%) achieve nightly rates of $400 or more.
- Typical properties (Median) charge around $339 per night.
- Entry-level properties (Bottom 25%) earn around $232 per night.
Average Daily Rate (ADR) Trend by Month in Tuckerton
Get Live Tuckerton Market Intelligence 👇

Explore Real-time Analytics
Airbnb Seasonality Analysis & Trends in Tuckerton (2025)
Peak Season (August, July, May)
- Revenue averages $7,772 per month
- Occupancy rates average 56.1%
- Daily rates average $348
Shoulder Season
- Revenue averages $3,707 per month
- Occupancy maintains around 38.2%
- Daily rates hold near $338
Low Season (January, February, March)
- Revenue drops to average $1,873 per month
- Occupancy decreases to average 30.3%
- Daily rates adjust to average $358
Seasonality Insights for Tuckerton
- The Airbnb seasonality in Tuckerton shows highly seasonal trends requiring careful strategy. While the sections above show seasonal averages, it's also insightful to look at the extremes:
- During the high season, the absolute peak month showcases Tuckerton's highest earning potential, with monthly revenues capable of climbing to $9,643, occupancy reaching a high of 71.0%, and ADRs peaking at $359.
- Conversely, the slowest single month of the year, typically falling within the low season, marks the market's lowest point. In this month, revenue might dip to $1,148, occupancy could drop to 20.0%, and ADRs may adjust down to $324.
- Understanding both the seasonal averages and these monthly peaks and troughs in revenue, occupancy, and ADR is crucial for maximizing your Airbnb profit potential in Tuckerton.
Seasonal Strategies for Maximizing Profit
- Peak Season: Maximize revenue through premium pricing and potentially longer minimum stays. Ensure high availability.
- Low Season: Offer competitive pricing, special promotions (e.g., extended stay discounts), and flexible cancellation policies. Target off-season travelers like remote workers or budget-conscious guests.
- Shoulder Seasons: Implement dynamic pricing that balances peak and low rates. Target weekend travelers or specific events. Offer slightly more flexible terms than peak season.
- Regularly analyze your own performance against these Tuckerton seasonality benchmarks and adjust your pricing and availability strategy accordingly.
Best Areas for Airbnb Investment in Tuckerton (2025)
Exploring the top neighborhoods for short-term rentals in Tuckerton? This section highlights key areas, outlining why they are attractive for hosts and guests, along with notable local attractions. Consider these locations based on your target guest profile and investment strategy.
| Neighborhood / Area | Why Host Here? (Target Guests & Appeal) | Key Attractions & Landmarks |
|---|---|---|
| Tuckerton Beach | A serene beach area that offers a peaceful retreat from the hustle and bustle of life. Ideal for families and vacationers looking to enjoy water activities and beautiful sunsets. | Tuckerton Seaport, Little Egg Harbor, Great Bay, Local restaurants, Kayaking and boating |
| Forked River | A quaint town just north of Tuckerton, known for its proximity to the Pine Barrens and the Barnegat Bay. Attracts nature lovers and outdoor enthusiasts. | Barnegat Bay, Pine Barrens, Local hiking trails, Fishing spots, Forked River State Marina |
| Little Egg Harbor Township | A suburban area offering a mix of residential comfort and proximity to attractions both in Tuckerton and beyond. Great for families visiting the shore. | Edwin B. Forsythe National Wildlife Refuge, Local parks, Beaches, Boating on Tuckerton Creek, Shopping options |
| Long Beach Island | Famous for its beautiful beaches and vacation resorts, just a short drive from Tuckerton. Highly sought after for beachgoers and summer tourism. | Beach Haven, Fantasy Island Amusement Park, Barnegat Lighthouse, Dining options, Water sports |
| Cape May | A historic resort town known for its Victorian houses and beautiful beaches. Attracts tourists looking for a charming and relaxing getaway. | Cape May Point State Park, Washington Street Mall, Cape May Lighthouse, Victorian architecture, Beaches |
| Ocean County Park | A large public park that offers various outdoor activities such as hiking, fishing, and sports. Popular among locals and visitors looking for relaxation. | Walking trails, Fishing ponds, Playgrounds, Sports facilities, Picnic areas |
| Manahawkin | A growing community close to the Jersey Shore, providing convenience for visitors while being a short drive to the beach. Family-friendly atmosphere. | Manahawkin Lake Park, Local shops, Dining options, Museums, Proximity to Long Beach Island |
| Seaside Heights | A vibrant beach town known for its boardwalk and amusement rides, ideal for younger crowds and families seeking fun during the summer months. | Seaside Heights Boardwalk, Amusement parks, Beaches, Water sports, Restaurants and nightlife |
Understanding Airbnb License Requirements & STR Laws in Tuckerton (2025)
While Tuckerton, New Jersey, United States currently shows low STR regulations, specific Airbnb license requirements might still exist or change. Always verify the latest short term rental regulations and Airbnb license requirements directly with local government authorities for Tuckerton to ensure full compliance before hosting.
(Source: AirROI data, 2025, finding no licensed listings among those analyzed)
Top Performing Airbnb Properties in Tuckerton (2025)
Benchmark your potential! Explore examples of top-performing Airbnb properties in Tuckertonbased on Trailing Twelve Month (TTM) revenue. Analyze their characteristics, revenue, occupancy rate, and ADR to understand what drives success in this market.
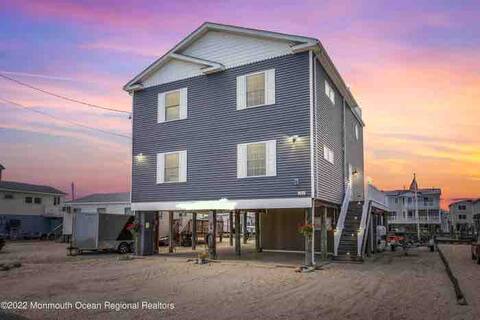
The Salty Dog - Brand New Listing
Entire Place • 3 bedrooms
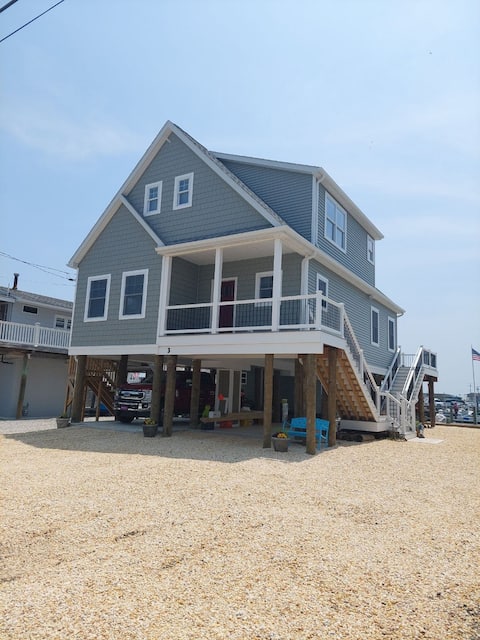
Down by the Bay
Entire Place • 4 bedrooms
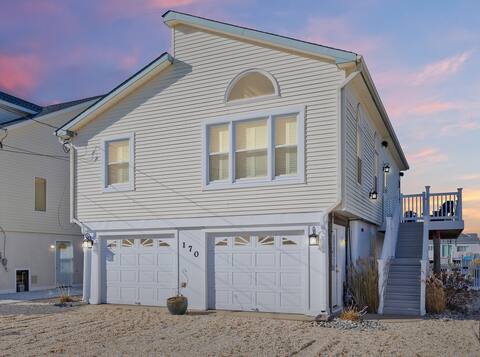
Tuckerton Bay Paradise
Entire Place • 3 bedrooms
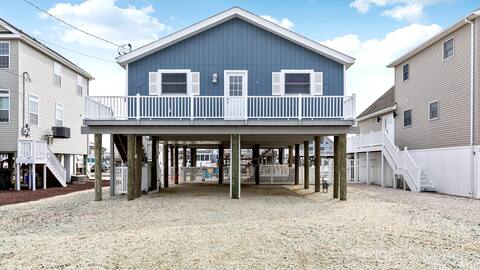
Our Tuckerton Bay Oasis
Entire Place • 3 bedrooms

Beautiful New Bay & Lagoon Front Home
Entire Place • 3 bedrooms

Bayfront Dream!
Entire Place • 3 bedrooms
Note: Performance varies based on location, size, amenities, seasonality, and management quality. Data reflects the past 12 months.
Top Performing Airbnb Hosts in Tuckerton (2025)
Learn from the best! This table showcases top-performing Airbnb hosts in Tuckerton based on the number of properties managed and estimated total revenue over the past year. Analyze their scale and performance metrics.
| Host Name | Properties | Grossing Revenue | Stay Reviews | Avg Rating |
|---|---|---|---|---|
| Jay | 3 | $128,452 | 73 | 4.98/5.0 |
| Ken | 1 | $67,672 | 5 | 5.00/5.0 |
| Lynn | 1 | $59,339 | 9 | 5.00/5.0 |
| Gretchen | 1 | $39,275 | 7 | 5.00/5.0 |
| Bethany | 1 | $37,235 | 31 | 5.00/5.0 |
| Billy | 1 | $37,219 | 3 | 5.00/5.0 |
| Salvatore & Jennifer | 1 | $35,807 | 35 | 5.00/5.0 |
| Amy | 1 | $27,090 | 121 | 4.90/5.0 |
| Kathy | 1 | $23,868 | 46 | 4.65/5.0 |
| Chris | 1 | $23,260 | 11 | 4.82/5.0 |
Analyzing the strategies of top hosts, such as their property selection, pricing, and guest communication, can offer valuable lessons for optimizing your own Airbnb operations in Tuckerton.
Dive Deeper: Advanced Tuckerton STR Market Data (2025)
Ready to unlock more insights? AirROI provides access to advanced metrics and comprehensive Airbnb data for Tuckerton. Explore detailed analytics beyond this report to refine your investment strategy, optimize pricing, and maximize your vacation rental profits.
Explore Advanced MetricsTuckerton Short-Term Rental Market Composition (2025): Property & Room Types
Room Type Distribution
Property Type Distribution
Market Composition Insights for Tuckerton
- The Tuckerton Airbnb market composition is heavily skewed towards Entire Home/Apt listings, which make up 100% of the 17 active rentals. This indicates strong guest preference for privacy and space.
- Looking at the property type distribution in Tuckerton, House properties are the most common (100%), reflecting the local real estate landscape.
- Houses represent a significant 100% portion, catering likely to families or larger groups.
Tuckerton Airbnb Room Capacity Analysis (2025): Bedroom Distribution
Distribution of Listings by Number of Bedrooms
Room Capacity Insights for Tuckerton
- The dominant room capacity in Tuckerton is 3 bedrooms listings, making up 64.7% of the market. This suggests a strong demand for properties suitable for families or small groups.
- Together, 3 bedrooms and 2 bedrooms properties represent 88.2% of the active Airbnb listings in Tuckerton, indicating a high concentration in these sizes.
- A significant 76.5% of listings offer 3+ bedrooms, catering to larger groups and families seeking more space in Tuckerton.
Tuckerton Vacation Rental Guest Capacity Trends (2025)
Distribution of Listings by Guest Capacity
Guest Capacity Insights for Tuckerton
- The most common guest capacity trend in Tuckerton vacation rentals is listings accommodating 8+ guests (58.8%). This suggests the primary traveler segment is likely larger groups.
- Properties designed for 8+ guests and 5 guests dominate the Tuckerton STR market, accounting for 82.3% of listings.
- 70.6% of properties accommodate 6+ guests, serving the market segment for larger families or group travel in Tuckerton.
- On average, properties in Tuckerton are equipped to host 6.8 guests.
Tuckerton Airbnb Booking Patterns (2025): Available vs. Booked Days
Available Days Distribution
Booked Days Distribution
Booking Pattern Insights for Tuckerton
- The most common availability pattern in Tuckerton falls within the 271-366 days range, representing 58.8% of listings. This suggests many properties have significant open periods on their calendars.
- Approximately 100.0% of listings show high availability (181+ days open annually), indicating potential for increased bookings or specific owner usage patterns.
- For booked days, the 91-180 days range is most frequent in Tuckerton (47.1%), reflecting common guest stay durations or potential owner blocking patterns.
Tuckerton Airbnb Minimum Stay Requirements Analysis
Distribution of Listings by Minimum Night Requirement
1 Night
2 listings
12.5% of total
2 Nights
7 listings
43.8% of total
3 Nights
2 listings
12.5% of total
4-6 Nights
4 listings
25% of total
7-29 Nights
1 listings
6.3% of total
Key Insights
- The most prevalent minimum stay requirement in Tuckerton is 2 Nights, adopted by 43.8% of listings. This highlights the market's preference for shorter, flexible bookings.
Recommendations
- Align with the market by considering a 2 Nights minimum stay, as 43.8% of Tuckerton hosts use this setting.
- If feasible, allowing 1-night stays, especially midweek or during low season, could capture last-minute bookings, as only 12.5% currently do.
- A 2-night minimum appears standard (43.8%). Consider this for weekends or peak periods.
- Adjust minimum nights based on seasonality – potentially shorter during low season and longer during peak demand periods in Tuckerton.
Tuckerton Airbnb Cancellation Policy Trends Analysis (2025)
Super Strict 30 Days
1 listings
6.3% of total
Flexible
1 listings
6.3% of total
Moderate
5 listings
31.3% of total
Firm
4 listings
25% of total
Strict
5 listings
31.3% of total
Cancellation Policy Insights for Tuckerton
- The prevailing Airbnb cancellation policy trend in Tuckerton is Moderate, used by 31.3% of listings.
- A majority (56.3%) of hosts in Tuckerton utilize Firm or Strict policies, indicating a market where hosts prioritize booking security.
Recommendations for Hosts
- Consider adopting a Moderate policy to align with the 31.3% market standard in Tuckerton.
- With 31.3% using Strict terms, this is a viable option in Tuckerton, particularly for high-value properties or during peak demand periods.
- Regularly review your cancellation policy against competitors and market demand shifts in Tuckerton.
Tuckerton STR Booking Lead Time Analysis (2025)
Average Booking Lead Time by Month
Booking Lead Time Insights for Tuckerton
- The overall average booking lead time for vacation rentals in Tuckerton is 76 days.
- Guests book furthest in advance for stays during December (average 228 days), likely coinciding with peak travel demand or local events.
- The shortest booking windows occur for stays in March (average 0 days), indicating more last-minute travel plans during this time.
- Seasonally, Summer (109 days avg.) sees the longest lead times, while Spring (27 days avg.) has the shortest, reflecting typical travel planning cycles.
Recommendations for Hosts
- Use the overall average lead time (76 days) as a baseline for your pricing and availability strategy in Tuckerton.
- For December stays, consider implementing length-of-stay discounts or slightly higher rates for bookings made less than 228 days out to capitalize on advance planning.
- During March, focus on last-minute booking availability and promotions, as guests book with very short notice (0 days avg.).
- Target marketing efforts for the Summer season well in advance (at least 109 days) to capture early planners.
- Monitor your own booking lead times against these Tuckerton averages to identify opportunities for dynamic pricing adjustments.
Popular & Essential Airbnb Amenities in Tuckerton (2025)
Amenity Prevalence
No amenities with partial availability (less than 100%) were found to display in the chart. All essential amenities might be present in all listings. Check insights below.
Amenity Insights for Tuckerton
- Essential amenities in Tuckerton that guests expect include: TV, Fire extinguisher, Hot water, Washer, Heating, Cooking basics, Air conditioning, BBQ grill, Free parking on premises, Dishes and silverware. Lacking these (any) could significantly impact bookings.
Recommendations for Hosts
- Ensure your listing includes all essential amenities for Tuckerton: TV, Fire extinguisher, Hot water, Washer, Heating, Cooking basics, Air conditioning, BBQ grill, Free parking on premises, Dishes and silverware.
- Highlight unique or less common amenities you offer (e.g., hot tub, dedicated workspace, EV charger) in your listing description and photos.
- Regularly check competitor amenities in Tuckerton to stay competitive.
Tuckerton Airbnb Guest Demographics & Profile Analysis (2025)
Guest Profile Summary for Tuckerton
- The typical guest profile for Airbnb in Tuckerton consists of primarily domestic travelers (98%), often arriving from nearby New York, typically belonging to the Post-2000s (Gen Z/Alpha) group (50%), primarily speaking English or Spanish.
- Domestic travelers account for 98.1% of guests.
- Key international markets include United States (98.1%) and Switzerland (1.9%).
- Top languages spoken are English (75%) followed by Spanish (10%).
- A significant demographic segment is the Post-2000s (Gen Z/Alpha) group, representing 50% of guests.
Recommendations for Hosts
- Target domestic marketing efforts towards travelers from New York and Albrightsville.
- Tailor amenities and listing descriptions to appeal to the dominant Post-2000s (Gen Z/Alpha) demographic (e.g., highlight fast WiFi, smart home features, local guides).
- Highlight unique local experiences or amenities relevant to the primary guest profile.
- Consider seasonal promotions aligned with peak travel times for key origin markets.
Nearby Short-Term Rental Market Comparison
How does the Tuckerton Airbnb market stack up against its neighbors? Compare key performance metrics like average monthly revenue, ADR, and occupancy rates in surrounding areas to understand the broader regional STR landscape.
| Market | Active Properties | Monthly Revenue | Daily Rate | Avg. Occupancy |
|---|---|---|---|---|
| Spring Lake Heights | 16 | $6,192 | $690.88 | 49% |
| Stone Harbor | 34 | $5,711 | $639.17 | 45% |
| Harvey Cedars | 23 | $5,311 | $775.06 | 40% |
| Middletown Township | 10 | $5,208 | $392.83 | 53% |
| Cape May Point | 25 | $5,145 | $509.59 | 48% |
| Avalon | 75 | $5,056 | $661.69 | 39% |
| Cape May | 289 | $5,017 | $519.04 | 42% |
| Surf City | 46 | $5,004 | $597.58 | 42% |
| Beach Haven | 83 | $4,856 | $534.63 | 46% |
| City of Glen Cove | 12 | $4,845 | $323.39 | 56% |