Bound Brook Airbnb Market Analysis 2025: Short Term Rental Data & Vacation Rental Statistics in New Jersey, United States
Is Airbnb profitable in Bound Brook in 2025? Explore comprehensive Airbnb analytics for Bound Brook, New Jersey, United States to uncover income potential. This 2025 STR market report for Bound Brook, based on AirROI data from April 2024 to March 2025, reveals key trends in the niche market of 18 active listings.
Whether you're considering an Airbnb investment in Bound Brook, optimizing your existing vacation rental, or exploring rental arbitrage opportunities, understanding the Bound Brook Airbnb data is crucial. Leveraging the low regulation environment is key to maximizing your short term rental income potential. Let's dive into the specifics.
Key Bound Brook Airbnb Performance Metrics Overview
Monthly Airbnb Revenue Variations & Income Potential in Bound Brook (2025)
Understanding the monthly revenue variations for Airbnb listings in Bound Brook is key to maximizing your short term rental income potential. Seasonality significantly impacts earnings. Our analysis, based on data from the past 12 months, shows that the peak revenue month for STRs in Bound Brook is typically August, while January often presents the lowest earnings, highlighting opportunities for strategic pricing adjustments during shoulder and low seasons. Explore the typical Airbnb income in Bound Brook across different performance tiers:
- Best-in-class properties (Top 10%) achieve $4,166+ monthly, often utilizing dynamic pricing and superior guest experiences.
- Strong performing properties (Top 25%) earn $3,491 or more, indicating effective management and desirable locations/amenities.
- Typical properties (Median) generate around $2,416 per month, representing the average market performance.
- Entry-level properties (Bottom 25%) see earnings around $1,565, often with potential for optimization.
Average Monthly Airbnb Earnings Trend in Bound Brook
Bound Brook Airbnb Occupancy Rate Trends (2025)
Maximize your bookings by understanding the Bound Brook STR occupancy trends. Seasonal demand shifts significantly influence how often properties are booked. Typically, Februarysees the highest demand (peak season occupancy), while January experiences the lowest (low season). Effective strategies, like adjusting minimum stays or offering promotions, can boost occupancy during slower periods. Here's how different property tiers perform in Bound Brook:
- Best-in-class properties (Top 10%) achieve 85%+ occupancy, indicating high desirability and potentially optimized availability.
- Strong performing properties (Top 25%) maintain 72% or higher occupancy, suggesting good market fit and guest satisfaction.
- Typical properties (Median) have an occupancy rate around 51%.
- Entry-level properties (Bottom 25%) average 28% occupancy, potentially facing higher vacancy.
Average Monthly Occupancy Rate Trend in Bound Brook
Average Daily Rate (ADR) Airbnb Trends in Bound Brook (2025)
Effective short term rental pricing strategy in Bound Brook involves understanding monthly ADR fluctuations. The Average Daily Rate (ADR) for Airbnb in Bound Brook typically peaks in November and dips lowest during February. Leveraging Airbnb dynamic pricing tools or strategies based on this seasonality can significantly boost revenue. Here's a look at the typical nightly rates achieved:
- Best-in-class properties (Top 10%) command rates of $179+ per night, often due to premium features or locations.
- Strong performing properties (Top 25%) achieve nightly rates of $161 or more.
- Typical properties (Median) charge around $141 per night.
- Entry-level properties (Bottom 25%) earn around $124 per night.
Average Daily Rate (ADR) Trend by Month in Bound Brook
Get Live Bound Brook Market Intelligence 👇

Explore Real-time Analytics
Airbnb Seasonality Analysis & Trends in Bound Brook (2025)
Peak Season (August, July, June)
- Revenue averages $3,503 per month
- Occupancy rates average 59.9%
- Daily rates average $154
Shoulder Season
- Revenue averages $2,555 per month
- Occupancy maintains around 53.6%
- Daily rates hold near $152
Low Season (January, March, September)
- Revenue drops to average $1,694 per month
- Occupancy decreases to average 39.6%
- Daily rates adjust to average $146
Seasonality Insights for Bound Brook
- The Airbnb seasonality in Bound Brook shows highly seasonal trends requiring careful strategy. While the sections above show seasonal averages, it's also insightful to look at the extremes:
- During the high season, the absolute peak month showcases Bound Brook's highest earning potential, with monthly revenues capable of climbing to $3,688, occupancy reaching a high of 69.9%, and ADRs peaking at $158.
- Conversely, the slowest single month of the year, typically falling within the low season, marks the market's lowest point. In this month, revenue might dip to $1,271, occupancy could drop to 31.6%, and ADRs may adjust down to $140.
- Understanding both the seasonal averages and these monthly peaks and troughs in revenue, occupancy, and ADR is crucial for maximizing your Airbnb profit potential in Bound Brook.
Seasonal Strategies for Maximizing Profit
- Peak Season: Maximize revenue through premium pricing and potentially longer minimum stays. Ensure high availability.
- Low Season: Offer competitive pricing, special promotions (e.g., extended stay discounts), and flexible cancellation policies. Target off-season travelers like remote workers or budget-conscious guests.
- Shoulder Seasons: Implement dynamic pricing that balances peak and low rates. Target weekend travelers or specific events. Offer slightly more flexible terms than peak season.
- Regularly analyze your own performance against these Bound Brook seasonality benchmarks and adjust your pricing and availability strategy accordingly.
Best Areas for Airbnb Investment in Bound Brook (2025)
Exploring the top neighborhoods for short-term rentals in Bound Brook? This section highlights key areas, outlining why they are attractive for hosts and guests, along with notable local attractions. Consider these locations based on your target guest profile and investment strategy.
| Neighborhood / Area | Why Host Here? (Target Guests & Appeal) | Key Attractions & Landmarks |
|---|---|---|
| Downtown Bound Brook | The heart of Bound Brook, featuring a rich history and a range of dining and shopping options. A great spot for visitors looking to explore local culture. | Bound Brook Train Station, Harris Park, Historic Downtown, Local Restaurants, Bound Brook Historical Society |
| Green Brook Park | This area offers beautiful green spaces and is ideal for families and nature enthusiasts. It attracts visitors looking for outdoor activities and relaxation. | Green Brook Park, Playgrounds, Walking Trails, Picnic Areas, Sports Facilities |
| Bridgewater Commons | Close to shopping and dining, this area appeals to visitors interested in retail therapy and convenience, with easy access to the highway and surrounding attractions. | Bridgewater Commons Mall, Restaurants, Cinemas, Retail Stores, Parks nearby |
| Raritan | Just a few miles from Bound Brook, Raritan provides a charming small-town feel with easy access to larger city amenities, making it ideal for travelers. | Raritan Train Station, Local Dining, Parks, Raritan River, Community Events |
| Manville | Nearby Manville, rich in local history and parks, attracts families and visitors looking for a quiet retreat while still being close to Bound Brook. | Manville Community Center, Local Parks, Historic Sites, Restaurants, Nearby Shopping |
| Somerville | A vibrant town with a lively downtown area, perfect for tourists looking for shopping, dining, and entertainment options just a short drive away. | Somerville Circle, Downtown Restaurants, Farmers Market, Theaters, Community Events |
| Watchung Hills | This area offers stunning views and hiking opportunities, perfect for those looking to enjoy nature while being close to urban conveniences. | Watchung Reservation, Hiking Trails, Nature Centers, Scenic Views, Parks |
| North Bound Brook | A residential area with a friendly atmosphere, ideal for families visiting or those who want to experience suburban life close to Bound Brook. | Local Dining Options, Parks, Community Activities, Family-friendly Events, Suburban Residential Charm |
Understanding Airbnb License Requirements & STR Laws in Bound Brook (2025)
While Bound Brook, New Jersey, United States currently shows low STR regulations, specific Airbnb license requirements might still exist or change. Always verify the latest short term rental regulations and Airbnb license requirements directly with local government authorities for Bound Brook to ensure full compliance before hosting.
(Source: AirROI data, 2025, finding no licensed listings among those analyzed)
Top Performing Airbnb Properties in Bound Brook (2025)
Benchmark your potential! Explore examples of top-performing Airbnb properties in Bound Brookbased on Trailing Twelve Month (TTM) revenue. Analyze their characteristics, revenue, occupancy rate, and ADR to understand what drives success in this market.
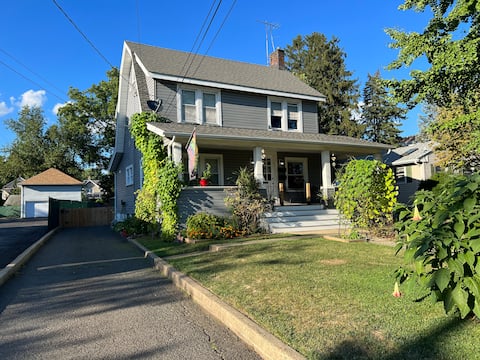
Historic house, modern amenities
Entire Place • 1 bedroom
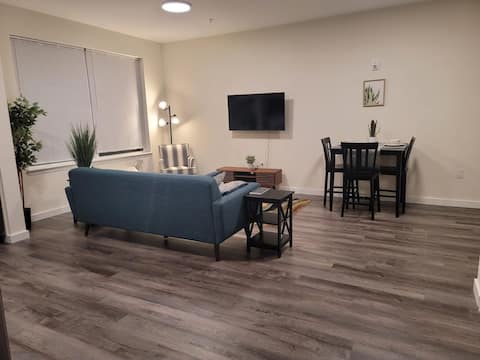
COZY*1BD*APT in the heart Historic Bound Brook NJ
Entire Place • 1 bedroom
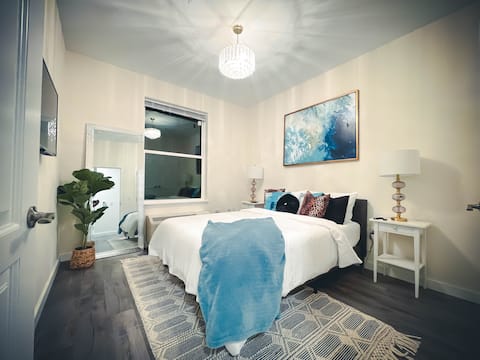
Insta worthy 2 bdrm w/free parking (non-smoking)
Entire Place • 2 bedrooms

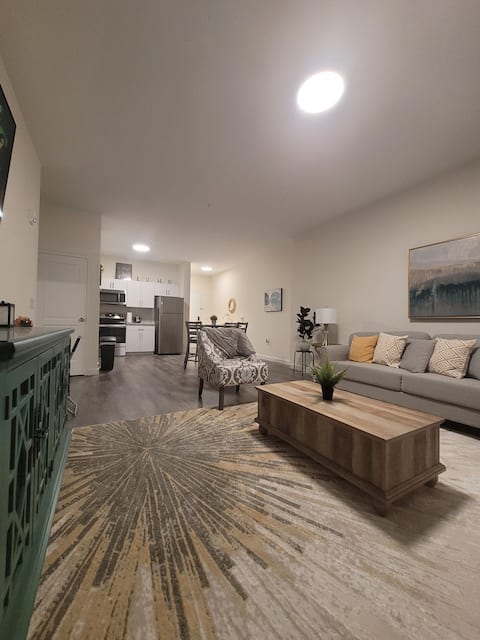
Modern & Comfortable Apt | Gym | Free Parking
Entire Place • 1 bedroom
Jack&Jill |2Bd |2Bath |Pkng|Gym
Entire Place • 2 bedrooms

2bd1ba in historic BoundBrook (non-smoking)parking
Entire Place • 2 bedrooms
Note: Performance varies based on location, size, amenities, seasonality, and management quality. Data reflects the past 12 months.
Top Performing Airbnb Hosts in Bound Brook (2025)
Learn from the best! This table showcases top-performing Airbnb hosts in Bound Brook based on the number of properties managed and estimated total revenue over the past year. Analyze their scale and performance metrics.
| Host Name | Properties | Grossing Revenue | Stay Reviews | Avg Rating |
|---|---|---|---|---|
| Perose | 4 | $68,859 | 61 | 4.61/5.0 |
| Kb | 3 | $60,886 | 66 | 4.83/5.0 |
| Czj | 2 | $54,229 | 29 | 4.79/5.0 |
| Kenneth | 4 | $45,198 | 34 | 4.81/5.0 |
| Richard | 2 | $36,379 | 69 | 4.76/5.0 |
| Corey | 1 | $31,699 | 25 | 5.00/5.0 |
| CJJ Property | 1 | $30,456 | 78 | 4.81/5.0 |
| Host #432912974 | 1 | $23,562 | 79 | 4.77/5.0 |
Analyzing the strategies of top hosts, such as their property selection, pricing, and guest communication, can offer valuable lessons for optimizing your own Airbnb operations in Bound Brook.
Dive Deeper: Advanced Bound Brook STR Market Data (2025)
Ready to unlock more insights? AirROI provides access to advanced metrics and comprehensive Airbnb data for Bound Brook. Explore detailed analytics beyond this report to refine your investment strategy, optimize pricing, and maximize your vacation rental profits.
Explore Advanced MetricsBound Brook Short-Term Rental Market Composition (2025): Property & Room Types
Room Type Distribution
Property Type Distribution
Market Composition Insights for Bound Brook
- The Bound Brook Airbnb market composition is heavily skewed towards Entire Home/Apt listings, which make up 100% of the 18 active rentals. This indicates strong guest preference for privacy and space.
- Looking at the property type distribution in Bound Brook, Apartment/Condo properties are the most common (100%), reflecting the local real estate landscape.
Bound Brook Airbnb Room Capacity Analysis (2025): Bedroom Distribution
Distribution of Listings by Number of Bedrooms
Room Capacity Insights for Bound Brook
- The dominant room capacity in Bound Brook is 1 bedroom listings, making up 72.2% of the market. This suggests a strong demand for properties suitable for couples or solo travelers.
- Together, 1 bedroom and 2 bedrooms properties represent 100.0% of the active Airbnb listings in Bound Brook, indicating a high concentration in these sizes.
- With over half the market (72.2%) consisting of studios or 1-bedroom units, Bound Brook is particularly well-suited for individuals or couples.
Bound Brook Vacation Rental Guest Capacity Trends (2025)
Distribution of Listings by Guest Capacity
Guest Capacity Insights for Bound Brook
- The most common guest capacity trend in Bound Brook vacation rentals is listings accommodating 4 guests (61.1%). This suggests the primary traveler segment is likely small families or groups.
- Properties designed for 4 guests and 3 guests dominate the Bound Brook STR market, accounting for 77.8% of listings.
- On average, properties in Bound Brook are equipped to host 4.1 guests.
Bound Brook Airbnb Booking Patterns (2025): Available vs. Booked Days
Available Days Distribution
Booked Days Distribution
Booking Pattern Insights for Bound Brook
- The most common availability pattern in Bound Brook falls within the 181-270 days range, representing 50% of listings. This suggests many properties have significant open periods on their calendars.
- Approximately 77.8% of listings show high availability (181+ days open annually), indicating potential for increased bookings or specific owner usage patterns.
- For booked days, the 91-180 days range is most frequent in Bound Brook (50%), reflecting common guest stay durations or potential owner blocking patterns.
- A notable 22.3% of properties secure long booking periods (181+ days booked per year), highlighting successful long-term rental strategies or significant owner usage.
Bound Brook Airbnb Minimum Stay Requirements Analysis
Distribution of Listings by Minimum Night Requirement
1 Night
2 listings
11.1% of total
2 Nights
14 listings
77.8% of total
3 Nights
1 listings
5.6% of total
30+ Nights
1 listings
5.6% of total
Key Insights
- The most prevalent minimum stay requirement in Bound Brook is 2 Nights, adopted by 77.8% of listings. This highlights the market's preference for shorter, flexible bookings.
- A strong majority (88.9%) of the Bound Brook Airbnb data shows acceptance of very short stays (1-2 nights), indicating a dynamic, high-turnover market.
Recommendations
- Align with the market by considering a 2 Nights minimum stay, as 77.8% of Bound Brook hosts use this setting.
- If feasible, allowing 1-night stays, especially midweek or during low season, could capture last-minute bookings, as only 11.1% currently do.
- A 2-night minimum appears standard (77.8%). Consider this for weekends or peak periods.
- Explore offering discounts for stays of 30+ nights to attract the 5.6% of the market seeking extended stays.
- Adjust minimum nights based on seasonality – potentially shorter during low season and longer during peak demand periods in Bound Brook.
Bound Brook Airbnb Cancellation Policy Trends Analysis (2025)
Flexible
2 listings
11.1% of total
Moderate
8 listings
44.4% of total
Firm
6 listings
33.3% of total
Strict
2 listings
11.1% of total
Cancellation Policy Insights for Bound Brook
- The prevailing Airbnb cancellation policy trend in Bound Brook is Moderate, used by 44.4% of listings.
- There's a relatively balanced mix between guest-friendly (55.5%) and stricter (44.4%) policies, offering choices for different guest needs.
Recommendations for Hosts
- Consider adopting a Moderate policy to align with the 44.4% market standard in Bound Brook.
- Using a Strict policy might deter some guests, as only 11.1% of listings use it. Evaluate if potential revenue protection outweighs possible lower booking rates.
- Regularly review your cancellation policy against competitors and market demand shifts in Bound Brook.
Bound Brook STR Booking Lead Time Analysis (2025)
Average Booking Lead Time by Month
Booking Lead Time Insights for Bound Brook
- The overall average booking lead time for vacation rentals in Bound Brook is 33 days.
- Guests book furthest in advance for stays during June (average 59 days), likely coinciding with peak travel demand or local events.
- The shortest booking windows occur for stays in March (average 16 days), indicating more last-minute travel plans during this time.
- Seasonally, Summer (49 days avg.) sees the longest lead times, while Winter (31 days avg.) has the shortest, reflecting typical travel planning cycles.
Recommendations for Hosts
- Use the overall average lead time (33 days) as a baseline for your pricing and availability strategy in Bound Brook.
- For June stays, consider implementing length-of-stay discounts or slightly higher rates for bookings made less than 59 days out to capitalize on advance planning.
- Target marketing efforts for the Summer season well in advance (at least 49 days) to capture early planners.
- Monitor your own booking lead times against these Bound Brook averages to identify opportunities for dynamic pricing adjustments.
Popular & Essential Airbnb Amenities in Bound Brook (2025)
Amenity Prevalence
Amenity Insights for Bound Brook
- Essential amenities in Bound Brook that guests expect include: Wifi, Kitchen, TV, Air conditioning, Smoke alarm, Carbon monoxide alarm. Lacking these (any) could significantly impact bookings.
- Popular amenities like Dishes and silverware, Microwave, Iron are common but not universal. Offering these can provide a competitive edge.
Recommendations for Hosts
- Ensure your listing includes all essential amenities for Bound Brook: Wifi, Kitchen, TV, Air conditioning, Smoke alarm, Carbon monoxide alarm.
- Consider adding popular differentiators like Dishes and silverware or Microwave to increase appeal.
- Highlight unique or less common amenities you offer (e.g., hot tub, dedicated workspace, EV charger) in your listing description and photos.
- Regularly check competitor amenities in Bound Brook to stay competitive.
Bound Brook Airbnb Guest Demographics & Profile Analysis (2025)
Guest Profile Summary for Bound Brook
- The typical guest profile for Airbnb in Bound Brook consists of primarily domestic travelers (89%), often arriving from nearby New York, typically belonging to the Post-2000s (Gen Z/Alpha) group (50%), primarily speaking English or Spanish.
- Domestic travelers account for 88.6% of guests.
- Key international markets include United States (88.6%) and Canada (4.5%).
- Top languages spoken are English (67.6%) followed by Spanish (13.5%).
- A significant demographic segment is the Post-2000s (Gen Z/Alpha) group, representing 50% of guests.
Recommendations for Hosts
- Target domestic marketing efforts towards travelers from New York and Miami.
- Tailor amenities and listing descriptions to appeal to the dominant Post-2000s (Gen Z/Alpha) demographic (e.g., highlight fast WiFi, smart home features, local guides).
- Highlight unique local experiences or amenities relevant to the primary guest profile.
- Consider seasonal promotions aligned with peak travel times for key origin markets.
Nearby Short-Term Rental Market Comparison
How does the Bound Brook Airbnb market stack up against its neighbors? Compare key performance metrics like average monthly revenue, ADR, and occupancy rates in surrounding areas to understand the broader regional STR landscape.
| Market | Active Properties | Monthly Revenue | Daily Rate | Avg. Occupancy |
|---|---|---|---|---|
| Berlin Township | 15 | $9,384 | $663.27 | 35% |
| Frankford Township | 10 | $6,656 | $501.80 | 45% |
| Penn Estates | 58 | $6,479 | $386.94 | 50% |
| Spring Lake Heights | 16 | $6,192 | $690.88 | 49% |
| Town of Kingston | 13 | $6,045 | $436.18 | 49% |
| Town of Pawling | 16 | $5,956 | $392.41 | 56% |
| Brookfield | 13 | $5,891 | $486.63 | 51% |
| Town/Village of Harrison | 10 | $5,764 | $590.20 | 48% |
| Stroud Township | 122 | $5,734 | $420.52 | 44% |
| Stone Harbor | 34 | $5,711 | $639.17 | 45% |