Walpole Airbnb Market Analysis 2025: Short Term Rental Data & Vacation Rental Statistics in New Hampshire, United States
Is Airbnb profitable in Walpole in 2025? Explore comprehensive Airbnb analytics for Walpole, New Hampshire, United States to uncover income potential. This 2025 STR market report for Walpole, based on AirROI data from June 2024 to May 2025, reveals key trends in the niche market of 19 active listings.
Whether you're considering an Airbnb investment in Walpole, optimizing your existing vacation rental, or exploring rental arbitrage opportunities, understanding the Walpole Airbnb data is crucial. Leveraging the low regulation environment is key to maximizing your short term rental income potential. Let's dive into the specifics.
Key Walpole Airbnb Performance Metrics Overview
Monthly Airbnb Revenue Variations & Income Potential in Walpole (2025)
Understanding the monthly revenue variations for Airbnb listings in Walpole is key to maximizing your short term rental income potential. Seasonality significantly impacts earnings. Our analysis, based on data from the past 12 months, shows that the peak revenue month for STRs in Walpole is typically January, while April often presents the lowest earnings, highlighting opportunities for strategic pricing adjustments during shoulder and low seasons. Explore the typical Airbnb income in Walpole across different performance tiers:
- Best-in-class properties (Top 10%) achieve $4,988+ monthly, often utilizing dynamic pricing and superior guest experiences.
- Strong performing properties (Top 25%) earn $3,567 or more, indicating effective management and desirable locations/amenities.
- Typical properties (Median) generate around $2,262 per month, representing the average market performance.
- Entry-level properties (Bottom 25%) see earnings around $1,297, often with potential for optimization.
Average Monthly Airbnb Earnings Trend in Walpole
Walpole Airbnb Occupancy Rate Trends (2025)
Maximize your bookings by understanding the Walpole STR occupancy trends. Seasonal demand shifts significantly influence how often properties are booked. Typically, Octobersees the highest demand (peak season occupancy), while May experiences the lowest (low season). Effective strategies, like adjusting minimum stays or offering promotions, can boost occupancy during slower periods. Here's how different property tiers perform in Walpole:
- Best-in-class properties (Top 10%) achieve 71%+ occupancy, indicating high desirability and potentially optimized availability.
- Strong performing properties (Top 25%) maintain 51% or higher occupancy, suggesting good market fit and guest satisfaction.
- Typical properties (Median) have an occupancy rate around 32%.
- Entry-level properties (Bottom 25%) average 18% occupancy, potentially facing higher vacancy.
Average Monthly Occupancy Rate Trend in Walpole
Average Daily Rate (ADR) Airbnb Trends in Walpole (2025)
Effective short term rental pricing strategy in Walpole involves understanding monthly ADR fluctuations. The Average Daily Rate (ADR) for Airbnb in Walpole typically peaks in January and dips lowest during November. Leveraging Airbnb dynamic pricing tools or strategies based on this seasonality can significantly boost revenue. Here's a look at the typical nightly rates achieved:
- Best-in-class properties (Top 10%) command rates of $379+ per night, often due to premium features or locations.
- Strong performing properties (Top 25%) achieve nightly rates of $325 or more.
- Typical properties (Median) charge around $180 per night.
- Entry-level properties (Bottom 25%) earn around $97 per night.
Average Daily Rate (ADR) Trend by Month in Walpole
Get Live Walpole Market Intelligence 👇

Explore Real-time Analytics
Airbnb Seasonality Analysis & Trends in Walpole (2025)
Peak Season (January, June, July)
- Revenue averages $3,628 per month
- Occupancy rates average 38.8%
- Daily rates average $208
Shoulder Season
- Revenue averages $2,546 per month
- Occupancy maintains around 38.4%
- Daily rates hold near $205
Low Season (March, April, November)
- Revenue drops to average $1,810 per month
- Occupancy decreases to average 30.4%
- Daily rates adjust to average $206
Seasonality Insights for Walpole
- The Airbnb seasonality in Walpole shows highly seasonal trends requiring careful strategy. While the sections above show seasonal averages, it's also insightful to look at the extremes:
- During the high season, the absolute peak month showcases Walpole's highest earning potential, with monthly revenues capable of climbing to $3,852, occupancy reaching a high of 50.2%, and ADRs peaking at $228.
- Conversely, the slowest single month of the year, typically falling within the low season, marks the market's lowest point. In this month, revenue might dip to $1,771, occupancy could drop to 26.8%, and ADRs may adjust down to $186.
- Understanding both the seasonal averages and these monthly peaks and troughs in revenue, occupancy, and ADR is crucial for maximizing your Airbnb profit potential in Walpole.
Seasonal Strategies for Maximizing Profit
- Peak Season: Maximize revenue through premium pricing and potentially longer minimum stays. Ensure high availability.
- Low Season: Offer competitive pricing, special promotions (e.g., extended stay discounts), and flexible cancellation policies. Target off-season travelers like remote workers or budget-conscious guests.
- Shoulder Seasons: Implement dynamic pricing that balances peak and low rates. Target weekend travelers or specific events. Offer slightly more flexible terms than peak season.
- Regularly analyze your own performance against these Walpole seasonality benchmarks and adjust your pricing and availability strategy accordingly.
Best Areas for Airbnb Investment in Walpole (2025)
Exploring the top neighborhoods for short-term rentals in Walpole? This section highlights key areas, outlining why they are attractive for hosts and guests, along with notable local attractions. Consider these locations based on your target guest profile and investment strategy.
| Neighborhood / Area | Why Host Here? (Target Guests & Appeal) | Key Attractions & Landmarks |
|---|---|---|
| Walpole Village | Walpole Village is the heart of Walpole, featuring charming historic buildings and quaint shops. It offers a picturesque New England experience and is appealing to travelers looking to explore local culture and arts. | Walpole Farmer's Market, Thompsonmead Creamery, Walpole Art & Craft Gallery, Connecticut River Museum |
| Chesterfield | Chesterfield is known for its beautiful natural landscapes, including lakes and mountains. It attracts nature lovers and outdoor enthusiasts looking to hike, ski, or fish in tranquil settings. | Hinsdale Pond, Chesterfield Gorge, Pisgah State Park, Northwest Ice Arena |
| Hinsdale | Hinsdale offers unique small-town charm and is close to outdoor activities. It's ideal for families and groups seeking a relaxing getaway in a quiet location with easy access to nature. | Hinsdale Lake, Moore's Pond, Hinsdale Historical Society, Mason Hill |
| North Walpole | A peaceful area that provides proximity to the Connecticut River and outdoor activities. Ideal for travelers seeking tranquility and natural attractions away from busy tourist spots. | Connecticut River, Riverbend Wildlife Area, Hillside Cemetery |
| Westminster | This nearby town offers beautiful views and a laid-back atmosphere, making it appealing for those looking to escape the hustle and bustle and enjoy peaceful retreats. | Westminster Village Historic District, Willard Pond, Westminster Crag |
| Keene | Located a short drive from Walpole, Keene features a vibrant downtown area with shopping, dining, and local events. It attracts visitors looking for urban amenities with small-town charm. | Cheshire Children's Museum, Keene Art Walk, Stonewall Farm, Thompson Reservoir |
| Brattleboro (VT) | Just across the border in Vermont, Brattleboro is a lively town known for its arts scene and host of festivals. It attracts those interested in culture, music, and cuisine. | Brattleboro Museum & Art Center, Harris Hill Ski Jump, Molly Stark Trail, Connecticut River |
| Fitzwilliam | Fitzwilliam offers an authentic rural New Hampshire experience with scenic views and historical sites. Ideal for those looking for peaceful retreats and local cultural experiences. | Mount Monadnock, Fitzwilliam Town Hall, Fitzwilliam Historical Society, Cheshire Rail Trail |
Understanding Airbnb License Requirements & STR Laws in Walpole (2025)
While Walpole, New Hampshire, United States currently shows low STR regulations, specific Airbnb license requirements might still exist or change. Always verify the latest short term rental regulations and Airbnb license requirements directly with local government authorities for Walpole to ensure full compliance before hosting.
(Source: AirROI data, 2025, finding no licensed listings among those analyzed)
Top Performing Airbnb Properties in Walpole (2025)
Benchmark your potential! Explore examples of top-performing Airbnb properties in Walpolebased on Trailing Twelve Month (TTM) revenue. Analyze their characteristics, revenue, occupancy rate, and ADR to understand what drives success in this market.
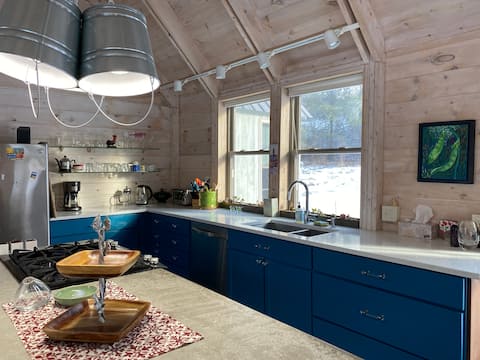
Cozy and Bright Guest Suite in Lovely NH Village
Entire Place • 2 bedrooms

Charming, Large House in Walpole NH /VT. Border
Entire Place • 4 bedrooms

Rochambeau Lodge
Entire Place • 8 bedrooms
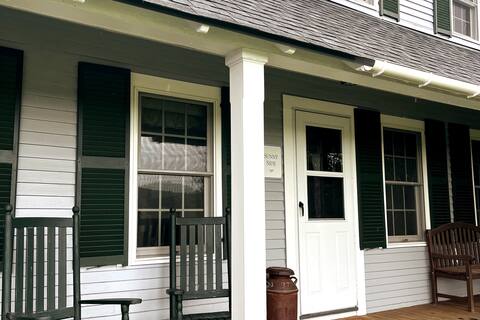
Sunnyside, Your Home Away From Home!
Entire Place • 3 bedrooms
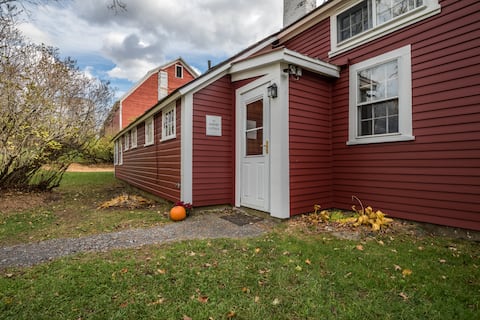
Explore NH & VT from Farm Cottage
Entire Place • 3 bedrooms
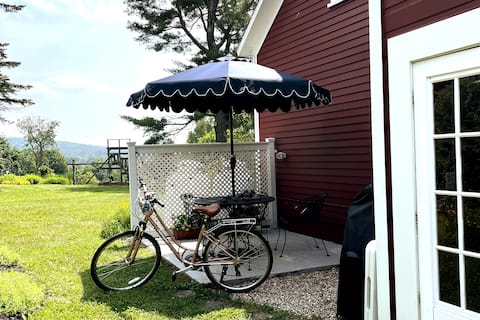
Farm Cottage with Stunning Views on NH/VT Border
Entire Place • 3 bedrooms
Note: Performance varies based on location, size, amenities, seasonality, and management quality. Data reflects the past 12 months.
Top Performing Airbnb Hosts in Walpole (2025)
Learn from the best! This table showcases top-performing Airbnb hosts in Walpole based on the number of properties managed and estimated total revenue over the past year. Analyze their scale and performance metrics.
| Host Name | Properties | Grossing Revenue | Stay Reviews | Avg Rating |
|---|---|---|---|---|
| Tessa | 3 | $103,918 | 69 | 4.85/5.0 |
| Taylor | 5 | $97,487 | 81 | 4.86/5.0 |
| Amy | 1 | $61,383 | 40 | 4.95/5.0 |
| Karen | 1 | $50,681 | 71 | 4.99/5.0 |
| Evolve | 1 | $26,232 | 6 | 4.00/5.0 |
| Ellen | 1 | $23,209 | 13 | 4.85/5.0 |
| Bev | 1 | $19,129 | 70 | 5.00/5.0 |
| Janis | 1 | $16,611 | 26 | 4.88/5.0 |
| Eryn | 1 | $15,849 | 80 | 4.90/5.0 |
| Sonia | 2 | $13,136 | 280 | 4.92/5.0 |
Analyzing the strategies of top hosts, such as their property selection, pricing, and guest communication, can offer valuable lessons for optimizing your own Airbnb operations in Walpole.
Dive Deeper: Advanced Walpole STR Market Data (2025)
Ready to unlock more insights? AirROI provides access to advanced metrics and comprehensive Airbnb data for Walpole. Explore detailed analytics beyond this report to refine your investment strategy, optimize pricing, and maximize your vacation rental profits.
Explore Advanced MetricsWalpole Short-Term Rental Market Composition (2025): Property & Room Types
Room Type Distribution
Property Type Distribution
Market Composition Insights for Walpole
- The Walpole Airbnb market composition is heavily skewed towards Entire Home/Apt listings, which make up 78.9% of the 19 active rentals. This indicates strong guest preference for privacy and space.
- Looking at the property type distribution in Walpole, House properties are the most common (63.2%), reflecting the local real estate landscape.
- Houses represent a significant 63.2% portion, catering likely to families or larger groups.
- The presence of 5.3% Hotel/Boutique listings indicates integration with traditional hospitality.
Walpole Airbnb Room Capacity Analysis (2025): Bedroom Distribution
Distribution of Listings by Number of Bedrooms
Room Capacity Insights for Walpole
- The dominant room capacity in Walpole is 1 bedroom listings, making up 26.3% of the market. This suggests a strong demand for properties suitable for couples or solo travelers.
- Together, 1 bedroom and 3 bedrooms properties represent 47.4% of the active Airbnb listings in Walpole, indicating a high concentration in these sizes.
- A significant 42.2% of listings offer 3+ bedrooms, catering to larger groups and families seeking more space in Walpole.
Walpole Vacation Rental Guest Capacity Trends (2025)
Distribution of Listings by Guest Capacity
Guest Capacity Insights for Walpole
- The most common guest capacity trend in Walpole vacation rentals is listings accommodating 6 guests (31.6%). This suggests the primary traveler segment is likely larger groups.
- Properties designed for 6 guests and 8+ guests dominate the Walpole STR market, accounting for 57.9% of listings.
- 57.9% of properties accommodate 6+ guests, serving the market segment for larger families or group travel in Walpole.
- On average, properties in Walpole are equipped to host 4.8 guests.
Walpole Airbnb Booking Patterns (2025): Available vs. Booked Days
Available Days Distribution
Booked Days Distribution
Booking Pattern Insights for Walpole
- The most common availability pattern in Walpole falls within the 271-366 days range, representing 52.6% of listings. This suggests many properties have significant open periods on their calendars.
- Approximately 89.4% of listings show high availability (181+ days open annually), indicating potential for increased bookings or specific owner usage patterns.
- For booked days, the 91-180 days range is most frequent in Walpole (47.4%), reflecting common guest stay durations or potential owner blocking patterns.
- A notable 10.6% of properties secure long booking periods (181+ days booked per year), highlighting successful long-term rental strategies or significant owner usage.
Walpole Airbnb Minimum Stay Requirements Analysis
Distribution of Listings by Minimum Night Requirement
1 Night
9 listings
52.9% of total
2 Nights
7 listings
41.2% of total
30+ Nights
1 listings
5.9% of total
Key Insights
- The most prevalent minimum stay requirement in Walpole is 1 Night, adopted by 52.9% of listings. This highlights the market's preference for shorter, flexible bookings.
- A strong majority (94.1%) of the Walpole Airbnb data shows acceptance of very short stays (1-2 nights), indicating a dynamic, high-turnover market.
Recommendations
- Align with the market by considering a 1 Night minimum stay, as 52.9% of Walpole hosts use this setting.
- Explore offering discounts for stays of 30+ nights to attract the 5.9% of the market seeking extended stays.
- Adjust minimum nights based on seasonality – potentially shorter during low season and longer during peak demand periods in Walpole.
Walpole Airbnb Cancellation Policy Trends Analysis (2025)
Super Strict 30 Days
3 listings
17.6% of total
Flexible
5 listings
29.4% of total
Moderate
3 listings
17.6% of total
Firm
5 listings
29.4% of total
Strict
1 listings
5.9% of total
Cancellation Policy Insights for Walpole
- The prevailing Airbnb cancellation policy trend in Walpole is Flexible, used by 29.4% of listings.
- There's a relatively balanced mix between guest-friendly (47.0%) and stricter (35.3%) policies, offering choices for different guest needs.
- Strict cancellation policies are quite rare (5.9%), potentially making listings with this policy less competitive unless justified by high demand or property type.
Recommendations for Hosts
- Consider adopting a Flexible policy to align with the 29.4% market standard in Walpole.
- Using a Strict policy might deter some guests, as only 5.9% of listings use it. Evaluate if potential revenue protection outweighs possible lower booking rates.
- Regularly review your cancellation policy against competitors and market demand shifts in Walpole.
Walpole STR Booking Lead Time Analysis (2025)
Average Booking Lead Time by Month
Booking Lead Time Insights for Walpole
- The overall average booking lead time for vacation rentals in Walpole is 59 days.
- Guests book furthest in advance for stays during October (average 89 days), likely coinciding with peak travel demand or local events.
- The shortest booking windows occur for stays in March (average 25 days), indicating more last-minute travel plans during this time.
- Seasonally, Fall (75 days avg.) sees the longest lead times, while Spring (39 days avg.) has the shortest, reflecting typical travel planning cycles.
Recommendations for Hosts
- Use the overall average lead time (59 days) as a baseline for your pricing and availability strategy in Walpole.
- For October stays, consider implementing length-of-stay discounts or slightly higher rates for bookings made less than 89 days out to capitalize on advance planning.
- Target marketing efforts for the Fall season well in advance (at least 75 days) to capture early planners.
- Monitor your own booking lead times against these Walpole averages to identify opportunities for dynamic pricing adjustments.
Popular & Essential Airbnb Amenities in Walpole (2025)
Amenity Prevalence
Amenity Insights for Walpole
- Essential amenities in Walpole that guests expect include: Bed linens, First aid kit, Coffee maker, Essentials, Free parking on premises. Lacking these (any) could significantly impact bookings.
- Popular amenities like Smoke alarm, Fire extinguisher, Carbon monoxide alarm are common but not universal. Offering these can provide a competitive edge.
Recommendations for Hosts
- Ensure your listing includes all essential amenities for Walpole: Bed linens, First aid kit, Coffee maker, Essentials, Free parking on premises.
- Consider adding popular differentiators like Smoke alarm or Fire extinguisher to increase appeal.
- Highlight unique or less common amenities you offer (e.g., hot tub, dedicated workspace, EV charger) in your listing description and photos.
- Regularly check competitor amenities in Walpole to stay competitive.
Walpole Airbnb Guest Demographics & Profile Analysis (2025)
Guest Profile Summary for Walpole
- The typical guest profile for Airbnb in Walpole consists of primarily domestic travelers (94%), often arriving from nearby New York, typically belonging to the Post-2000s (Gen Z/Alpha) group (50%), primarily speaking English or Spanish.
- Domestic travelers account for 94.2% of guests.
- Key international markets include United States (94.2%) and DC (4.1%).
- Top languages spoken are English (75.5%) followed by Spanish (12.2%).
- A significant demographic segment is the Post-2000s (Gen Z/Alpha) group, representing 50% of guests.
Recommendations for Hosts
- Target domestic marketing efforts towards travelers from New York and Boston.
- Tailor amenities and listing descriptions to appeal to the dominant Post-2000s (Gen Z/Alpha) demographic (e.g., highlight fast WiFi, smart home features, local guides).
- Highlight unique local experiences or amenities relevant to the primary guest profile.
- Consider seasonal promotions aligned with peak travel times for key origin markets.
Nearby Short-Term Rental Market Comparison
How does the Walpole Airbnb market stack up against its neighbors? Compare key performance metrics like average monthly revenue, ADR, and occupancy rates in surrounding areas to understand the broader regional STR landscape.
| Market | Active Properties | Monthly Revenue | Daily Rate | Avg. Occupancy |
|---|---|---|---|---|
| Middletown Springs | 11 | $8,107 | $545.86 | 35% |
| North Andover | 10 | $5,541 | $391.63 | 53% |
| Fort Ann | 31 | $5,146 | $823.12 | 35% |
| Pomfret | 15 | $5,068 | $501.23 | 44% |
| Topsham | 10 | $5,031 | $341.74 | 53% |
| Jefferson | 28 | $4,929 | $448.59 | 47% |
| Middleton | 10 | $4,801 | $326.54 | 53% |
| Town of Ancram | 24 | $4,768 | $479.80 | 41% |
| Milford | 14 | $4,704 | $459.06 | 53% |
| Worthington | 11 | $4,689 | $601.71 | 30% |