Lake No. 2 Airbnb Market Analysis 2025: Short Term Rental Data & Vacation Rental Statistics in Minnesota, United States
Is Airbnb profitable in Lake No. 2 in 2025? Explore comprehensive Airbnb analytics for Lake No. 2, Minnesota, United States to uncover income potential. This 2025 STR market report for Lake No. 2, based on AirROI data from April 2024 to March 2025, reveals key trends in the niche market of 24 active listings.
Whether you're considering an Airbnb investment in Lake No. 2, optimizing your existing vacation rental, or exploring rental arbitrage opportunities, understanding the Lake No. 2 Airbnb data is crucial. Leveraging the low regulation environment is key to maximizing your short term rental income potential. Let's dive into the specifics.
Key Lake No. 2 Airbnb Performance Metrics Overview
Monthly Airbnb Revenue Variations & Income Potential in Lake No. 2 (2025)
Understanding the monthly revenue variations for Airbnb listings in Lake No. 2 is key to maximizing your short term rental income potential. Seasonality significantly impacts earnings. Our analysis, based on data from the past 12 months, shows that the peak revenue month for STRs in Lake No. 2 is typically July, while February often presents the lowest earnings, highlighting opportunities for strategic pricing adjustments during shoulder and low seasons. Explore the typical Airbnb income in Lake No. 2 across different performance tiers:
- Best-in-class properties (Top 10%) achieve $10,540+ monthly, often utilizing dynamic pricing and superior guest experiences.
- Strong performing properties (Top 25%) earn $8,058 or more, indicating effective management and desirable locations/amenities.
- Typical properties (Median) generate around $5,028 per month, representing the average market performance.
- Entry-level properties (Bottom 25%) see earnings around $3,065, often with potential for optimization.
Average Monthly Airbnb Earnings Trend in Lake No. 2
Lake No. 2 Airbnb Occupancy Rate Trends (2025)
Maximize your bookings by understanding the Lake No. 2 STR occupancy trends. Seasonal demand shifts significantly influence how often properties are booked. Typically, Julysees the highest demand (peak season occupancy), while February experiences the lowest (low season). Effective strategies, like adjusting minimum stays or offering promotions, can boost occupancy during slower periods. Here's how different property tiers perform in Lake No. 2:
- Best-in-class properties (Top 10%) achieve 82%+ occupancy, indicating high desirability and potentially optimized availability.
- Strong performing properties (Top 25%) maintain 71% or higher occupancy, suggesting good market fit and guest satisfaction.
- Typical properties (Median) have an occupancy rate around 56%.
- Entry-level properties (Bottom 25%) average 38% occupancy, potentially facing higher vacancy.
Average Monthly Occupancy Rate Trend in Lake No. 2
Average Daily Rate (ADR) Airbnb Trends in Lake No. 2 (2025)
Effective short term rental pricing strategy in Lake No. 2 involves understanding monthly ADR fluctuations. The Average Daily Rate (ADR) for Airbnb in Lake No. 2 typically peaks in June and dips lowest during February. Leveraging Airbnb dynamic pricing tools or strategies based on this seasonality can significantly boost revenue. Here's a look at the typical nightly rates achieved:
- Best-in-class properties (Top 10%) command rates of $531+ per night, often due to premium features or locations.
- Strong performing properties (Top 25%) achieve nightly rates of $415 or more.
- Typical properties (Median) charge around $263 per night.
- Entry-level properties (Bottom 25%) earn around $189 per night.
Average Daily Rate (ADR) Trend by Month in Lake No. 2
Get Live Lake No. 2 Market Intelligence 👇

Explore Real-time Analytics
Airbnb Seasonality Analysis & Trends in Lake No. 2 (2025)
Peak Season (July, August, June)
- Revenue averages $8,962 per month
- Occupancy rates average 75.4%
- Daily rates average $337
Shoulder Season
- Revenue averages $5,582 per month
- Occupancy maintains around 53.4%
- Daily rates hold near $305
Low Season (January, February, March)
- Revenue drops to average $3,254 per month
- Occupancy decreases to average 38.8%
- Daily rates adjust to average $300
Seasonality Insights for Lake No. 2
- The Airbnb seasonality in Lake No. 2 shows highly seasonal trends requiring careful strategy. While the sections above show seasonal averages, it's also insightful to look at the extremes:
- During the high season, the absolute peak month showcases Lake No. 2's highest earning potential, with monthly revenues capable of climbing to $9,333, occupancy reaching a high of 81.3%, and ADRs peaking at $342.
- Conversely, the slowest single month of the year, typically falling within the low season, marks the market's lowest point. In this month, revenue might dip to $2,700, occupancy could drop to 38.4%, and ADRs may adjust down to $291.
- Understanding both the seasonal averages and these monthly peaks and troughs in revenue, occupancy, and ADR is crucial for maximizing your Airbnb profit potential in Lake No. 2.
Seasonal Strategies for Maximizing Profit
- Peak Season: Maximize revenue through premium pricing and potentially longer minimum stays. Ensure high availability.
- Low Season: Offer competitive pricing, special promotions (e.g., extended stay discounts), and flexible cancellation policies. Target off-season travelers like remote workers or budget-conscious guests.
- Shoulder Seasons: Implement dynamic pricing that balances peak and low rates. Target weekend travelers or specific events. Offer slightly more flexible terms than peak season.
- Regularly analyze your own performance against these Lake No. 2 seasonality benchmarks and adjust your pricing and availability strategy accordingly.
Best Areas for Airbnb Investment in Lake No. 2 (2025)
Exploring the top neighborhoods for short-term rentals in Lake No. 2? This section highlights key areas, outlining why they are attractive for hosts and guests, along with notable local attractions. Consider these locations based on your target guest profile and investment strategy.
| Neighborhood / Area | Why Host Here? (Target Guests & Appeal) | Key Attractions & Landmarks |
|---|---|---|
| Minnetonka | A suburban gem known for its beautiful lakes and parks, perfect for family getaways and outdoor enthusiasts. Close to the Twin Cities, providing easy access to city attractions while enjoying a peaceful lakeside environment. | Minnetonka Beach, Gray's Bay Marina, Big Island, Minnetonka Trails, Ridgedale Center |
| Saint Louis Park | A vibrant community with a mix of urban and suburban living. Great for families and business travelers alike, with convenient access to downtown Minneapolis and a thriving local scene. | West End, Protectors of the Environment, Louis Park Recreation Center, Highland Village, The Shops at Knollwood |
| Hopkins | A small-town feel with a historic downtown. Hopkins offers charm and a welcoming environment for visitors, along with proximity to the Twin Cities. | Hopkins Center for the Arts, Mainstreet, The Artist's Way, Wooden Hill Brewing Company, Shady Oak Lake |
| Eden Prairie | Known for its shopping, dining, and recreational opportunities, Eden Prairie is ideal for guests looking for a suburban retreat just a short drive from the urban bustle. | Mall of America, Eden Prairie Center, Purgatory Park, Lake Eden, Eden Prairie Community Center |
| Chanhassen | A picturesque location featuring beautiful lakes and outdoor activities. Ideal for those seeking a tranquil environment with a family-friendly atmosphere. | Chanhassen Dinner Theatres, Lake Ann Park, Pioneer Trail Park, Nokomis Regional Park, Minnesota Landscape Arboretum |
| Prior Lake | A scenic area with lakes and waterways, perfect for those looking to enjoy boating and fishing. A great spot for outdoor enthusiasts and families. | Prior Lake, Sand Point Beach, Lakefront Park, The Wilds Golf Club, Mystic Lake Casino |
| Lakeville | A growing suburban area with great schooling and plenty of parks. Suitable for families looking to enjoy a laid-back lifestyle while still being connected to the Minneapolis-St. Paul area. | Lakeville Area Arts Center, Antlers Park, Lake Marion, Dodd Boulevard Trail, IKEA |
| Moorhead | A vibrant community situated on the Red River, offering rich cultural experiences and outdoor activities. A hidden gem for visitors exploring the greater Minnesota area. | Moorhead Parks and Recreation, Buffalo River State Park, Moorhead History Museum, The Comet Theatre, Blue Eagle's Market |
Understanding Airbnb License Requirements & STR Laws in Lake No. 2 (2025)
While Lake No. 2, Minnesota, United States currently shows low STR regulations, specific Airbnb license requirements might still exist or change. Always verify the latest short term rental regulations and Airbnb license requirements directly with local government authorities for Lake No. 2 to ensure full compliance before hosting.
(Source: AirROI data, 2025, finding no licensed listings among those analyzed)
Top Performing Airbnb Properties in Lake No. 2 (2025)
Benchmark your potential! Explore examples of top-performing Airbnb properties in Lake No. 2based on Trailing Twelve Month (TTM) revenue. Analyze their characteristics, revenue, occupancy rate, and ADR to understand what drives success in this market.

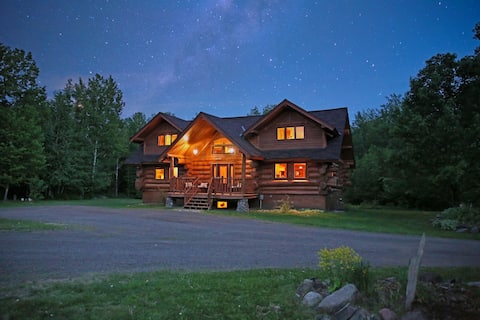
Luxury Log Home-Lakeside Sauna-Private Guest Cabin
Entire Place • 4 bedrooms
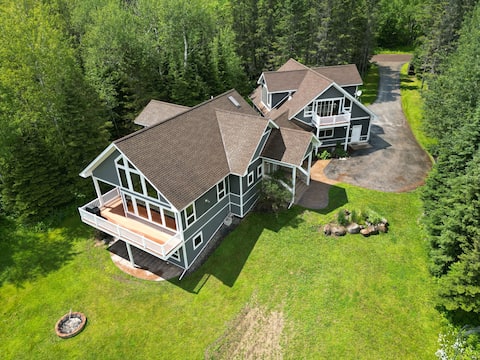
North Shore Luxury at Superior Gateway Lodge
Entire Place • 4 bedrooms

Cedar Cove on Lake Superior
Entire Place • 4 bedrooms
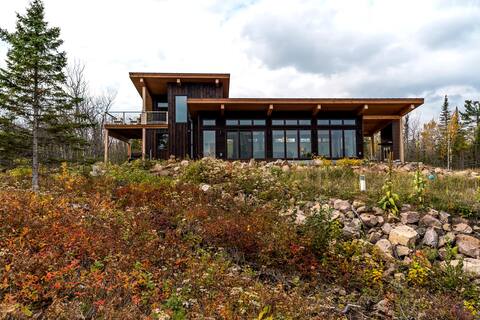
Architect-designed, net zero home w/ stunning view
Entire Place • 3 bedrooms
Cabin in Knife River with Sauna and Amazing Views
Entire Place • 3 bedrooms
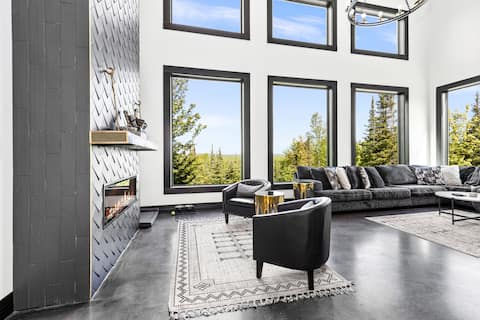
Rare large contemporary four bedroom with views
Entire Place • 4 bedrooms
Note: Performance varies based on location, size, amenities, seasonality, and management quality. Data reflects the past 12 months.
Top Performing Airbnb Hosts in Lake No. 2 (2025)
Learn from the best! This table showcases top-performing Airbnb hosts in Lake No. 2 based on the number of properties managed and estimated total revenue over the past year. Analyze their scale and performance metrics.
| Host Name | Properties | Grossing Revenue | Stay Reviews | Avg Rating |
|---|---|---|---|---|
| Kris | 1 | $149,166 | 38 | 5.00/5.0 |
| Lauren And Brenda | 2 | $123,821 | 158 | 4.88/5.0 |
| Beth | 1 | $114,898 | 44 | 5.00/5.0 |
| Angela | 1 | $114,865 | 92 | 4.99/5.0 |
| Jack | 1 | $110,960 | 108 | 4.95/5.0 |
| Troy | 1 | $93,577 | 76 | 5.00/5.0 |
| Gray Duck Resorts | 1 | $90,692 | 29 | 4.93/5.0 |
| Chelsea And Joel | 1 | $85,854 | 27 | 4.96/5.0 |
| Mavrik | 1 | $69,560 | 99 | 4.95/5.0 |
| Karen | 1 | $68,200 | 44 | 4.98/5.0 |
Analyzing the strategies of top hosts, such as their property selection, pricing, and guest communication, can offer valuable lessons for optimizing your own Airbnb operations in Lake No. 2.
Dive Deeper: Advanced Lake No. 2 STR Market Data (2025)
Ready to unlock more insights? AirROI provides access to advanced metrics and comprehensive Airbnb data for Lake No. 2. Explore detailed analytics beyond this report to refine your investment strategy, optimize pricing, and maximize your vacation rental profits.
Explore Advanced MetricsLake No. 2 Short-Term Rental Market Composition (2025): Property & Room Types
Room Type Distribution
Property Type Distribution
Market Composition Insights for Lake No. 2
- The Lake No. 2 Airbnb market composition is heavily skewed towards Entire Home/Apt listings, which make up 100% of the 24 active rentals. This indicates strong guest preference for privacy and space.
- Looking at the property type distribution in Lake No. 2, House properties are the most common (70.8%), reflecting the local real estate landscape.
- Houses represent a significant 70.8% portion, catering likely to families or larger groups.
- Smaller segments like unique stays (combined 4.2%) offer potential for unique stay experiences.
Lake No. 2 Airbnb Room Capacity Analysis (2025): Bedroom Distribution
Distribution of Listings by Number of Bedrooms
Room Capacity Insights for Lake No. 2
- The dominant room capacity in Lake No. 2 is 3 bedrooms listings, making up 37.5% of the market. This suggests a strong demand for properties suitable for families or small groups.
- Together, 3 bedrooms and 4 bedrooms properties represent 58.3% of the active Airbnb listings in Lake No. 2, indicating a high concentration in these sizes.
- A significant 62.5% of listings offer 3+ bedrooms, catering to larger groups and families seeking more space in Lake No. 2.
Lake No. 2 Vacation Rental Guest Capacity Trends (2025)
Distribution of Listings by Guest Capacity
Guest Capacity Insights for Lake No. 2
- The most common guest capacity trend in Lake No. 2 vacation rentals is listings accommodating 4 guests (37.5%). This suggests the primary traveler segment is likely small families or groups.
- Properties designed for 4 guests and 8+ guests dominate the Lake No. 2 STR market, accounting for 66.7% of listings.
- 58.4% of properties accommodate 6+ guests, serving the market segment for larger families or group travel in Lake No. 2.
- On average, properties in Lake No. 2 are equipped to host 5.7 guests.
Lake No. 2 Airbnb Booking Patterns (2025): Available vs. Booked Days
Available Days Distribution
Booked Days Distribution
Booking Pattern Insights for Lake No. 2
- The most common availability pattern in Lake No. 2 falls within the 91-180 days range, representing 37.5% of listings. This suggests many properties have significant open periods on their calendars.
- Approximately 41.7% of listings show high availability (181+ days open annually), indicating potential for increased bookings or specific owner usage patterns.
- For booked days, the 181-270 days range is most frequent in Lake No. 2 (37.5%), reflecting common guest stay durations or potential owner blocking patterns.
- A notable 58.3% of properties secure long booking periods (181+ days booked per year), highlighting successful long-term rental strategies or significant owner usage.
Lake No. 2 Airbnb Minimum Stay Requirements Analysis
Distribution of Listings by Minimum Night Requirement
2 Nights
15 listings
62.5% of total
3 Nights
2 listings
8.3% of total
7-29 Nights
1 listings
4.2% of total
30+ Nights
6 listings
25% of total
Key Insights
- The most prevalent minimum stay requirement in Lake No. 2 is 2 Nights, adopted by 62.5% of listings. This highlights the market's preference for shorter, flexible bookings.
- A strong majority (62.5%) of the Lake No. 2 Airbnb data shows acceptance of very short stays (1-2 nights), indicating a dynamic, high-turnover market.
- A significant segment (25%) caters to monthly stays (30+ nights) in Lake No. 2, pointing to opportunities in the extended-stay market.
Recommendations
- Align with the market by considering a 2 Nights minimum stay, as 62.5% of Lake No. 2 hosts use this setting.
- A 2-night minimum appears standard (62.5%). Consider this for weekends or peak periods.
- Explore offering discounts for stays of 30+ nights to attract the 25% of the market seeking extended stays.
- Adjust minimum nights based on seasonality – potentially shorter during low season and longer during peak demand periods in Lake No. 2.
Lake No. 2 Airbnb Cancellation Policy Trends Analysis (2025)
Super Strict 60 Days
1 listings
4.3% of total
Flexible
5 listings
21.7% of total
Moderate
4 listings
17.4% of total
Firm
10 listings
43.5% of total
Strict
3 listings
13% of total
Cancellation Policy Insights for Lake No. 2
- The prevailing Airbnb cancellation policy trend in Lake No. 2 is Firm, used by 43.5% of listings.
- A majority (56.5%) of hosts in Lake No. 2 utilize Firm or Strict policies, indicating a market where hosts prioritize booking security.
Recommendations for Hosts
- Consider adopting a Firm policy to align with the 43.5% market standard in Lake No. 2.
- Using a Strict policy might deter some guests, as only 13% of listings use it. Evaluate if potential revenue protection outweighs possible lower booking rates.
- Regularly review your cancellation policy against competitors and market demand shifts in Lake No. 2.
Lake No. 2 STR Booking Lead Time Analysis (2025)
Average Booking Lead Time by Month
Booking Lead Time Insights for Lake No. 2
- The overall average booking lead time for vacation rentals in Lake No. 2 is 61 days.
- Guests book furthest in advance for stays during July (average 107 days), likely coinciding with peak travel demand or local events.
- The shortest booking windows occur for stays in March (average 35 days), indicating more last-minute travel plans during this time.
- Seasonally, Summer (95 days avg.) sees the longest lead times, while Winter (42 days avg.) has the shortest, reflecting typical travel planning cycles.
Recommendations for Hosts
- Use the overall average lead time (61 days) as a baseline for your pricing and availability strategy in Lake No. 2.
- For July stays, consider implementing length-of-stay discounts or slightly higher rates for bookings made less than 107 days out to capitalize on advance planning.
- Target marketing efforts for the Summer season well in advance (at least 95 days) to capture early planners.
- Monitor your own booking lead times against these Lake No. 2 averages to identify opportunities for dynamic pricing adjustments.
Popular & Essential Airbnb Amenities in Lake No. 2 (2025)
Amenity Prevalence
Amenity Insights for Lake No. 2
- Essential amenities in Lake No. 2 that guests expect include: Cooking basics, Smoke alarm, Free parking on premises, Kitchen, Fire extinguisher, Carbon monoxide alarm, Heating, Dishes and silverware. Lacking these (any) could significantly impact bookings.
- Popular amenities like First aid kit, Stove are common but not universal. Offering these can provide a competitive edge.
Recommendations for Hosts
- Ensure your listing includes all essential amenities for Lake No. 2: Cooking basics, Smoke alarm, Free parking on premises, Kitchen, Fire extinguisher, Carbon monoxide alarm, Heating, Dishes and silverware.
- Prioritize adding missing essentials: Fire extinguisher, Carbon monoxide alarm, Heating, Dishes and silverware.
- Consider adding popular differentiators like First aid kit or Stove to increase appeal.
- Highlight unique or less common amenities you offer (e.g., hot tub, dedicated workspace, EV charger) in your listing description and photos.
- Regularly check competitor amenities in Lake No. 2 to stay competitive.
Lake No. 2 Airbnb Guest Demographics & Profile Analysis (2025)
Guest Profile Summary for Lake No. 2
- The typical guest profile for Airbnb in Lake No. 2 consists of primarily domestic travelers (99%), often arriving from nearby Minneapolis, typically belonging to the Post-2000s (Gen Z/Alpha) group (50%), primarily speaking English or Spanish.
- Domestic travelers account for 99.4% of guests.
- Key international markets include United States (99.4%) and Belgium (0.2%).
- Top languages spoken are English (73.3%) followed by Spanish (9.4%).
- A significant demographic segment is the Post-2000s (Gen Z/Alpha) group, representing 50% of guests.
Recommendations for Hosts
- Target domestic marketing efforts towards travelers from Minneapolis and Saint Paul.
- Tailor amenities and listing descriptions to appeal to the dominant Post-2000s (Gen Z/Alpha) demographic (e.g., highlight fast WiFi, smart home features, local guides).
- Highlight unique local experiences or amenities relevant to the primary guest profile.
- Consider seasonal promotions aligned with peak travel times for key origin markets.
Nearby Short-Term Rental Market Comparison
How does the Lake No. 2 Airbnb market stack up against its neighbors? Compare key performance metrics like average monthly revenue, ADR, and occupancy rates in surrounding areas to understand the broader regional STR landscape.
| Market | Active Properties | Monthly Revenue | Daily Rate | Avg. Occupancy |
|---|---|---|---|---|
| Silver Creek Township | 19 | $5,489 | $325.00 | 58% |
| Lutsen | 12 | $5,430 | $386.14 | 47% |
| Tofte | 14 | $5,052 | $461.98 | 37% |
| Schroeder | 10 | $5,039 | $404.98 | 51% |
| Town of Clover | 17 | $4,811 | $253.36 | 61% |
| Morse Township | 10 | $4,546 | $329.79 | 53% |
| Lutsen Township | 165 | $4,322 | $387.87 | 39% |
| West Cook | 111 | $4,243 | $335.89 | 47% |
| Tofte Township | 39 | $4,210 | $269.63 | 51% |
| Hermantown | 18 | $4,162 | $320.65 | 57% |