South Hadley Airbnb Market Analysis 2025: Short Term Rental Data & Vacation Rental Statistics in Massachusetts, United States
Is Airbnb profitable in South Hadley in 2025? Explore comprehensive Airbnb analytics for South Hadley, Massachusetts, United States to uncover income potential. This 2025 STR market report for South Hadley, based on AirROI data from April 2024 to March 2025, reveals key trends in the niche market of 20 active listings.
Whether you're considering an Airbnb investment in South Hadley, optimizing your existing vacation rental, or exploring rental arbitrage opportunities, understanding the South Hadley Airbnb data is crucial. Leveraging the low regulation environment is key to maximizing your short term rental income potential. Let's dive into the specifics.
Key South Hadley Airbnb Performance Metrics Overview
Monthly Airbnb Revenue Variations & Income Potential in South Hadley (2025)
Understanding the monthly revenue variations for Airbnb listings in South Hadley is key to maximizing your short term rental income potential. Seasonality significantly impacts earnings. Our analysis, based on data from the past 12 months, shows that the peak revenue month for STRs in South Hadley is typically July, while January often presents the lowest earnings, highlighting opportunities for strategic pricing adjustments during shoulder and low seasons. Explore the typical Airbnb income in South Hadley across different performance tiers:
- Best-in-class properties (Top 10%) achieve $5,411+ monthly, often utilizing dynamic pricing and superior guest experiences.
- Strong performing properties (Top 25%) earn $3,327 or more, indicating effective management and desirable locations/amenities.
- Typical properties (Median) generate around $2,098 per month, representing the average market performance.
- Entry-level properties (Bottom 25%) see earnings around $1,251, often with potential for optimization.
Average Monthly Airbnb Earnings Trend in South Hadley
South Hadley Airbnb Occupancy Rate Trends (2025)
Maximize your bookings by understanding the South Hadley STR occupancy trends. Seasonal demand shifts significantly influence how often properties are booked. Typically, Julysees the highest demand (peak season occupancy), while March experiences the lowest (low season). Effective strategies, like adjusting minimum stays or offering promotions, can boost occupancy during slower periods. Here's how different property tiers perform in South Hadley:
- Best-in-class properties (Top 10%) achieve 72%+ occupancy, indicating high desirability and potentially optimized availability.
- Strong performing properties (Top 25%) maintain 57% or higher occupancy, suggesting good market fit and guest satisfaction.
- Typical properties (Median) have an occupancy rate around 40%.
- Entry-level properties (Bottom 25%) average 23% occupancy, potentially facing higher vacancy.
Average Monthly Occupancy Rate Trend in South Hadley
Average Daily Rate (ADR) Airbnb Trends in South Hadley (2025)
Effective short term rental pricing strategy in South Hadley involves understanding monthly ADR fluctuations. The Average Daily Rate (ADR) for Airbnb in South Hadley typically peaks in May and dips lowest during December. Leveraging Airbnb dynamic pricing tools or strategies based on this seasonality can significantly boost revenue. Here's a look at the typical nightly rates achieved:
- Best-in-class properties (Top 10%) command rates of $274+ per night, often due to premium features or locations.
- Strong performing properties (Top 25%) achieve nightly rates of $256 or more.
- Typical properties (Median) charge around $197 per night.
- Entry-level properties (Bottom 25%) earn around $103 per night.
Average Daily Rate (ADR) Trend by Month in South Hadley
Get Live South Hadley Market Intelligence 👇

Explore Real-time Analytics
Airbnb Seasonality Analysis & Trends in South Hadley (2025)
Peak Season (July, June, November)
- Revenue averages $3,382 per month
- Occupancy rates average 51.9%
- Daily rates average $203
Shoulder Season
- Revenue averages $2,731 per month
- Occupancy maintains around 43.9%
- Daily rates hold near $205
Low Season (January, February, March)
- Revenue drops to average $1,472 per month
- Occupancy decreases to average 26.0%
- Daily rates adjust to average $194
Seasonality Insights for South Hadley
- The Airbnb seasonality in South Hadley shows highly seasonal trends requiring careful strategy. While the sections above show seasonal averages, it's also insightful to look at the extremes:
- During the high season, the absolute peak month showcases South Hadley's highest earning potential, with monthly revenues capable of climbing to $3,643, occupancy reaching a high of 62.6%, and ADRs peaking at $212.
- Conversely, the slowest single month of the year, typically falling within the low season, marks the market's lowest point. In this month, revenue might dip to $1,380, occupancy could drop to 25.1%, and ADRs may adjust down to $192.
- Understanding both the seasonal averages and these monthly peaks and troughs in revenue, occupancy, and ADR is crucial for maximizing your Airbnb profit potential in South Hadley.
Seasonal Strategies for Maximizing Profit
- Peak Season: Maximize revenue through premium pricing and potentially longer minimum stays. Ensure high availability.
- Low Season: Offer competitive pricing, special promotions (e.g., extended stay discounts), and flexible cancellation policies. Target off-season travelers like remote workers or budget-conscious guests.
- Shoulder Seasons: Implement dynamic pricing that balances peak and low rates. Target weekend travelers or specific events. Offer slightly more flexible terms than peak season.
- Regularly analyze your own performance against these South Hadley seasonality benchmarks and adjust your pricing and availability strategy accordingly.
Best Areas for Airbnb Investment in South Hadley (2025)
Exploring the top neighborhoods for short-term rentals in South Hadley? This section highlights key areas, outlining why they are attractive for hosts and guests, along with notable local attractions. Consider these locations based on your target guest profile and investment strategy.
| Neighborhood / Area | Why Host Here? (Target Guests & Appeal) | Key Attractions & Landmarks |
|---|---|---|
| Mount Tom State Reservation | A beautiful natural area with hiking trails, stunning views, and picnic spots. Popular for outdoor enthusiasts and nature lovers seeking a tranquil escape close to South Hadley. | Mount Tom, Hiking Trails, Scenic Views, Picnicking Areas |
| South Hadley Falls | An area with historical significance and proximity to the Connecticut River. It's becoming popular due to its community vibe and local businesses, appealing for visitors interested in the city's history. | Canal Park, Historic Buildings, Connecticut River |
| McCray's Farm | A family-friendly destination known for its seasonal activities, like apple picking and hayrides. Ideal for families looking for outdoor experiences and local produce. | Apple Picking, Farmers Market, Hayrides |
| Hampshire College | Known for its unique approach to education and beautiful campus, it attracts students and visitors looking for cultural and educational experiences. | Art Galleries, Student Exhibitions, Campus Tours |
| Village Commons | A bustling area with shops, dining options, and cultural events. Attractive to visitors looking for a mix of shopping and entertainment. | Shopping Stores, Restaurants, Cultural Events |
| South Hadley Public Library | A community hub that offers events and resources, making it a good spot for those interested in local culture and activities. | Library Events, Reading Programs, Study Areas |
| Bicycle Path | A scenic trail that is popular for cycling and walking, appealing to fitness enthusiasts and those who enjoy outdoor leisure activities. | Biking Trails, Walking Paths, Nature Views |
| Connecticut River | The river offers recreational activities such as kayaking, fishing, and scenic views, appealing to nature lovers and adventure seekers. | Kayaking, Fishing, Scenic Views |
Understanding Airbnb License Requirements & STR Laws in South Hadley (2025)
While South Hadley, Massachusetts, United States currently shows low STR regulations, specific Airbnb license requirements might still exist or change. Always verify the latest short term rental regulations and Airbnb license requirements directly with local government authorities for South Hadley to ensure full compliance before hosting.
(Source: AirROI data, 2025, finding no licensed listings among those analyzed)
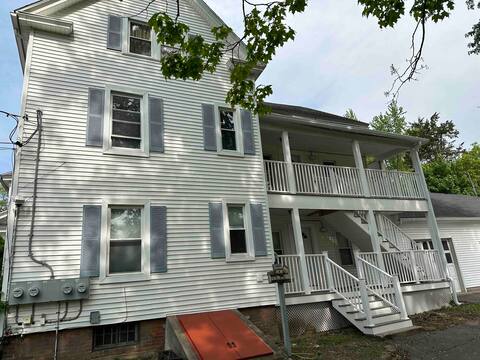
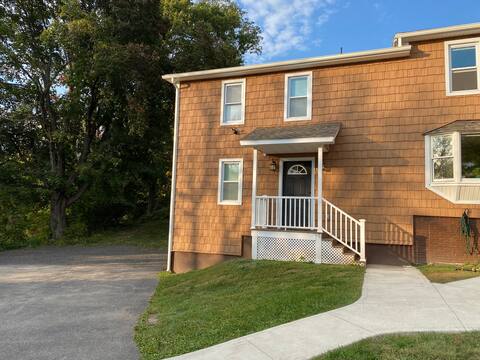
Top Performing Airbnb Properties in South Hadley (2025)
Benchmark your potential! Explore examples of top-performing Airbnb properties in South Hadleybased on Trailing Twelve Month (TTM) revenue. Analyze their characteristics, revenue, occupancy rate, and ADR to understand what drives success in this market.
A Nod to Mod
Entire Place • 4 bedrooms

River front guest suite
Entire Place • 2 bedrooms

Farmhouse with character & warmth 1st Floor
Entire Place • 3 bedrooms

Dog friendly, 2 fireplaces,Pool, Pickleball, 3 bd
Private Room • 3 bedrooms

Newly Rennovated Vintage 1875 Farmhouse 2nd Floor
Entire Place • 3 bedrooms
Brand New Old House-Vintage 1783 0.2 mil from MHC
Entire Place • 1 bedroom
Note: Performance varies based on location, size, amenities, seasonality, and management quality. Data reflects the past 12 months.
Top Performing Airbnb Hosts in South Hadley (2025)
Learn from the best! This table showcases top-performing Airbnb hosts in South Hadley based on the number of properties managed and estimated total revenue over the past year. Analyze their scale and performance metrics.
| Host Name | Properties | Grossing Revenue | Stay Reviews | Avg Rating |
|---|---|---|---|---|
| Azam | 3 | $128,056 | 354 | 4.94/5.0 |
| Mary | 2 | $49,841 | 6 | 2.50/5.0 |
| Ruth | 4 | $48,816 | 43 | 5.00/5.0 |
| Ali | 1 | $47,349 | 70 | 4.84/5.0 |
| Joseph | 1 | $32,685 | 291 | 4.94/5.0 |
| Host #428566661 | 3 | $31,905 | 38 | 3.19/5.0 |
| Lynn | 1 | $26,312 | 85 | 4.96/5.0 |
| Sheila | 1 | $23,301 | 42 | 4.86/5.0 |
| Selene | 1 | $20,202 | 168 | 4.96/5.0 |
| Host #419171726 | 1 | $12,867 | 2 | 0.00/5.0 |
Analyzing the strategies of top hosts, such as their property selection, pricing, and guest communication, can offer valuable lessons for optimizing your own Airbnb operations in South Hadley.
Dive Deeper: Advanced South Hadley STR Market Data (2025)
Ready to unlock more insights? AirROI provides access to advanced metrics and comprehensive Airbnb data for South Hadley. Explore detailed analytics beyond this report to refine your investment strategy, optimize pricing, and maximize your vacation rental profits.
Explore Advanced MetricsSouth Hadley Short-Term Rental Market Composition (2025): Property & Room Types
Room Type Distribution
Property Type Distribution
Market Composition Insights for South Hadley
- The South Hadley Airbnb market composition is heavily skewed towards Entire Home/Apt listings, which make up 65% of the 20 active rentals. This indicates strong guest preference for privacy and space.
- However, a notable 35% share for Private Rooms suggests opportunities for budget-conscious travelers or hosts renting out spare rooms.
- Looking at the property type distribution in South Hadley, House properties are the most common (35%), reflecting the local real estate landscape.
- Houses represent a significant 35% portion, catering likely to families or larger groups.
- The presence of 20% Hotel/Boutique listings indicates integration with traditional hospitality.
South Hadley Airbnb Room Capacity Analysis (2025): Bedroom Distribution
Distribution of Listings by Number of Bedrooms
Room Capacity Insights for South Hadley
- The dominant room capacity in South Hadley is 1 bedroom listings, making up 35% of the market. This suggests a strong demand for properties suitable for couples or solo travelers.
- Together, 1 bedroom and 3 bedrooms properties represent 55.0% of the active Airbnb listings in South Hadley, indicating a high concentration in these sizes.
- A significant 30.0% of listings offer 3+ bedrooms, catering to larger groups and families seeking more space in South Hadley.
South Hadley Vacation Rental Guest Capacity Trends (2025)
Distribution of Listings by Guest Capacity
Guest Capacity Insights for South Hadley
- The most common guest capacity trend in South Hadley vacation rentals is listings accommodating 2 guests (25%). This suggests the primary traveler segment is likely couples or solo travelers.
- Properties designed for 2 guests and 6 guests dominate the South Hadley STR market, accounting for 40.0% of listings.
- 25.0% of properties accommodate 6+ guests, serving the market segment for larger families or group travel in South Hadley.
- On average, properties in South Hadley are equipped to host 3.3 guests.
South Hadley Airbnb Booking Patterns (2025): Available vs. Booked Days
Available Days Distribution
Booked Days Distribution
Booking Pattern Insights for South Hadley
- The most common availability pattern in South Hadley falls within the 181-270 days range, representing 40% of listings. This suggests many properties have significant open periods on their calendars.
- Approximately 80.0% of listings show high availability (181+ days open annually), indicating potential for increased bookings or specific owner usage patterns.
- For booked days, the 91-180 days range is most frequent in South Hadley (45%), reflecting common guest stay durations or potential owner blocking patterns.
- A notable 20.0% of properties secure long booking periods (181+ days booked per year), highlighting successful long-term rental strategies or significant owner usage.
South Hadley Airbnb Minimum Stay Requirements Analysis
Distribution of Listings by Minimum Night Requirement
1 Night
6 listings
35.3% of total
2 Nights
7 listings
41.2% of total
7-29 Nights
2 listings
11.8% of total
30+ Nights
2 listings
11.8% of total
Key Insights
- The most prevalent minimum stay requirement in South Hadley is 2 Nights, adopted by 41.2% of listings. This highlights the market's preference for shorter, flexible bookings.
- A strong majority (76.5%) of the South Hadley Airbnb data shows acceptance of very short stays (1-2 nights), indicating a dynamic, high-turnover market.
- A significant segment (11.8%) caters to monthly stays (30+ nights) in South Hadley, pointing to opportunities in the extended-stay market.
Recommendations
- Align with the market by considering a 2 Nights minimum stay, as 41.2% of South Hadley hosts use this setting.
- Explore offering discounts for stays of 30+ nights to attract the 11.8% of the market seeking extended stays.
- Adjust minimum nights based on seasonality – potentially shorter during low season and longer during peak demand periods in South Hadley.
South Hadley Airbnb Cancellation Policy Trends Analysis (2025)
Flexible
1 listings
6.3% of total
Moderate
2 listings
12.5% of total
Firm
4 listings
25% of total
Strict
9 listings
56.3% of total
Cancellation Policy Insights for South Hadley
- The prevailing Airbnb cancellation policy trend in South Hadley is Strict, used by 56.3% of listings.
- A majority (81.3%) of hosts in South Hadley utilize Firm or Strict policies, indicating a market where hosts prioritize booking security.
Recommendations for Hosts
- Consider adopting a Strict policy to align with the 56.3% market standard in South Hadley.
- With 56.3% using Strict terms, this is a viable option in South Hadley, particularly for high-value properties or during peak demand periods.
- Regularly review your cancellation policy against competitors and market demand shifts in South Hadley.
South Hadley STR Booking Lead Time Analysis (2025)
Average Booking Lead Time by Month
Booking Lead Time Insights for South Hadley
- The overall average booking lead time for vacation rentals in South Hadley is 53 days.
- Guests book furthest in advance for stays during May (average 129 days), likely coinciding with peak travel demand or local events.
- The shortest booking windows occur for stays in January (average 17 days), indicating more last-minute travel plans during this time.
- Seasonally, Spring (60 days avg.) sees the longest lead times, while Winter (37 days avg.) has the shortest, reflecting typical travel planning cycles.
Recommendations for Hosts
- Use the overall average lead time (53 days) as a baseline for your pricing and availability strategy in South Hadley.
- For May stays, consider implementing length-of-stay discounts or slightly higher rates for bookings made less than 129 days out to capitalize on advance planning.
- Target marketing efforts for the Spring season well in advance (at least 60 days) to capture early planners.
- Monitor your own booking lead times against these South Hadley averages to identify opportunities for dynamic pricing adjustments.
Popular & Essential Airbnb Amenities in South Hadley (2025)
Amenity Prevalence
No amenities with partial availability (less than 100%) were found to display in the chart. All essential amenities might be present in all listings. Check insights below.
Amenity Insights for South Hadley
- Essential amenities in South Hadley that guests expect include: Heating, Iron, Wifi, TV, Smoke alarm, Hair dryer, Carbon monoxide alarm, Hangers, Free parking on premises, Shampoo. Lacking these (any) could significantly impact bookings.
Recommendations for Hosts
- Ensure your listing includes all essential amenities for South Hadley: Heating, Iron, Wifi, TV, Smoke alarm, Hair dryer, Carbon monoxide alarm, Hangers, Free parking on premises, Shampoo.
- Highlight unique or less common amenities you offer (e.g., hot tub, dedicated workspace, EV charger) in your listing description and photos.
- Regularly check competitor amenities in South Hadley to stay competitive.
South Hadley Airbnb Guest Demographics & Profile Analysis (2025)
Guest Profile Summary for South Hadley
- The typical guest profile for Airbnb in South Hadley consists of primarily domestic travelers (94%), often arriving from nearby New York, typically belonging to the Post-2000s (Gen Z/Alpha) group (50%), primarily speaking English or Spanish.
- Domestic travelers account for 94.3% of guests.
- Key international markets include United States (94.3%) and Canada (1.3%).
- Top languages spoken are English (59.4%) followed by Spanish (14.8%).
- A significant demographic segment is the Post-2000s (Gen Z/Alpha) group, representing 50% of guests.
Recommendations for Hosts
- Target domestic marketing efforts towards travelers from New York and Boston.
- Tailor amenities and listing descriptions to appeal to the dominant Post-2000s (Gen Z/Alpha) demographic (e.g., highlight fast WiFi, smart home features, local guides).
- Highlight unique local experiences or amenities relevant to the primary guest profile.
- Consider seasonal promotions aligned with peak travel times for key origin markets.
Nearby Short-Term Rental Market Comparison
How does the South Hadley Airbnb market stack up against its neighbors? Compare key performance metrics like average monthly revenue, ADR, and occupancy rates in surrounding areas to understand the broader regional STR landscape.
| Market | Active Properties | Monthly Revenue | Daily Rate | Avg. Occupancy |
|---|---|---|---|---|
| Middletown Springs | 11 | $8,614 | $550.24 | 36% |
| Town of Stuyvesant | 10 | $6,757 | $533.74 | 41% |
| Milford | 11 | $6,343 | $500.10 | 59% |
| Pomfret | 13 | $6,142 | $449.79 | 49% |
| Town of East Hampton | 1,420 | $6,008 | $940.02 | 38% |
| Town of Pawling | 16 | $5,956 | $392.41 | 56% |
| Brookfield | 13 | $5,891 | $486.63 | 51% |
| Fort Ann | 27 | $5,803 | $761.44 | 38% |
| Town/Village of Harrison | 10 | $5,764 | $590.20 | 48% |
| Stony Creek | 11 | $5,749 | $484.51 | 43% |