Palmer Airbnb Market Analysis 2025: Short Term Rental Data & Vacation Rental Statistics in Massachusetts, United States
Is Airbnb profitable in Palmer in 2025? Explore comprehensive Airbnb analytics for Palmer, Massachusetts, United States to uncover income potential. This 2025 STR market report for Palmer, based on AirROI data from April 2024 to March 2025, reveals key trends in the niche market of 18 active listings.
Whether you're considering an Airbnb investment in Palmer, optimizing your existing vacation rental, or exploring rental arbitrage opportunities, understanding the Palmer Airbnb data is crucial. Leveraging the low regulation environment is key to maximizing your short term rental income potential. Let's dive into the specifics.
Key Palmer Airbnb Performance Metrics Overview
Monthly Airbnb Revenue Variations & Income Potential in Palmer (2025)
Understanding the monthly revenue variations for Airbnb listings in Palmer is key to maximizing your short term rental income potential. Seasonality significantly impacts earnings. Our analysis, based on data from the past 12 months, shows that the peak revenue month for STRs in Palmer is typically April, while January often presents the lowest earnings, highlighting opportunities for strategic pricing adjustments during shoulder and low seasons. Explore the typical Airbnb income in Palmer across different performance tiers:
- Best-in-class properties (Top 10%) achieve $3,517+ monthly, often utilizing dynamic pricing and superior guest experiences.
- Strong performing properties (Top 25%) earn $2,286 or more, indicating effective management and desirable locations/amenities.
- Typical properties (Median) generate around $1,489 per month, representing the average market performance.
- Entry-level properties (Bottom 25%) see earnings around $841, often with potential for optimization.
Average Monthly Airbnb Earnings Trend in Palmer
Palmer Airbnb Occupancy Rate Trends (2025)
Maximize your bookings by understanding the Palmer STR occupancy trends. Seasonal demand shifts significantly influence how often properties are booked. Typically, Septembersees the highest demand (peak season occupancy), while January experiences the lowest (low season). Effective strategies, like adjusting minimum stays or offering promotions, can boost occupancy during slower periods. Here's how different property tiers perform in Palmer:
- Best-in-class properties (Top 10%) achieve 68%+ occupancy, indicating high desirability and potentially optimized availability.
- Strong performing properties (Top 25%) maintain 46% or higher occupancy, suggesting good market fit and guest satisfaction.
- Typical properties (Median) have an occupancy rate around 33%.
- Entry-level properties (Bottom 25%) average 16% occupancy, potentially facing higher vacancy.
Average Monthly Occupancy Rate Trend in Palmer
Average Daily Rate (ADR) Airbnb Trends in Palmer (2025)
Effective short term rental pricing strategy in Palmer involves understanding monthly ADR fluctuations. The Average Daily Rate (ADR) for Airbnb in Palmer typically peaks in June and dips lowest during January. Leveraging Airbnb dynamic pricing tools or strategies based on this seasonality can significantly boost revenue. Here's a look at the typical nightly rates achieved:
- Best-in-class properties (Top 10%) command rates of $256+ per night, often due to premium features or locations.
- Strong performing properties (Top 25%) achieve nightly rates of $186 or more.
- Typical properties (Median) charge around $165 per night.
- Entry-level properties (Bottom 25%) earn around $141 per night.
Average Daily Rate (ADR) Trend by Month in Palmer
Get Live Palmer Market Intelligence 👇

Explore Real-time Analytics
Airbnb Seasonality Analysis & Trends in Palmer (2025)
Peak Season (April, May, September)
- Revenue averages $2,841 per month
- Occupancy rates average 49.6%
- Daily rates average $170
Shoulder Season
- Revenue averages $1,862 per month
- Occupancy maintains around 34.3%
- Daily rates hold near $169
Low Season (January, March, December)
- Revenue drops to average $971 per month
- Occupancy decreases to average 21.9%
- Daily rates adjust to average $162
Seasonality Insights for Palmer
- The Airbnb seasonality in Palmer shows highly seasonal trends requiring careful strategy. While the sections above show seasonal averages, it's also insightful to look at the extremes:
- During the high season, the absolute peak month showcases Palmer's highest earning potential, with monthly revenues capable of climbing to $3,145, occupancy reaching a high of 54.2%, and ADRs peaking at $174.
- Conversely, the slowest single month of the year, typically falling within the low season, marks the market's lowest point. In this month, revenue might dip to $777, occupancy could drop to 19.7%, and ADRs may adjust down to $161.
- Understanding both the seasonal averages and these monthly peaks and troughs in revenue, occupancy, and ADR is crucial for maximizing your Airbnb profit potential in Palmer.
Seasonal Strategies for Maximizing Profit
- Peak Season: Maximize revenue through premium pricing and potentially longer minimum stays. Ensure high availability.
- Low Season: Offer competitive pricing, special promotions (e.g., extended stay discounts), and flexible cancellation policies. Target off-season travelers like remote workers or budget-conscious guests.
- Shoulder Seasons: Implement dynamic pricing that balances peak and low rates. Target weekend travelers or specific events. Offer slightly more flexible terms than peak season.
- Regularly analyze your own performance against these Palmer seasonality benchmarks and adjust your pricing and availability strategy accordingly.
Best Areas for Airbnb Investment in Palmer (2025)
Exploring the top neighborhoods for short-term rentals in Palmer? This section highlights key areas, outlining why they are attractive for hosts and guests, along with notable local attractions. Consider these locations based on your target guest profile and investment strategy.
| Neighborhood / Area | Why Host Here? (Target Guests & Appeal) | Key Attractions & Landmarks |
|---|---|---|
| Downtown Palmer | The heart of Palmer with its local shops and restaurants. Easy access to public transport and a friendly community atmosphere. Ideal for travelers who want to experience local culture and dining. | Palmer Town Common, The Center of Palmer, Historic District, Local eateries and cafes, Farmers Market |
| Belchertown Road Area | A suburban area that offers a quiet environment and proximity to nature. Great for families and those looking for a peaceful retreat while still being close to town. | Granite Park, Lake Lashaway, Outdoor Recreation Areas, Fishing spots, Hiking Trails |
| Ware Village | Nearby village atmosphere with charming historic buildings and access to the Ware River. Attracts visitors looking for quaint surroundings and outdoor activities. | Quaboag River, Ware River Park, Historic sites, Local arts and crafts, Fishing and kayaking |
| Monson | A small district known for its rural appeal and outdoor adventures. Great for nature lovers and those who enjoy authentic New England experiences. | Monson Center, Quaboag River State Reservation, Monson Arts Council, Local farms, Hiking trails |
| Three Rivers | Historic neighborhood part of the town offering beautiful views of the river and a small-town atmosphere. Popular for families and visitors looking for peaceful environments. | Three Rivers Park, Local baseball fields, Scenic walks, Historic buildings, River access |
| Brimfield | Famous for its antique shows and flea markets, this area attracts collectors and tourists year-round. Perfect for hosting guests coming to shop and explore. | Brimfield Antique Flea Market, Local shops, Brimfield State Forest, Community events, Antique shops |
| Ludlow | A vibrant community with easy access to larger cities and attractions. Good for families and offers a variety of amenities. | Ludlow Country Club, Great outdoor parks, Local restaurants, Shopping centers, Cultural events |
| Warren | Offers a mix of rural charm and recreational opportunities. Ideal for those who enjoy exploring nature and small-town life. | Warren Town Common, Lake Wickaboag, Outdoor sports opportunities, Hiking trails, Nature reserves |
Understanding Airbnb License Requirements & STR Laws in Palmer (2025)
While Palmer, Massachusetts, United States currently shows low STR regulations, specific Airbnb license requirements might still exist or change. Always verify the latest short term rental regulations and Airbnb license requirements directly with local government authorities for Palmer to ensure full compliance before hosting.
(Source: AirROI data, 2025, finding no licensed listings among those analyzed)
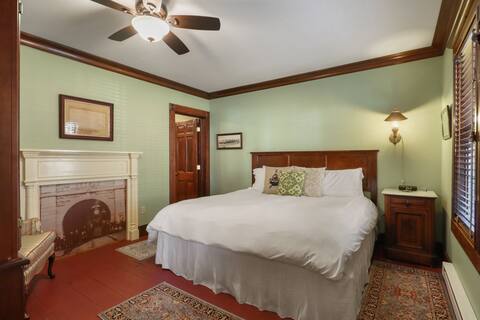
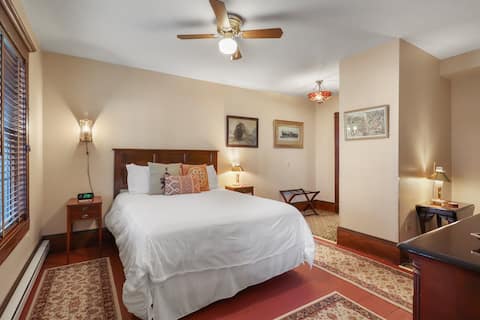
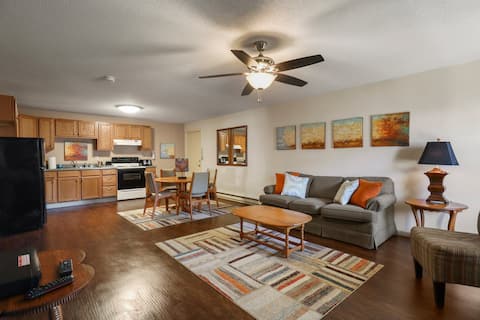
Top Performing Airbnb Properties in Palmer (2025)
Benchmark your potential! Explore examples of top-performing Airbnb properties in Palmerbased on Trailing Twelve Month (TTM) revenue. Analyze their characteristics, revenue, occupancy rate, and ADR to understand what drives success in this market.
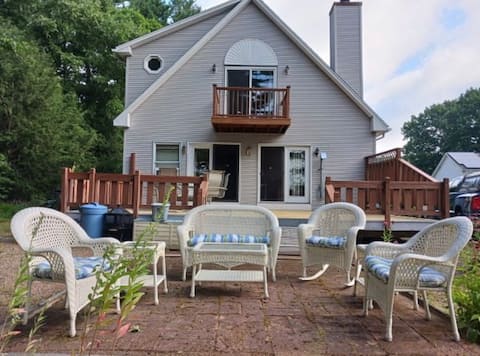
Thompson Lake Front Home
Entire Place • 4 bedrooms
Trainmaster's Inn King Room 2 First Floor
Private Room • 1 bedroom

Trainmaster's Inn - Caboose
Entire Place • 4 bedrooms
Trainmaster's Inn - Trainmaster's Inn Queen
Private Room • 2 bedrooms
Private Apartment 3 Near Mass Pike exit
Entire Place • 1 bedroom
Rest Well in Palmer: 2 rooms and private bathroom
Private Room • 2 bedrooms
Note: Performance varies based on location, size, amenities, seasonality, and management quality. Data reflects the past 12 months.
Top Performing Airbnb Hosts in Palmer (2025)
Learn from the best! This table showcases top-performing Airbnb hosts in Palmer based on the number of properties managed and estimated total revenue over the past year. Analyze their scale and performance metrics.
| Host Name | Properties | Grossing Revenue | Stay Reviews | Avg Rating |
|---|---|---|---|---|
| Robin | 14 | $182,346 | 623 | 4.12/5.0 |
| Elizabeth | 1 | $53,374 | 10 | 5.00/5.0 |
| Tigran | 1 | $17,281 | 29 | 4.72/5.0 |
| Karen | 1 | $14,362 | 113 | 4.81/5.0 |
| Host #1540779 | 1 | $6,537 | 0 | 0.00/5.0 |
Analyzing the strategies of top hosts, such as their property selection, pricing, and guest communication, can offer valuable lessons for optimizing your own Airbnb operations in Palmer.
Dive Deeper: Advanced Palmer STR Market Data (2025)
Ready to unlock more insights? AirROI provides access to advanced metrics and comprehensive Airbnb data for Palmer. Explore detailed analytics beyond this report to refine your investment strategy, optimize pricing, and maximize your vacation rental profits.
Explore Advanced MetricsPalmer Short-Term Rental Market Composition (2025): Property & Room Types
Room Type Distribution
Property Type Distribution
Market Composition Insights for Palmer
- The Palmer Airbnb market composition is heavily skewed towards Private Room listings, which make up 55.6% of the 18 active rentals. This indicates strong guest preference for privacy and space.
- Looking at the property type distribution in Palmer, Apartment/Condo properties are the most common (38.9%), reflecting the local real estate landscape.
- Houses represent a significant 22.2% portion, catering likely to families or larger groups.
- The presence of 33.3% Hotel/Boutique listings indicates integration with traditional hospitality.
Palmer Airbnb Room Capacity Analysis (2025): Bedroom Distribution
Distribution of Listings by Number of Bedrooms
Room Capacity Insights for Palmer
- The dominant room capacity in Palmer is 1 bedroom listings, making up 27.8% of the market. This suggests a strong demand for properties suitable for couples or solo travelers.
- Together, 1 bedroom and 2 bedrooms properties represent 55.6% of the active Airbnb listings in Palmer, indicating a high concentration in these sizes.
- A significant 22.3% of listings offer 3+ bedrooms, catering to larger groups and families seeking more space in Palmer.
Palmer Vacation Rental Guest Capacity Trends (2025)
Distribution of Listings by Guest Capacity
Guest Capacity Insights for Palmer
- The most common guest capacity trend in Palmer vacation rentals is listings accommodating 4 guests (27.8%). This suggests the primary traveler segment is likely small families or groups.
- Properties designed for 4 guests and 2 guests dominate the Palmer STR market, accounting for 50.0% of listings.
- 11.1% of properties accommodate 6+ guests, serving the market segment for larger families or group travel in Palmer.
- On average, properties in Palmer are equipped to host 2.2 guests.
Palmer Airbnb Booking Patterns (2025): Available vs. Booked Days
Available Days Distribution
Booked Days Distribution
Booking Pattern Insights for Palmer
- The most common availability pattern in Palmer falls within the 271-366 days range, representing 61.1% of listings. This suggests many properties have significant open periods on their calendars.
- Approximately 88.9% of listings show high availability (181+ days open annually), indicating potential for increased bookings or specific owner usage patterns.
- For booked days, the 31-90 days range is most frequent in Palmer (38.9%), reflecting common guest stay durations or potential owner blocking patterns.
- A notable 11.1% of properties secure long booking periods (181+ days booked per year), highlighting successful long-term rental strategies or significant owner usage.
Palmer Airbnb Minimum Stay Requirements Analysis
Distribution of Listings by Minimum Night Requirement
1 Night
10 listings
55.6% of total
2 Nights
3 listings
16.7% of total
3 Nights
1 listings
5.6% of total
4-6 Nights
1 listings
5.6% of total
30+ Nights
3 listings
16.7% of total
Key Insights
- The most prevalent minimum stay requirement in Palmer is 1 Night, adopted by 55.6% of listings. This highlights the market's preference for shorter, flexible bookings.
- A strong majority (72.3%) of the Palmer Airbnb data shows acceptance of very short stays (1-2 nights), indicating a dynamic, high-turnover market.
- A significant segment (16.7%) caters to monthly stays (30+ nights) in Palmer, pointing to opportunities in the extended-stay market.
Recommendations
- Align with the market by considering a 1 Night minimum stay, as 55.6% of Palmer hosts use this setting.
- Explore offering discounts for stays of 30+ nights to attract the 16.7% of the market seeking extended stays.
- Adjust minimum nights based on seasonality – potentially shorter during low season and longer during peak demand periods in Palmer.
Palmer Airbnb Cancellation Policy Trends Analysis (2025)
Flexible
1 listings
6.7% of total
Firm
1 listings
6.7% of total
Strict
13 listings
86.7% of total
Cancellation Policy Insights for Palmer
- The prevailing Airbnb cancellation policy trend in Palmer is Strict, used by 86.7% of listings.
- A majority (93.4%) of hosts in Palmer utilize Firm or Strict policies, indicating a market where hosts prioritize booking security.
Recommendations for Hosts
- Consider adopting a Strict policy to align with the 86.7% market standard in Palmer.
- With 86.7% using Strict terms, this is a viable option in Palmer, particularly for high-value properties or during peak demand periods.
- Regularly review your cancellation policy against competitors and market demand shifts in Palmer.
Palmer STR Booking Lead Time Analysis (2025)
Average Booking Lead Time by Month
Booking Lead Time Insights for Palmer
- The overall average booking lead time for vacation rentals in Palmer is 53 days.
- Guests book furthest in advance for stays during May (average 109 days), likely coinciding with peak travel demand or local events.
- The shortest booking windows occur for stays in December (average 14 days), indicating more last-minute travel plans during this time.
- Seasonally, Spring (70 days avg.) sees the longest lead times, while Winter (23 days avg.) has the shortest, reflecting typical travel planning cycles.
Recommendations for Hosts
- Use the overall average lead time (53 days) as a baseline for your pricing and availability strategy in Palmer.
- For May stays, consider implementing length-of-stay discounts or slightly higher rates for bookings made less than 109 days out to capitalize on advance planning.
- During December, focus on last-minute booking availability and promotions, as guests book with very short notice (14 days avg.).
- Target marketing efforts for the Spring season well in advance (at least 70 days) to capture early planners.
- Monitor your own booking lead times against these Palmer averages to identify opportunities for dynamic pricing adjustments.
Popular & Essential Airbnb Amenities in Palmer (2025)
Amenity Prevalence
Amenity Insights for Palmer
- Essential amenities in Palmer that guests expect include: Heating, Air conditioning, Hot water, Wifi, TV. Lacking these (any) could significantly impact bookings.
- Popular amenities like Hair dryer, Iron, Bed linens are common but not universal. Offering these can provide a competitive edge.
Recommendations for Hosts
- Ensure your listing includes all essential amenities for Palmer: Heating, Air conditioning, Hot water, Wifi, TV.
- Consider adding popular differentiators like Hair dryer or Iron to increase appeal.
- Highlight unique or less common amenities you offer (e.g., hot tub, dedicated workspace, EV charger) in your listing description and photos.
- Regularly check competitor amenities in Palmer to stay competitive.
Palmer Airbnb Guest Demographics & Profile Analysis (2025)
Guest Profile Summary for Palmer
- The typical guest profile for Airbnb in Palmer consists of primarily domestic travelers (99%), often arriving from nearby New York, typically belonging to the Post-2000s (Gen Z/Alpha) group (50%), primarily speaking English or Spanish.
- Domestic travelers account for 98.6% of guests.
- Key international markets include United States (98.6%) and United Kingdom (1.4%).
- Top languages spoken are English (79.4%) followed by Spanish (5.9%).
- A significant demographic segment is the Post-2000s (Gen Z/Alpha) group, representing 50% of guests.
Recommendations for Hosts
- Target domestic marketing efforts towards travelers from New York and Boston.
- Tailor amenities and listing descriptions to appeal to the dominant Post-2000s (Gen Z/Alpha) demographic (e.g., highlight fast WiFi, smart home features, local guides).
- Highlight unique local experiences or amenities relevant to the primary guest profile.
- Consider seasonal promotions aligned with peak travel times for key origin markets.
Nearby Short-Term Rental Market Comparison
How does the Palmer Airbnb market stack up against its neighbors? Compare key performance metrics like average monthly revenue, ADR, and occupancy rates in surrounding areas to understand the broader regional STR landscape.
| Market | Active Properties | Monthly Revenue | Daily Rate | Avg. Occupancy |
|---|---|---|---|---|
| Middletown Springs | 11 | $8,614 | $550.24 | 36% |
| Town of Stuyvesant | 10 | $6,757 | $533.74 | 41% |
| Milford | 11 | $6,343 | $500.10 | 59% |
| Pomfret | 13 | $6,142 | $449.79 | 49% |
| Town of East Hampton | 1,420 | $6,008 | $940.02 | 38% |
| Town of Pawling | 16 | $5,956 | $392.41 | 56% |
| Brookfield | 13 | $5,891 | $486.63 | 51% |
| Fort Ann | 27 | $5,803 | $761.44 | 38% |
| Town/Village of Harrison | 10 | $5,764 | $590.20 | 48% |
| Stony Creek | 11 | $5,749 | $484.51 | 43% |