Needham Airbnb Market Analysis 2025: Short Term Rental Data & Vacation Rental Statistics in Massachusetts, United States
Is Airbnb profitable in Needham in 2025? Explore comprehensive Airbnb analytics for Needham, Massachusetts, United States to uncover income potential. This 2025 STR market report for Needham, based on AirROI data from April 2024 to March 2025, reveals key trends in the niche market of 17 active listings.
Whether you're considering an Airbnb investment in Needham, optimizing your existing vacation rental, or exploring rental arbitrage opportunities, understanding the Needham Airbnb data is crucial. Leveraging the low regulation environment is key to maximizing your short term rental income potential. Let's dive into the specifics.
Key Needham Airbnb Performance Metrics Overview
Monthly Airbnb Revenue Variations & Income Potential in Needham (2025)
Understanding the monthly revenue variations for Airbnb listings in Needham is key to maximizing your short term rental income potential. Seasonality significantly impacts earnings. Our analysis, based on data from the past 12 months, shows that the peak revenue month for STRs in Needham is typically June, while March often presents the lowest earnings, highlighting opportunities for strategic pricing adjustments during shoulder and low seasons. Explore the typical Airbnb income in Needham across different performance tiers:
- Best-in-class properties (Top 10%) achieve $8,071+ monthly, often utilizing dynamic pricing and superior guest experiences.
- Strong performing properties (Top 25%) earn $2,733 or more, indicating effective management and desirable locations/amenities.
- Typical properties (Median) generate around $1,370 per month, representing the average market performance.
- Entry-level properties (Bottom 25%) see earnings around $721, often with potential for optimization.
Average Monthly Airbnb Earnings Trend in Needham
Needham Airbnb Occupancy Rate Trends (2025)
Maximize your bookings by understanding the Needham STR occupancy trends. Seasonal demand shifts significantly influence how often properties are booked. Typically, Junesees the highest demand (peak season occupancy), while March experiences the lowest (low season). Effective strategies, like adjusting minimum stays or offering promotions, can boost occupancy during slower periods. Here's how different property tiers perform in Needham:
- Best-in-class properties (Top 10%) achieve 84%+ occupancy, indicating high desirability and potentially optimized availability.
- Strong performing properties (Top 25%) maintain 67% or higher occupancy, suggesting good market fit and guest satisfaction.
- Typical properties (Median) have an occupancy rate around 39%.
- Entry-level properties (Bottom 25%) average 18% occupancy, potentially facing higher vacancy.
Average Monthly Occupancy Rate Trend in Needham
Average Daily Rate (ADR) Airbnb Trends in Needham (2025)
Effective short term rental pricing strategy in Needham involves understanding monthly ADR fluctuations. The Average Daily Rate (ADR) for Airbnb in Needham typically peaks in May and dips lowest during January. Leveraging Airbnb dynamic pricing tools or strategies based on this seasonality can significantly boost revenue. Here's a look at the typical nightly rates achieved:
- Best-in-class properties (Top 10%) command rates of $446+ per night, often due to premium features or locations.
- Strong performing properties (Top 25%) achieve nightly rates of $243 or more.
- Typical properties (Median) charge around $90 per night.
- Entry-level properties (Bottom 25%) earn around $74 per night.
Average Daily Rate (ADR) Trend by Month in Needham
Get Live Needham Market Intelligence 👇

Explore Real-time Analytics
Airbnb Seasonality Analysis & Trends in Needham (2025)
Peak Season (June, May, April)
- Revenue averages $6,793 per month
- Occupancy rates average 53.3%
- Daily rates average $302
Shoulder Season
- Revenue averages $4,038 per month
- Occupancy maintains around 46.3%
- Daily rates hold near $272
Low Season (January, February, March)
- Revenue drops to average $868 per month
- Occupancy decreases to average 34.8%
- Daily rates adjust to average $189
Seasonality Insights for Needham
- The Airbnb seasonality in Needham shows highly seasonal trends requiring careful strategy. While the sections above show seasonal averages, it's also insightful to look at the extremes:
- During the high season, the absolute peak month showcases Needham's highest earning potential, with monthly revenues capable of climbing to $7,465, occupancy reaching a high of 59.7%, and ADRs peaking at $304.
- Conversely, the slowest single month of the year, typically falling within the low season, marks the market's lowest point. In this month, revenue might dip to $572, occupancy could drop to 24.0%, and ADRs may adjust down to $181.
- Understanding both the seasonal averages and these monthly peaks and troughs in revenue, occupancy, and ADR is crucial for maximizing your Airbnb profit potential in Needham.
Seasonal Strategies for Maximizing Profit
- Peak Season: Maximize revenue through premium pricing and potentially longer minimum stays. Ensure high availability.
- Low Season: Offer competitive pricing, special promotions (e.g., extended stay discounts), and flexible cancellation policies. Target off-season travelers like remote workers or budget-conscious guests.
- Shoulder Seasons: Implement dynamic pricing that balances peak and low rates. Target weekend travelers or specific events. Offer slightly more flexible terms than peak season.
- Regularly analyze your own performance against these Needham seasonality benchmarks and adjust your pricing and availability strategy accordingly.
Best Areas for Airbnb Investment in Needham (2025)
Exploring the top neighborhoods for short-term rentals in Needham? This section highlights key areas, outlining why they are attractive for hosts and guests, along with notable local attractions. Consider these locations based on your target guest profile and investment strategy.
| Neighborhood / Area | Why Host Here? (Target Guests & Appeal) | Key Attractions & Landmarks |
|---|---|---|
| Needham Center | The heart of Needham with charming shops, restaurants, and a vibrant community atmosphere. Ideal for guests seeking a suburban experience with urban conveniences. | Needham Town Common, Needham Historical Society and Museum, Needham Community Theatre, Needham Center train station, Needham Farmers Market |
| Needham Heights | A picturesque area with a mix of residential homes and commercial establishments. It appeals to families and professionals looking for a tranquil suburban retreat. | Needham Heights Shopping Center, Needham Swim and Tennis Club, Wilson Mountain Reservation, Needham Golf Club, Powers Farm |
| Greendale | A primarily residential area that offers a peaceful environment while still being close to the main centers of Needham. It attracts visitors looking for a quiet stay. | Greendale Park, Needham Reservoir, Needham Sports Club, Needham Memorial Park, Father Mac's Dog Park |
| Broadmeadow | Known for its family-friendly environment and proximity to top-rated schools. It’s ideal for families traveling with children who prefer more residential accommodations. | Broadmeadow Elementary School, Needham Public Library - Main, Needham Soccer Club, Broadmeadow Park, Needham Community Center |
| Wellesley | Adjacent to Needham, Wellesley offers upscale shopping and dining options. Attractive for those who want to be close to city amenities while enjoying suburban serenity. | Wellesley College, Wellesley Village, Wellesley Town Hall, Lake Waban, The Wellesley Free Library |
| Newton | Newton borders Needham and offers a range of attractions and amenities. It’s popular among travelers looking for easy access to Boston while enjoying a suburban lifestyle. | Newton Centre, Crystal Lake, Newton's Historic District, Mason Rice School, Alison Park |
| Dover | A suburban town known for its green spaces and luxury homes. It's perfect for guests seeking a luxurious countryside experience while still being close to Needham. | Chickering Woods, Dover Farms, Noanet Woodlands, Dover-Sherborn High School, Farm Pond |
| Westwood | A nearby affluent community that offers a charming, suburban feel while being within a short drive of Needham’s attractions. Ideal for business travelers and families alike. | Westwood Town Common, Westwood Public Library, Westwood High School, Westwood Nature Center, Iver Johnson Park |
Understanding Airbnb License Requirements & STR Laws in Needham (2025)
While Needham, Massachusetts, United States currently shows low STR regulations, specific Airbnb license requirements might still exist or change. Always verify the latest short term rental regulations and Airbnb license requirements directly with local government authorities for Needham to ensure full compliance before hosting.
(Source: AirROI data, 2025, finding no licensed listings among those analyzed)
Top Performing Airbnb Properties in Needham (2025)
Benchmark your potential! Explore examples of top-performing Airbnb properties in Needhambased on Trailing Twelve Month (TTM) revenue. Analyze their characteristics, revenue, occupancy rate, and ADR to understand what drives success in this market.
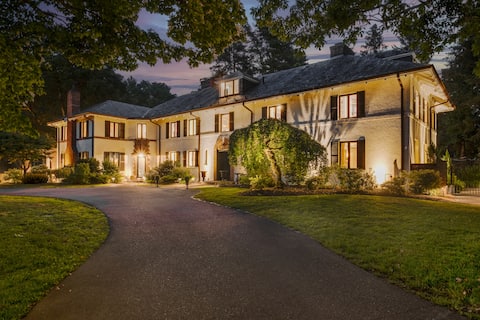
Boston Mansion | Heated Pool | Fire Pit | Tennis
Entire Place • 5 bedrooms
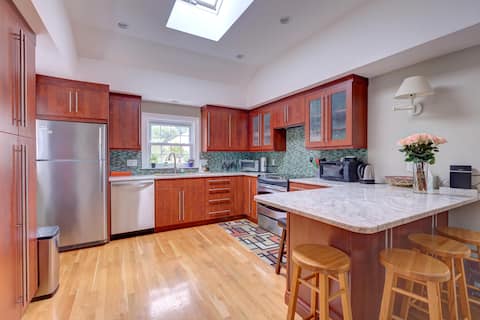
3 bedroom renovated house - close to colleges
Entire Place • 3 bedrooms
Lovely 3/2 - Babson, Olin, Wellesley Colleges
Entire Place • 3 bedrooms
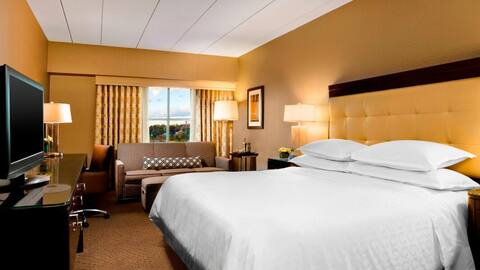
Guest Room One King room at Boston Needham
Entire Place • 1 bedroom
Queen BR, bath & kitchen! Babson/Wellesley/Olin
Private Room • N/A
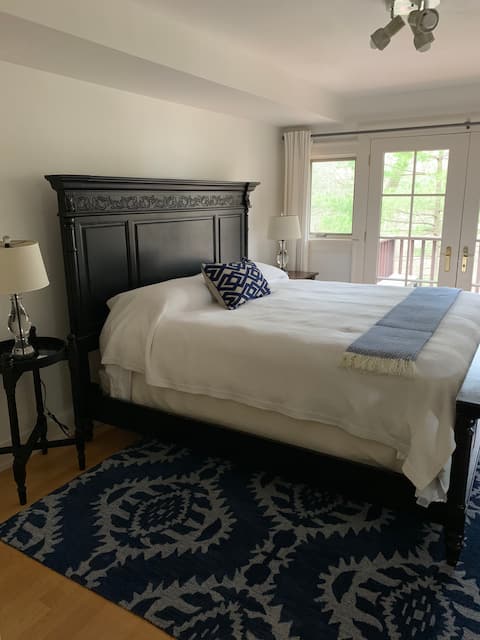
⭐️Master suite full of sun, air and artwork⭐️
Private Room • N/A
Note: Performance varies based on location, size, amenities, seasonality, and management quality. Data reflects the past 12 months.
Top Performing Airbnb Hosts in Needham (2025)
Learn from the best! This table showcases top-performing Airbnb hosts in Needham based on the number of properties managed and estimated total revenue over the past year. Analyze their scale and performance metrics.
| Host Name | Properties | Grossing Revenue | Stay Reviews | Avg Rating |
|---|---|---|---|---|
| Patrick | 1 | $314,188 | 6 | 5.00/5.0 |
| Elena | 1 | $55,014 | 59 | 4.78/5.0 |
| Susan | 1 | $50,228 | 38 | 5.00/5.0 |
| Nancy | 2 | $42,554 | 96 | 4.89/5.0 |
| Sheraton | 2 | $34,731 | 284 | 4.65/5.0 |
| Burhan | 4 | $32,488 | 313 | 4.59/5.0 |
| Marianna | 1 | $23,969 | 505 | 4.93/5.0 |
| Blair | 3 | $15,137 | 70 | 4.75/5.0 |
| Holly | 1 | $8,730 | 13 | 4.54/5.0 |
| Mayra | 1 | $483 | 13 | 4.92/5.0 |
Analyzing the strategies of top hosts, such as their property selection, pricing, and guest communication, can offer valuable lessons for optimizing your own Airbnb operations in Needham.
Dive Deeper: Advanced Needham STR Market Data (2025)
Ready to unlock more insights? AirROI provides access to advanced metrics and comprehensive Airbnb data for Needham. Explore detailed analytics beyond this report to refine your investment strategy, optimize pricing, and maximize your vacation rental profits.
Explore Advanced MetricsNeedham Short-Term Rental Market Composition (2025): Property & Room Types
Room Type Distribution
Property Type Distribution
Market Composition Insights for Needham
- The Needham Airbnb market composition is heavily skewed towards Private Room listings, which make up 64.7% of the 17 active rentals. This indicates strong guest preference for privacy and space.
- Looking at the property type distribution in Needham, House properties are the most common (70.6%), reflecting the local real estate landscape.
- Houses represent a significant 70.6% portion, catering likely to families or larger groups.
- The presence of 5.9% Hotel/Boutique listings indicates integration with traditional hospitality.
Needham Airbnb Room Capacity Analysis (2025): Bedroom Distribution
Distribution of Listings by Number of Bedrooms
Room Capacity Insights for Needham
- The dominant room capacity in Needham is 1 bedroom listings, making up 17.6% of the market. This suggests a strong demand for properties suitable for couples or solo travelers.
- Together, 1 bedroom and 3 bedrooms properties represent 35.2% of the active Airbnb listings in Needham, indicating a high concentration in these sizes.
- A significant 23.5% of listings offer 3+ bedrooms, catering to larger groups and families seeking more space in Needham.
Needham Vacation Rental Guest Capacity Trends (2025)
Distribution of Listings by Guest Capacity
Guest Capacity Insights for Needham
- The most common guest capacity trend in Needham vacation rentals is listings accommodating 4 guests (11.8%). This suggests the primary traveler segment is likely small families or groups.
- Properties designed for 4 guests and 1 guest dominate the Needham STR market, accounting for 17.7% of listings.
- 11.8% of properties accommodate 6+ guests, serving the market segment for larger families or group travel in Needham.
- On average, properties in Needham are equipped to host 1.8 guests.
Needham Airbnb Booking Patterns (2025): Available vs. Booked Days
Available Days Distribution
Booked Days Distribution
Booking Pattern Insights for Needham
- The most common availability pattern in Needham falls within the 271-366 days range, representing 41.2% of listings. This suggests many properties have significant open periods on their calendars.
- Approximately 76.5% of listings show high availability (181+ days open annually), indicating potential for increased bookings or specific owner usage patterns.
- For booked days, the 91-180 days range is most frequent in Needham (41.2%), reflecting common guest stay durations or potential owner blocking patterns.
- A notable 23.5% of properties secure long booking periods (181+ days booked per year), highlighting successful long-term rental strategies or significant owner usage.
Needham Airbnb Minimum Stay Requirements Analysis
Distribution of Listings by Minimum Night Requirement
1 Night
5 listings
29.4% of total
2 Nights
1 listings
5.9% of total
3 Nights
3 listings
17.6% of total
4-6 Nights
1 listings
5.9% of total
7-29 Nights
4 listings
23.5% of total
30+ Nights
3 listings
17.6% of total
Key Insights
- The most prevalent minimum stay requirement in Needham is 1 Night, adopted by 29.4% of listings. This highlights the market's preference for shorter, flexible bookings.
- A significant segment (17.6%) caters to monthly stays (30+ nights) in Needham, pointing to opportunities in the extended-stay market.
Recommendations
- Align with the market by considering a 1 Night minimum stay, as 29.4% of Needham hosts use this setting.
- If feasible, allowing 1-night stays, especially midweek or during low season, could capture last-minute bookings, as only 29.4% currently do.
- Explore offering discounts for stays of 30+ nights to attract the 17.6% of the market seeking extended stays.
- Adjust minimum nights based on seasonality – potentially shorter during low season and longer during peak demand periods in Needham.
Needham Airbnb Cancellation Policy Trends Analysis (2025)
Super Strict 60 Days
1 listings
5.9% of total
Flexible
3 listings
17.6% of total
Moderate
4 listings
23.5% of total
Firm
2 listings
11.8% of total
Strict
7 listings
41.2% of total
Cancellation Policy Insights for Needham
- The prevailing Airbnb cancellation policy trend in Needham is Strict, used by 41.2% of listings.
- A majority (53.0%) of hosts in Needham utilize Firm or Strict policies, indicating a market where hosts prioritize booking security.
Recommendations for Hosts
- Consider adopting a Strict policy to align with the 41.2% market standard in Needham.
- With 41.2% using Strict terms, this is a viable option in Needham, particularly for high-value properties or during peak demand periods.
- Regularly review your cancellation policy against competitors and market demand shifts in Needham.
Needham STR Booking Lead Time Analysis (2025)
Average Booking Lead Time by Month
Booking Lead Time Insights for Needham
- The overall average booking lead time for vacation rentals in Needham is 54 days.
- Guests book furthest in advance for stays during April (average 84 days), likely coinciding with peak travel demand or local events.
- The shortest booking windows occur for stays in November (average 11 days), indicating more last-minute travel plans during this time.
- Seasonally, Spring (67 days avg.) sees the longest lead times, while Fall (29 days avg.) has the shortest, reflecting typical travel planning cycles.
Recommendations for Hosts
- Use the overall average lead time (54 days) as a baseline for your pricing and availability strategy in Needham.
- For April stays, consider implementing length-of-stay discounts or slightly higher rates for bookings made less than 84 days out to capitalize on advance planning.
- During November, focus on last-minute booking availability and promotions, as guests book with very short notice (11 days avg.).
- Target marketing efforts for the Spring season well in advance (at least 67 days) to capture early planners.
- Monitor your own booking lead times against these Needham averages to identify opportunities for dynamic pricing adjustments.
Popular & Essential Airbnb Amenities in Needham (2025)
Amenity Prevalence
Amenity Insights for Needham
- Essential amenities in Needham that guests expect include: Heating, Wifi, Air conditioning. Lacking these (any) could significantly impact bookings.
- Popular amenities like Essentials, Smoke alarm, Free parking on premises are common but not universal. Offering these can provide a competitive edge.
Recommendations for Hosts
- Ensure your listing includes all essential amenities for Needham: Heating, Wifi, Air conditioning.
- Consider adding popular differentiators like Essentials or Smoke alarm to increase appeal.
- Highlight unique or less common amenities you offer (e.g., hot tub, dedicated workspace, EV charger) in your listing description and photos.
- Regularly check competitor amenities in Needham to stay competitive.
Needham Airbnb Guest Demographics & Profile Analysis (2025)
Guest Profile Summary for Needham
- The typical guest profile for Airbnb in Needham consists of primarily domestic travelers (91%), often arriving from nearby Utica, typically belonging to the Post-2000s (Gen Z/Alpha) group (50%), primarily speaking English or Spanish.
- Domestic travelers account for 90.8% of guests.
- Key international markets include United States (90.8%) and Canada (2%).
- Top languages spoken are English (61.4%) followed by Spanish (15.7%).
- A significant demographic segment is the Post-2000s (Gen Z/Alpha) group, representing 50% of guests.
Recommendations for Hosts
- Target domestic marketing efforts towards travelers from Utica and New York.
- Tailor amenities and listing descriptions to appeal to the dominant Post-2000s (Gen Z/Alpha) demographic (e.g., highlight fast WiFi, smart home features, local guides).
- Highlight unique local experiences or amenities relevant to the primary guest profile.
- Consider seasonal promotions aligned with peak travel times for key origin markets.
Nearby Short-Term Rental Market Comparison
How does the Needham Airbnb market stack up against its neighbors? Compare key performance metrics like average monthly revenue, ADR, and occupancy rates in surrounding areas to understand the broader regional STR landscape.
| Market | Active Properties | Monthly Revenue | Daily Rate | Avg. Occupancy |
|---|---|---|---|---|
| Nantucket | 539 | $6,999 | $952.58 | 42% |
| Milford | 11 | $6,343 | $500.10 | 59% |
| Pomfret | 13 | $6,142 | $449.79 | 49% |
| Town of East Hampton | 1,420 | $6,008 | $940.02 | 38% |
| Middletown | 384 | $5,575 | $548.00 | 46% |
| Hanover | 28 | $5,449 | $863.49 | 39% |
| Nahant | 17 | $5,435 | $521.64 | 50% |
| Middleton | 10 | $5,234 | $321.41 | 50% |
| Westminster | 11 | $5,179 | $379.92 | 57% |
| Kennebunkport | 145 | $5,109 | $614.29 | 45% |