Ballenger Creek Airbnb Market Analysis 2025: Short Term Rental Data & Vacation Rental Statistics in Maryland, United States
Is Airbnb profitable in Ballenger Creek in 2025? Explore comprehensive Airbnb analytics for Ballenger Creek, Maryland, United States to uncover income potential. This 2025 STR market report for Ballenger Creek, based on AirROI data from April 2024 to March 2025, reveals key trends in the niche market of 20 active listings.
Whether you're considering an Airbnb investment in Ballenger Creek, optimizing your existing vacation rental, or exploring rental arbitrage opportunities, understanding the Ballenger Creek Airbnb data is crucial. Leveraging the low regulation environment is key to maximizing your short term rental income potential. Let's dive into the specifics.
Key Ballenger Creek Airbnb Performance Metrics Overview
Monthly Airbnb Revenue Variations & Income Potential in Ballenger Creek (2025)
Understanding the monthly revenue variations for Airbnb listings in Ballenger Creek is key to maximizing your short term rental income potential. Seasonality significantly impacts earnings. Our analysis, based on data from the past 12 months, shows that the peak revenue month for STRs in Ballenger Creek is typically June, while January often presents the lowest earnings, highlighting opportunities for strategic pricing adjustments during shoulder and low seasons. Explore the typical Airbnb income in Ballenger Creek across different performance tiers:
- Best-in-class properties (Top 10%) achieve $3,533+ monthly, often utilizing dynamic pricing and superior guest experiences.
- Strong performing properties (Top 25%) earn $2,714 or more, indicating effective management and desirable locations/amenities.
- Typical properties (Median) generate around $1,879 per month, representing the average market performance.
- Entry-level properties (Bottom 25%) see earnings around $1,103, often with potential for optimization.
Average Monthly Airbnb Earnings Trend in Ballenger Creek
Ballenger Creek Airbnb Occupancy Rate Trends (2025)
Maximize your bookings by understanding the Ballenger Creek STR occupancy trends. Seasonal demand shifts significantly influence how often properties are booked. Typically, Decembersees the highest demand (peak season occupancy), while January experiences the lowest (low season). Effective strategies, like adjusting minimum stays or offering promotions, can boost occupancy during slower periods. Here's how different property tiers perform in Ballenger Creek:
- Best-in-class properties (Top 10%) achieve 88%+ occupancy, indicating high desirability and potentially optimized availability.
- Strong performing properties (Top 25%) maintain 70% or higher occupancy, suggesting good market fit and guest satisfaction.
- Typical properties (Median) have an occupancy rate around 46%.
- Entry-level properties (Bottom 25%) average 31% occupancy, potentially facing higher vacancy.
Average Monthly Occupancy Rate Trend in Ballenger Creek
Average Daily Rate (ADR) Airbnb Trends in Ballenger Creek (2025)
Effective short term rental pricing strategy in Ballenger Creek involves understanding monthly ADR fluctuations. The Average Daily Rate (ADR) for Airbnb in Ballenger Creek typically peaks in June and dips lowest during February. Leveraging Airbnb dynamic pricing tools or strategies based on this seasonality can significantly boost revenue. Here's a look at the typical nightly rates achieved:
- Best-in-class properties (Top 10%) command rates of $195+ per night, often due to premium features or locations.
- Strong performing properties (Top 25%) achieve nightly rates of $153 or more.
- Typical properties (Median) charge around $102 per night.
- Entry-level properties (Bottom 25%) earn around $66 per night.
Average Daily Rate (ADR) Trend by Month in Ballenger Creek
Get Live Ballenger Creek Market Intelligence 👇

Explore Real-time Analytics
Airbnb Seasonality Analysis & Trends in Ballenger Creek (2025)
Peak Season (June, July, May)
- Revenue averages $2,578 per month
- Occupancy rates average 54.4%
- Daily rates average $125
Shoulder Season
- Revenue averages $2,063 per month
- Occupancy maintains around 49.4%
- Daily rates hold near $117
Low Season (January, February, March)
- Revenue drops to average $1,497 per month
- Occupancy decreases to average 44.5%
- Daily rates adjust to average $106
Seasonality Insights for Ballenger Creek
- The Airbnb seasonality in Ballenger Creek shows highly seasonal trends requiring careful strategy. While the sections above show seasonal averages, it's also insightful to look at the extremes:
- During the high season, the absolute peak month showcases Ballenger Creek's highest earning potential, with monthly revenues capable of climbing to $2,943, occupancy reaching a high of 59.0%, and ADRs peaking at $127.
- Conversely, the slowest single month of the year, typically falling within the low season, marks the market's lowest point. In this month, revenue might dip to $1,334, occupancy could drop to 34.3%, and ADRs may adjust down to $103.
- Understanding both the seasonal averages and these monthly peaks and troughs in revenue, occupancy, and ADR is crucial for maximizing your Airbnb profit potential in Ballenger Creek.
Seasonal Strategies for Maximizing Profit
- Peak Season: Maximize revenue through premium pricing and potentially longer minimum stays. Ensure high availability.
- Low Season: Offer competitive pricing, special promotions (e.g., extended stay discounts), and flexible cancellation policies. Target off-season travelers like remote workers or budget-conscious guests.
- Shoulder Seasons: Implement dynamic pricing that balances peak and low rates. Target weekend travelers or specific events. Offer slightly more flexible terms than peak season.
- Regularly analyze your own performance against these Ballenger Creek seasonality benchmarks and adjust your pricing and availability strategy accordingly.
Best Areas for Airbnb Investment in Ballenger Creek (2025)
Exploring the top neighborhoods for short-term rentals in Ballenger Creek? This section highlights key areas, outlining why they are attractive for hosts and guests, along with notable local attractions. Consider these locations based on your target guest profile and investment strategy.
| Neighborhood / Area | Why Host Here? (Target Guests & Appeal) | Key Attractions & Landmarks |
|---|---|---|
| Ballenger Creek | A suburban community in Frederick County offering a blend of residential comfort and access to local amenities. It attracts families and business travelers looking for a peaceful stay near urban conveniences. | Ballenger Creek Park, Catoctin Mountain Park, Frederick Fairgrounds, Frederick County Animal Control, Catoctin Wildlife Preserve and Zoo |
| Downtown Frederick | Historic downtown area with a vibrant arts scene, antique shops, and a variety of restaurants. Popular for tourists looking to explore local culture and history. | Carrol Creek Linear Park, Frederick Visitor Center, National Museum of Civil War Medicine, The Fun Sweets Company, Baker Park |
| Woodsboro | Charming small town atmosphere with a close-knit community feel. Ideal for those seeking a quiet retreat with local dining and outdoor activities. | Woodsboro Park, Woodsboro Historical Society, local farms, nature trails |
| Urbana | Family-oriented community with excellent schools and convenient shopping, located conveniently near major highways. Attracts families and professionals alike. | Urbana Regional Library, Urbana District Park, The Greenbrier State Park, local golf courses |
| New Market | Quaint historic town known for its antique shops and local charm. Provides an attractive option for people looking for a relaxing getaway. | New Market Battlefield State Historical Park, local wineries, Maryland Antique Center |
| Brunswick | Located along the scenic Potomac River with outdoor recreational opportunities. Appeals to those interested in nature and historical exploration. | C&O Canal National Historical Park, Brunswick Historic District, local parks |
| Thurmont | Gateway to the Catoctin Mountains, offering outdoor adventures and a charming small-town vibe. Great for nature enthusiasts and peace seekers. | Catoctin Mountain Park, Thurmont Community Park, local hiking trails |
| Hagerstown | A larger city offering a variety of cultural attractions, shopping, and dining options. Perfect for guests seeking urban experiences close to nature. | Washington County Museum of Fine Arts, Hagerstown City Park, local shopping centers |
Understanding Airbnb License Requirements & STR Laws in Ballenger Creek (2025)
While Ballenger Creek, Maryland, United States currently shows low STR regulations, specific Airbnb license requirements might still exist or change. Always verify the latest short term rental regulations and Airbnb license requirements directly with local government authorities for Ballenger Creek to ensure full compliance before hosting.
(Source: AirROI data, 2025, finding no licensed listings among those analyzed)
Top Performing Airbnb Properties in Ballenger Creek (2025)
Benchmark your potential! Explore examples of top-performing Airbnb properties in Ballenger Creekbased on Trailing Twelve Month (TTM) revenue. Analyze their characteristics, revenue, occupancy rate, and ADR to understand what drives success in this market.
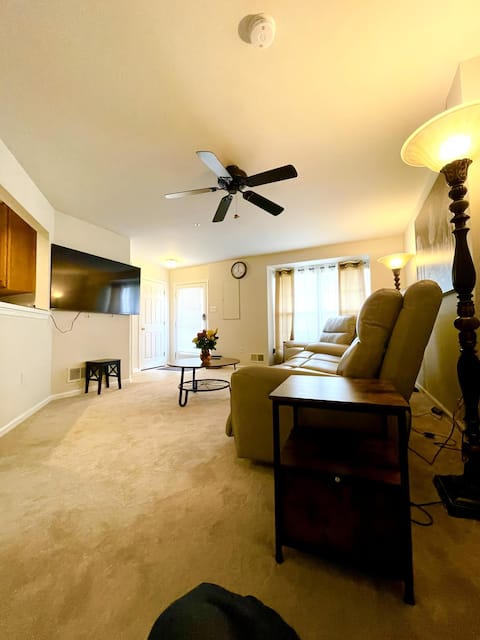
JoSeph's Oasis
Entire Place • 3 bedrooms

Romantic Getaway - Heated Spa Open Year Round
Entire Place • 4 bedrooms

A cozy entire end unit close to all in Frederick
Entire Place • 3 bedrooms
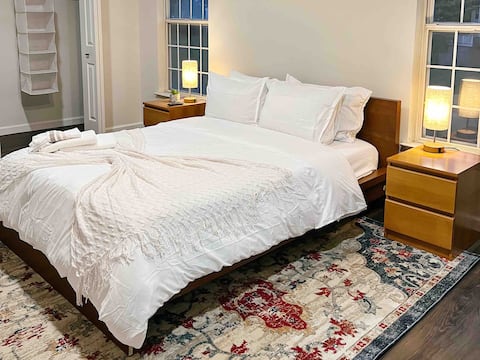
Cozy & Convenient Frederick Townhouse Escape
Entire Place • 2 bedrooms

Cozy 3 bedrooms townhouse
Entire Place • 3 bedrooms
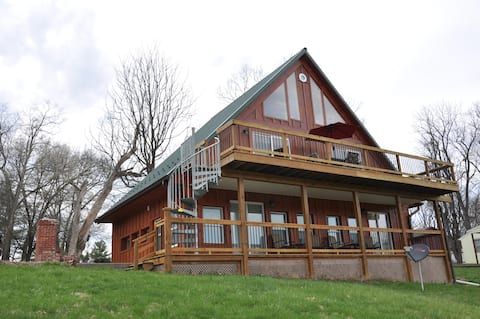
Villa with majestic views of the Monocacy River!
Entire Place • 2 bedrooms
Note: Performance varies based on location, size, amenities, seasonality, and management quality. Data reflects the past 12 months.
Top Performing Airbnb Hosts in Ballenger Creek (2025)
Learn from the best! This table showcases top-performing Airbnb hosts in Ballenger Creek based on the number of properties managed and estimated total revenue over the past year. Analyze their scale and performance metrics.
| Host Name | Properties | Grossing Revenue | Stay Reviews | Avg Rating |
|---|---|---|---|---|
| Joe | 3 | $61,548 | 376 | 4.83/5.0 |
| David | 3 | $52,648 | 196 | 4.89/5.0 |
| Joachim | 1 | $40,041 | 90 | 4.91/5.0 |
| Deborah | 1 | $31,043 | 174 | 4.98/5.0 |
| Jose | 1 | $31,027 | 16 | 4.75/5.0 |
| Allan | 1 | $30,959 | 40 | 4.78/5.0 |
| Monica | 1 | $29,453 | 119 | 4.81/5.0 |
| Omega | 1 | $24,539 | 29 | 4.93/5.0 |
| Becky | 1 | $21,829 | 157 | 4.91/5.0 |
| Ilesh | 1 | $20,171 | 98 | 4.92/5.0 |
Analyzing the strategies of top hosts, such as their property selection, pricing, and guest communication, can offer valuable lessons for optimizing your own Airbnb operations in Ballenger Creek.
Dive Deeper: Advanced Ballenger Creek STR Market Data (2025)
Ready to unlock more insights? AirROI provides access to advanced metrics and comprehensive Airbnb data for Ballenger Creek. Explore detailed analytics beyond this report to refine your investment strategy, optimize pricing, and maximize your vacation rental profits.
Explore Advanced MetricsBallenger Creek Short-Term Rental Market Composition (2025): Property & Room Types
Room Type Distribution
Property Type Distribution
Market Composition Insights for Ballenger Creek
- The Ballenger Creek Airbnb market composition is heavily skewed towards Entire Home/Apt listings, which make up 75% of the 20 active rentals. This indicates strong guest preference for privacy and space.
- Looking at the property type distribution in Ballenger Creek, Apartment/Condo properties are the most common (45%), reflecting the local real estate landscape.
- Houses represent a significant 40% portion, catering likely to families or larger groups.
- The presence of 10% Hotel/Boutique listings indicates integration with traditional hospitality.
Ballenger Creek Airbnb Room Capacity Analysis (2025): Bedroom Distribution
Distribution of Listings by Number of Bedrooms
Room Capacity Insights for Ballenger Creek
- The dominant room capacity in Ballenger Creek is 1 bedroom listings, making up 30% of the market. This suggests a strong demand for properties suitable for couples or solo travelers.
- Together, 1 bedroom and 2 bedrooms properties represent 45.0% of the active Airbnb listings in Ballenger Creek, indicating a high concentration in these sizes.
Ballenger Creek Vacation Rental Guest Capacity Trends (2025)
Distribution of Listings by Guest Capacity
Guest Capacity Insights for Ballenger Creek
- The most common guest capacity trend in Ballenger Creek vacation rentals is listings accommodating 4 guests (30%). This suggests the primary traveler segment is likely small families or groups.
- Properties designed for 4 guests and 2 guests dominate the Ballenger Creek STR market, accounting for 45.0% of listings.
- 20.0% of properties accommodate 6+ guests, serving the market segment for larger families or group travel in Ballenger Creek.
- On average, properties in Ballenger Creek are equipped to host 3.5 guests.
Ballenger Creek Airbnb Booking Patterns (2025): Available vs. Booked Days
Available Days Distribution
Booked Days Distribution
Booking Pattern Insights for Ballenger Creek
- The most common availability pattern in Ballenger Creek falls within the 181-270 days range, representing 40% of listings. This suggests many properties have significant open periods on their calendars.
- Approximately 55.0% of listings show high availability (181+ days open annually), indicating potential for increased bookings or specific owner usage patterns.
- For booked days, the 91-180 days range is most frequent in Ballenger Creek (40%), reflecting common guest stay durations or potential owner blocking patterns.
- A notable 45.0% of properties secure long booking periods (181+ days booked per year), highlighting successful long-term rental strategies or significant owner usage.
Ballenger Creek Airbnb Minimum Stay Requirements Analysis
Distribution of Listings by Minimum Night Requirement
1 Night
5 listings
26.3% of total
2 Nights
9 listings
47.4% of total
3 Nights
3 listings
15.8% of total
7-29 Nights
2 listings
10.5% of total
Key Insights
- The most prevalent minimum stay requirement in Ballenger Creek is 2 Nights, adopted by 47.4% of listings. This highlights the market's preference for shorter, flexible bookings.
- A strong majority (73.7%) of the Ballenger Creek Airbnb data shows acceptance of very short stays (1-2 nights), indicating a dynamic, high-turnover market.
Recommendations
- Align with the market by considering a 2 Nights minimum stay, as 47.4% of Ballenger Creek hosts use this setting.
- If feasible, allowing 1-night stays, especially midweek or during low season, could capture last-minute bookings, as only 26.3% currently do.
- Adjust minimum nights based on seasonality – potentially shorter during low season and longer during peak demand periods in Ballenger Creek.
Ballenger Creek Airbnb Cancellation Policy Trends Analysis (2025)
Flexible
10 listings
50% of total
Moderate
6 listings
30% of total
Firm
2 listings
10% of total
Strict
2 listings
10% of total
Cancellation Policy Insights for Ballenger Creek
- The prevailing Airbnb cancellation policy trend in Ballenger Creek is Flexible, used by 50% of listings.
- The market strongly favors guest-friendly terms, with 80.0% of listings offering Flexible or Moderate policies. This suggests guests in Ballenger Creek may expect booking flexibility.
Recommendations for Hosts
- Consider adopting a Flexible policy to align with the 50% market standard in Ballenger Creek.
- Using a Strict policy might deter some guests, as only 10% of listings use it. Evaluate if potential revenue protection outweighs possible lower booking rates.
- Regularly review your cancellation policy against competitors and market demand shifts in Ballenger Creek.
Ballenger Creek STR Booking Lead Time Analysis (2025)
Average Booking Lead Time by Month
Booking Lead Time Insights for Ballenger Creek
- The overall average booking lead time for vacation rentals in Ballenger Creek is 35 days.
- Guests book furthest in advance for stays during July (average 76 days), likely coinciding with peak travel demand or local events.
- The shortest booking windows occur for stays in February (average 18 days), indicating more last-minute travel plans during this time.
- Seasonally, Summer (61 days avg.) sees the longest lead times, while Winter (35 days avg.) has the shortest, reflecting typical travel planning cycles.
Recommendations for Hosts
- Use the overall average lead time (35 days) as a baseline for your pricing and availability strategy in Ballenger Creek.
- For July stays, consider implementing length-of-stay discounts or slightly higher rates for bookings made less than 76 days out to capitalize on advance planning.
- Target marketing efforts for the Summer season well in advance (at least 61 days) to capture early planners.
- Monitor your own booking lead times against these Ballenger Creek averages to identify opportunities for dynamic pricing adjustments.
Popular & Essential Airbnb Amenities in Ballenger Creek (2025)
Amenity Prevalence
Amenity Insights for Ballenger Creek
- Essential amenities in Ballenger Creek that guests expect include: Air conditioning, Free parking on premises, Wifi, Essentials, Hot water, TV, Iron, Hangers, Smoke alarm, Heating. Lacking these (any) could significantly impact bookings.
Recommendations for Hosts
- Ensure your listing includes all essential amenities for Ballenger Creek: Air conditioning, Free parking on premises, Wifi, Essentials, Hot water, TV, Iron, Hangers, Smoke alarm, Heating.
- Prioritize adding missing essentials: Essentials, Hot water, TV, Iron, Hangers, Smoke alarm, Heating.
- Highlight unique or less common amenities you offer (e.g., hot tub, dedicated workspace, EV charger) in your listing description and photos.
- Regularly check competitor amenities in Ballenger Creek to stay competitive.
Ballenger Creek Airbnb Guest Demographics & Profile Analysis (2025)
Guest Profile Summary for Ballenger Creek
- The typical guest profile for Airbnb in Ballenger Creek consists of primarily domestic travelers (93%), often arriving from nearby Frederick, typically belonging to the Post-2000s (Gen Z/Alpha) group (50%), primarily speaking English or Spanish.
- Domestic travelers account for 92.8% of guests.
- Key international markets include United States (92.8%) and DC (1.7%).
- Top languages spoken are English (66.1%) followed by Spanish (10.1%).
- A significant demographic segment is the Post-2000s (Gen Z/Alpha) group, representing 50% of guests.
Recommendations for Hosts
- Target domestic marketing efforts towards travelers from Frederick and New York.
- Tailor amenities and listing descriptions to appeal to the dominant Post-2000s (Gen Z/Alpha) demographic (e.g., highlight fast WiFi, smart home features, local guides).
- Highlight unique local experiences or amenities relevant to the primary guest profile.
- Consider seasonal promotions aligned with peak travel times for key origin markets.
Nearby Short-Term Rental Market Comparison
How does the Ballenger Creek Airbnb market stack up against its neighbors? Compare key performance metrics like average monthly revenue, ADR, and occupancy rates in surrounding areas to understand the broader regional STR landscape.
| Market | Active Properties | Monthly Revenue | Daily Rate | Avg. Occupancy |
|---|---|---|---|---|
| Lemont | 22 | $8,558 | $812.80 | 42% |
| State College | 158 | $7,525 | $751.34 | 44% |
| Castleton | 10 | $6,255 | $523.55 | 39% |
| Centreville | 15 | $6,205 | $510.77 | 47% |
| Ferguson Township | 120 | $5,810 | $785.97 | 40% |
| Mayo | 13 | $5,786 | $439.15 | 52% |
| College Township | 65 | $5,752 | $809.46 | 40% |
| Stevensville | 70 | $5,476 | $499.46 | 43% |
| West Donegal Township | 13 | $5,399 | $450.85 | 39% |
| Chester | 17 | $5,299 | $437.72 | 43% |