Abbeville Airbnb Market Analysis 2025: Short Term Rental Data & Vacation Rental Statistics in Louisiana, United States
Is Airbnb profitable in Abbeville in 2025? Explore comprehensive Airbnb analytics for Abbeville, Louisiana, United States to uncover income potential. This 2025 STR market report for Abbeville, based on AirROI data from April 2024 to March 2025, reveals key trends in the niche market of 19 active listings.
Whether you're considering an Airbnb investment in Abbeville, optimizing your existing vacation rental, or exploring rental arbitrage opportunities, understanding the Abbeville Airbnb data is crucial. Leveraging the low regulation environment is key to maximizing your short term rental income potential. Let's dive into the specifics.
Key Abbeville Airbnb Performance Metrics Overview
Monthly Airbnb Revenue Variations & Income Potential in Abbeville (2025)
Understanding the monthly revenue variations for Airbnb listings in Abbeville is key to maximizing your short term rental income potential. Seasonality significantly impacts earnings. Our analysis, based on data from the past 12 months, shows that the peak revenue month for STRs in Abbeville is typically June, while September often presents the lowest earnings, highlighting opportunities for strategic pricing adjustments during shoulder and low seasons. Explore the typical Airbnb income in Abbeville across different performance tiers:
- Best-in-class properties (Top 10%) achieve $3,197+ monthly, often utilizing dynamic pricing and superior guest experiences.
- Strong performing properties (Top 25%) earn $2,197 or more, indicating effective management and desirable locations/amenities.
- Typical properties (Median) generate around $1,398 per month, representing the average market performance.
- Entry-level properties (Bottom 25%) see earnings around $618, often with potential for optimization.
Average Monthly Airbnb Earnings Trend in Abbeville
Abbeville Airbnb Occupancy Rate Trends (2025)
Maximize your bookings by understanding the Abbeville STR occupancy trends. Seasonal demand shifts significantly influence how often properties are booked. Typically, Junesees the highest demand (peak season occupancy), while September experiences the lowest (low season). Effective strategies, like adjusting minimum stays or offering promotions, can boost occupancy during slower periods. Here's how different property tiers perform in Abbeville:
- Best-in-class properties (Top 10%) achieve 71%+ occupancy, indicating high desirability and potentially optimized availability.
- Strong performing properties (Top 25%) maintain 49% or higher occupancy, suggesting good market fit and guest satisfaction.
- Typical properties (Median) have an occupancy rate around 29%.
- Entry-level properties (Bottom 25%) average 12% occupancy, potentially facing higher vacancy.
Average Monthly Occupancy Rate Trend in Abbeville
Average Daily Rate (ADR) Airbnb Trends in Abbeville (2025)
Effective short term rental pricing strategy in Abbeville involves understanding monthly ADR fluctuations. The Average Daily Rate (ADR) for Airbnb in Abbeville typically peaks in March and dips lowest during September. Leveraging Airbnb dynamic pricing tools or strategies based on this seasonality can significantly boost revenue. Here's a look at the typical nightly rates achieved:
- Best-in-class properties (Top 10%) command rates of $197+ per night, often due to premium features or locations.
- Strong performing properties (Top 25%) achieve nightly rates of $156 or more.
- Typical properties (Median) charge around $121 per night.
- Entry-level properties (Bottom 25%) earn around $101 per night.
Average Daily Rate (ADR) Trend by Month in Abbeville
Get Live Abbeville Market Intelligence 👇

Explore Real-time Analytics
Airbnb Seasonality Analysis & Trends in Abbeville (2025)
Peak Season (June, December, April)
- Revenue averages $1,984 per month
- Occupancy rates average 36.8%
- Daily rates average $154
Shoulder Season
- Revenue averages $1,618 per month
- Occupancy maintains around 33.1%
- Daily rates hold near $155
Low Season (August, September, October)
- Revenue drops to average $1,151 per month
- Occupancy decreases to average 28.1%
- Daily rates adjust to average $152
Seasonality Insights for Abbeville
- The Airbnb seasonality in Abbeville shows highly seasonal trends requiring careful strategy. While the sections above show seasonal averages, it's also insightful to look at the extremes:
- During the high season, the absolute peak month showcases Abbeville's highest earning potential, with monthly revenues capable of climbing to $2,078, occupancy reaching a high of 43.8%, and ADRs peaking at $157.
- Conversely, the slowest single month of the year, typically falling within the low season, marks the market's lowest point. In this month, revenue might dip to $891, occupancy could drop to 24.9%, and ADRs may adjust down to $151.
- Understanding both the seasonal averages and these monthly peaks and troughs in revenue, occupancy, and ADR is crucial for maximizing your Airbnb profit potential in Abbeville.
Seasonal Strategies for Maximizing Profit
- Peak Season: Maximize revenue through premium pricing and potentially longer minimum stays. Ensure high availability.
- Low Season: Offer competitive pricing, special promotions (e.g., extended stay discounts), and flexible cancellation policies. Target off-season travelers like remote workers or budget-conscious guests.
- Shoulder Seasons: Implement dynamic pricing that balances peak and low rates. Target weekend travelers or specific events. Offer slightly more flexible terms than peak season.
- Regularly analyze your own performance against these Abbeville seasonality benchmarks and adjust your pricing and availability strategy accordingly.
Best Areas for Airbnb Investment in Abbeville (2025)
Exploring the top neighborhoods for short-term rentals in Abbeville? This section highlights key areas, outlining why they are attractive for hosts and guests, along with notable local attractions. Consider these locations based on your target guest profile and investment strategy.
| Neighborhood / Area | Why Host Here? (Target Guests & Appeal) | Key Attractions & Landmarks |
|---|---|---|
| Historic District | Charming area with beautiful antebellum architecture and rich history. It's perfect for tourists looking to explore the culture of Louisiana with numerous historic homes and museums. | Abbeville Historic District, Vermilionville Historic Village, Abbeville Cultural and Historical Alliance, St. Mary Magdalen Church, Abbeville Antique District |
| Downtown Abbeville | The vibrant center of the city with shops, restaurants, and entertainment. A great place for visitors wanting to experience local cuisine and culture. Easy access to events and festivals. | The Abbey Theatre, Abbeville Farmers Market, Local restaurants like Cafe 8, Festivals like the Giant Omelette Celebration, Museum of the Acadian Culture |
| Coteau | A quiet, scenic area close to nature, ideal for families and individuals who enjoy outdoor activities and relaxation. Offers a more rural, peaceful environment away from city hustle. | Lake Abby, Parks for fishing and boating, Nature trails, Local wildlife sightings, Nearby countryside excursions |
| Vermilion Parish | Exploring the beautiful Cajun country filled with rich food culture and outdoor activities, it's perfect for those wanting an authentic Louisiana experience. | Cajun Coast, Lake Sabine, Fishing and boating opportunities, Historical landmarks, Cajun food festivals |
| Abbeville City Park | A family-friendly area with playgrounds and recreational activities, perfect for guests traveling with children or looking for outdoor leisure activities. | Playgrounds, Picnic areas, Walking trails, Community events, Local wildlife observation |
| Rural Farm Areas | Offering a unique farm stay experience, guests can learn about agriculture and enjoy the scenic countryside. Great for visitors looking for a break from city life. | Local farms, Agritourism experiences, Farmers markets, Rural landscapes, Cultural farm experiences |
| Local Wineries and Breweries | Growing area for wine and craft beer enthusiasts, offering tastings and tours. Attracts visitors interested in the local beverage scene. | Local wineries, Craft breweries tours, Wine tasting events, Brewing workshops, Cultural tasting experiences |
| Spooner Park | A recreational area with sports facilities and playgrounds, popular with families and groups looking for outdoor activities and gatherings. | Football fields, Tennis courts, Walking paths, Community sports events, Play areas |
Understanding Airbnb License Requirements & STR Laws in Abbeville (2025)
While Abbeville, Louisiana, United States currently shows low STR regulations, specific Airbnb license requirements might still exist or change. Always verify the latest short term rental regulations and Airbnb license requirements directly with local government authorities for Abbeville to ensure full compliance before hosting.
(Source: AirROI data, 2025, finding no licensed listings among those analyzed)
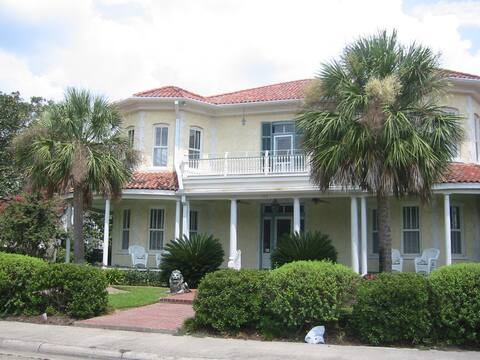
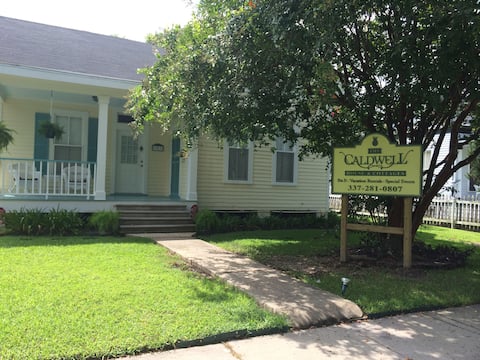
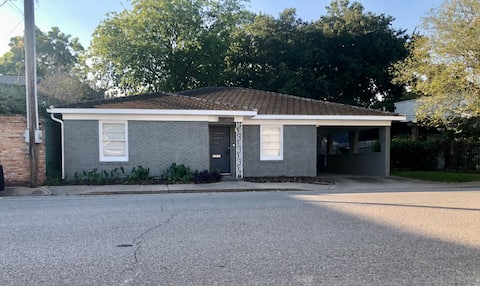
Top Performing Airbnb Properties in Abbeville (2025)
Benchmark your potential! Explore examples of top-performing Airbnb properties in Abbevillebased on Trailing Twelve Month (TTM) revenue. Analyze their characteristics, revenue, occupancy rate, and ADR to understand what drives success in this market.
Caldwell Whole House Villa sleeps 12
Entire Place • 6 bedrooms

Amy’s Poolside Retreat
Entire Place • 1 bedroom

City Walk + Wedding Haven
Entire Place • 3 bedrooms
2BR, 2Bth Caldwell Cottage sleeps 6
Entire Place • 2 bedrooms
Boudreaux Townhouse
Entire Place • 2 bedrooms

Camping if you don’t have an RV!
Entire Place • 1 bedroom
Note: Performance varies based on location, size, amenities, seasonality, and management quality. Data reflects the past 12 months.
Top Performing Airbnb Hosts in Abbeville (2025)
Learn from the best! This table showcases top-performing Airbnb hosts in Abbeville based on the number of properties managed and estimated total revenue over the past year. Analyze their scale and performance metrics.
| Host Name | Properties | Grossing Revenue | Stay Reviews | Avg Rating |
|---|---|---|---|---|
| Darlene | 2 | $54,083 | 133 | 4.79/5.0 |
| Amy | 1 | $28,118 | 132 | 4.93/5.0 |
| Lodgeful | 1 | $24,181 | 19 | 4.68/5.0 |
| Camille | 1 | $21,355 | 89 | 4.93/5.0 |
| Claire | 1 | $21,156 | 11 | 5.00/5.0 |
| Janice | 1 | $19,183 | 91 | 4.99/5.0 |
| Marci | 1 | $17,297 | 24 | 4.92/5.0 |
| Suzanne | 1 | $17,003 | 112 | 4.95/5.0 |
| Ruby | 5 | $15,867 | 45 | 3.98/5.0 |
| Debbie | 1 | $11,058 | 14 | 5.00/5.0 |
Analyzing the strategies of top hosts, such as their property selection, pricing, and guest communication, can offer valuable lessons for optimizing your own Airbnb operations in Abbeville.
Dive Deeper: Advanced Abbeville STR Market Data (2025)
Ready to unlock more insights? AirROI provides access to advanced metrics and comprehensive Airbnb data for Abbeville. Explore detailed analytics beyond this report to refine your investment strategy, optimize pricing, and maximize your vacation rental profits.
Explore Advanced MetricsAbbeville Short-Term Rental Market Composition (2025): Property & Room Types
Room Type Distribution
Property Type Distribution
Market Composition Insights for Abbeville
- The Abbeville Airbnb market composition is heavily skewed towards Entire Home/Apt listings, which make up 68.4% of the 19 active rentals. This indicates strong guest preference for privacy and space.
- However, a notable 31.6% share for Private Rooms suggests opportunities for budget-conscious travelers or hosts renting out spare rooms.
- Looking at the property type distribution in Abbeville, House properties are the most common (52.6%), reflecting the local real estate landscape.
- Houses represent a significant 52.6% portion, catering likely to families or larger groups.
- The presence of 31.6% Hotel/Boutique listings indicates integration with traditional hospitality.
Abbeville Airbnb Room Capacity Analysis (2025): Bedroom Distribution
Distribution of Listings by Number of Bedrooms
Room Capacity Insights for Abbeville
- The dominant room capacity in Abbeville is 1 bedroom listings, making up 36.8% of the market. This suggests a strong demand for properties suitable for couples or solo travelers.
- Together, 1 bedroom and 2 bedrooms properties represent 68.4% of the active Airbnb listings in Abbeville, indicating a high concentration in these sizes.
Abbeville Vacation Rental Guest Capacity Trends (2025)
Distribution of Listings by Guest Capacity
Guest Capacity Insights for Abbeville
- The most common guest capacity trend in Abbeville vacation rentals is listings accommodating 4 guests (21.1%). This suggests the primary traveler segment is likely small families or groups.
- Properties designed for 4 guests and 6 guests dominate the Abbeville STR market, accounting for 42.2% of listings.
- 31.6% of properties accommodate 6+ guests, serving the market segment for larger families or group travel in Abbeville.
- On average, properties in Abbeville are equipped to host 3.8 guests.
Abbeville Airbnb Booking Patterns (2025): Available vs. Booked Days
Available Days Distribution
Booked Days Distribution
Booking Pattern Insights for Abbeville
- The most common availability pattern in Abbeville falls within the 271-366 days range, representing 52.6% of listings. This suggests many properties have significant open periods on their calendars.
- Approximately 78.9% of listings show high availability (181+ days open annually), indicating potential for increased bookings or specific owner usage patterns.
- For booked days, the 91-180 days range is most frequent in Abbeville (31.6%), reflecting common guest stay durations or potential owner blocking patterns.
- A notable 21.1% of properties secure long booking periods (181+ days booked per year), highlighting successful long-term rental strategies or significant owner usage.
Abbeville Airbnb Minimum Stay Requirements Analysis
Distribution of Listings by Minimum Night Requirement
1 Night
9 listings
50% of total
2 Nights
7 listings
38.9% of total
30+ Nights
2 listings
11.1% of total
Key Insights
- The most prevalent minimum stay requirement in Abbeville is 1 Night, adopted by 50% of listings. This highlights the market's preference for shorter, flexible bookings.
- A strong majority (88.9%) of the Abbeville Airbnb data shows acceptance of very short stays (1-2 nights), indicating a dynamic, high-turnover market.
- A significant segment (11.1%) caters to monthly stays (30+ nights) in Abbeville, pointing to opportunities in the extended-stay market.
Recommendations
- Align with the market by considering a 1 Night minimum stay, as 50% of Abbeville hosts use this setting.
- Explore offering discounts for stays of 30+ nights to attract the 11.1% of the market seeking extended stays.
- Adjust minimum nights based on seasonality – potentially shorter during low season and longer during peak demand periods in Abbeville.
Abbeville Airbnb Cancellation Policy Trends Analysis (2025)
Flexible
2 listings
12.5% of total
Moderate
6 listings
37.5% of total
Firm
5 listings
31.3% of total
Strict
3 listings
18.8% of total
Cancellation Policy Insights for Abbeville
- The prevailing Airbnb cancellation policy trend in Abbeville is Moderate, used by 37.5% of listings.
- A majority (50.1%) of hosts in Abbeville utilize Firm or Strict policies, indicating a market where hosts prioritize booking security.
Recommendations for Hosts
- Consider adopting a Moderate policy to align with the 37.5% market standard in Abbeville.
- Regularly review your cancellation policy against competitors and market demand shifts in Abbeville.
Abbeville STR Booking Lead Time Analysis (2025)
Average Booking Lead Time by Month
Booking Lead Time Insights for Abbeville
- The overall average booking lead time for vacation rentals in Abbeville is 44 days.
- Guests book furthest in advance for stays during December (average 73 days), likely coinciding with peak travel demand or local events.
- The shortest booking windows occur for stays in August (average 22 days), indicating more last-minute travel plans during this time.
- Seasonally, Fall (65 days avg.) sees the longest lead times, while Summer (33 days avg.) has the shortest, reflecting typical travel planning cycles.
Recommendations for Hosts
- Use the overall average lead time (44 days) as a baseline for your pricing and availability strategy in Abbeville.
- For December stays, consider implementing length-of-stay discounts or slightly higher rates for bookings made less than 73 days out to capitalize on advance planning.
- Target marketing efforts for the Fall season well in advance (at least 65 days) to capture early planners.
- Monitor your own booking lead times against these Abbeville averages to identify opportunities for dynamic pricing adjustments.
Popular & Essential Airbnb Amenities in Abbeville (2025)
Amenity Prevalence
Amenity Insights for Abbeville
- Essential amenities in Abbeville that guests expect include: Wifi, TV, Air conditioning. Lacking these (any) could significantly impact bookings.
- Popular amenities like Kitchen, Free parking on premises, Heating are common but not universal. Offering these can provide a competitive edge.
Recommendations for Hosts
- Ensure your listing includes all essential amenities for Abbeville: Wifi, TV, Air conditioning.
- Consider adding popular differentiators like Kitchen or Free parking on premises to increase appeal.
- Highlight unique or less common amenities you offer (e.g., hot tub, dedicated workspace, EV charger) in your listing description and photos.
- Regularly check competitor amenities in Abbeville to stay competitive.
Abbeville Airbnb Guest Demographics & Profile Analysis (2025)
Guest Profile Summary for Abbeville
- The typical guest profile for Airbnb in Abbeville consists of primarily domestic travelers (96%), often arriving from nearby New Orleans, typically belonging to the Post-2000s (Gen Z/Alpha) group (50%), primarily speaking English or Spanish.
- Domestic travelers account for 96.0% of guests.
- Key international markets include United States (96%) and Germany (1%).
- Top languages spoken are English (69.6%) followed by Spanish (16.1%).
- A significant demographic segment is the Post-2000s (Gen Z/Alpha) group, representing 50% of guests.
Recommendations for Hosts
- Target domestic marketing efforts towards travelers from New Orleans and Peachtree City.
- Tailor amenities and listing descriptions to appeal to the dominant Post-2000s (Gen Z/Alpha) demographic (e.g., highlight fast WiFi, smart home features, local guides).
- Highlight unique local experiences or amenities relevant to the primary guest profile.
- Consider seasonal promotions aligned with peak travel times for key origin markets.
Nearby Short-Term Rental Market Comparison
How does the Abbeville Airbnb market stack up against its neighbors? Compare key performance metrics like average monthly revenue, ADR, and occupancy rates in surrounding areas to understand the broader regional STR landscape.
| Market | Active Properties | Monthly Revenue | Daily Rate | Avg. Occupancy |
|---|---|---|---|---|
| New Roads | 29 | $3,314 | $319.35 | 34% |
| Hackberry | 27 | $2,641 | $306.17 | 31% |
| Youngsville | 24 | $2,607 | $155.87 | 50% |
| Broussard | 10 | $2,224 | $159.07 | 42% |
| Saint Francisville | 18 | $2,157 | $249.33 | 34% |
| Cameron | 37 | $2,137 | $220.47 | 35% |
| St. George | 61 | $2,045 | $202.32 | 41% |
| Baton Rouge | 562 | $1,851 | $174.17 | 41% |
| Ville Platte | 10 | $1,796 | $174.29 | 34% |
| Morgan City | 10 | $1,776 | $170.64 | 38% |