Roeland Park Airbnb Market Analysis 2025: Short Term Rental Data & Vacation Rental Statistics in Kansas, United States
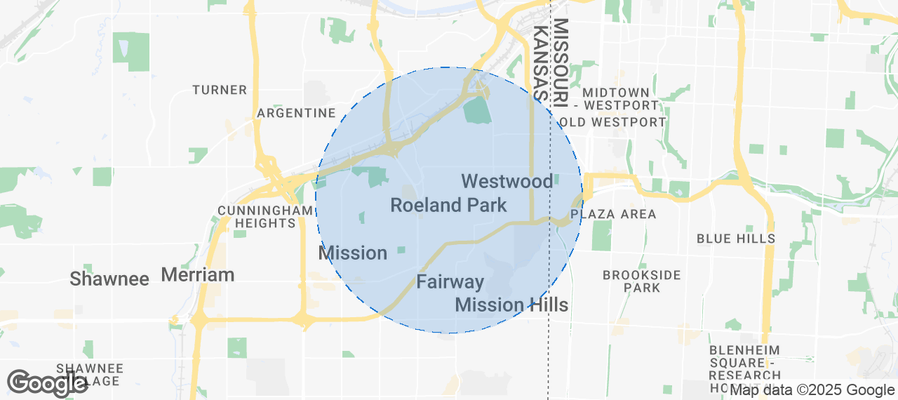
Is Airbnb profitable in Roeland Park in 2025? Explore comprehensive Airbnb analytics for Roeland Park, Kansas, United States to uncover income potential. This 2025 STR market report for Roeland Park, based on AirROI data from June 2024 to May 2025, reveals key trends in the niche market of 20 active listings.
Whether you're considering an Airbnb investment in Roeland Park, optimizing your existing vacation rental, or exploring rental arbitrage opportunities, understanding the Roeland Park Airbnb data is crucial. Understanding the local regulations is key to maximizing your short term rental income potential. Let's dive into the specifics.
Key Roeland Park Airbnb Performance Metrics Overview
Monthly Airbnb Revenue Variations & Income Potential in Roeland Park (2025)
Understanding the monthly revenue variations for Airbnb listings in Roeland Park is key to maximizing your short term rental income potential. Seasonality significantly impacts earnings. Our analysis, based on data from the past 12 months, shows that the peak revenue month for STRs in Roeland Park is typically May, while January often presents the lowest earnings, highlighting opportunities for strategic pricing adjustments during shoulder and low seasons. Explore the typical Airbnb income in Roeland Park across different performance tiers:
- Best-in-class properties (Top 10%) achieve $3,950+ monthly, often utilizing dynamic pricing and superior guest experiences.
- Strong performing properties (Top 25%) earn $3,304 or more, indicating effective management and desirable locations/amenities.
- Typical properties (Median) generate around $1,872 per month, representing the average market performance.
- Entry-level properties (Bottom 25%) see earnings around $1,264, often with potential for optimization.
Average Monthly Airbnb Earnings Trend in Roeland Park
Roeland Park Airbnb Occupancy Rate Trends (2025)
Maximize your bookings by understanding the Roeland Park STR occupancy trends. Seasonal demand shifts significantly influence how often properties are booked. Typically, Octobersees the highest demand (peak season occupancy), while January experiences the lowest (low season). Effective strategies, like adjusting minimum stays or offering promotions, can boost occupancy during slower periods. Here's how different property tiers perform in Roeland Park:
- Best-in-class properties (Top 10%) achieve 82%+ occupancy, indicating high desirability and potentially optimized availability.
- Strong performing properties (Top 25%) maintain 74% or higher occupancy, suggesting good market fit and guest satisfaction.
- Typical properties (Median) have an occupancy rate around 45%.
- Entry-level properties (Bottom 25%) average 33% occupancy, potentially facing higher vacancy.
Average Monthly Occupancy Rate Trend in Roeland Park
Average Daily Rate (ADR) Airbnb Trends in Roeland Park (2025)
Effective short term rental pricing strategy in Roeland Park involves understanding monthly ADR fluctuations. The Average Daily Rate (ADR) for Airbnb in Roeland Park typically peaks in May and dips lowest during November. Leveraging Airbnb dynamic pricing tools or strategies based on this seasonality can significantly boost revenue. Here's a look at the typical nightly rates achieved:
- Best-in-class properties (Top 10%) command rates of $264+ per night, often due to premium features or locations.
- Strong performing properties (Top 25%) achieve nightly rates of $168 or more.
- Typical properties (Median) charge around $135 per night.
- Entry-level properties (Bottom 25%) earn around $101 per night.
Average Daily Rate (ADR) Trend by Month in Roeland Park
Get Live Roeland Park Market Intelligence 👇
Explore Real-time Analytics
Airbnb Seasonality Analysis & Trends in Roeland Park (2025)
Peak Season (May, April, October)
- Revenue averages $2,968 per month
- Occupancy rates average 57.3%
- Daily rates average $159
Shoulder Season
- Revenue averages $2,477 per month
- Occupancy maintains around 55.6%
- Daily rates hold near $139
Low Season (January, February, September)
- Revenue drops to average $1,573 per month
- Occupancy decreases to average 39.3%
- Daily rates adjust to average $150
Seasonality Insights for Roeland Park
- The Airbnb seasonality in Roeland Park shows highly seasonal trends requiring careful strategy. While the sections above show seasonal averages, it's also insightful to look at the extremes:
- During the high season, the absolute peak month showcases Roeland Park's highest earning potential, with monthly revenues capable of climbing to $3,121, occupancy reaching a high of 68.2%, and ADRs peaking at $176.
- Conversely, the slowest single month of the year, typically falling within the low season, marks the market's lowest point. In this month, revenue might dip to $1,034, occupancy could drop to 23.9%, and ADRs may adjust down to $132.
- Understanding both the seasonal averages and these monthly peaks and troughs in revenue, occupancy, and ADR is crucial for maximizing your Airbnb profit potential in Roeland Park.
Seasonal Strategies for Maximizing Profit
- Peak Season: Maximize revenue through premium pricing and potentially longer minimum stays. Ensure high availability.
- Low Season: Offer competitive pricing, special promotions (e.g., extended stay discounts), and flexible cancellation policies. Target off-season travelers like remote workers or budget-conscious guests.
- Shoulder Seasons: Implement dynamic pricing that balances peak and low rates. Target weekend travelers or specific events. Offer slightly more flexible terms than peak season.
- Regularly analyze your own performance against these Roeland Park seasonality benchmarks and adjust your pricing and availability strategy accordingly.
Best Areas for Airbnb Investment in Roeland Park (2025)
Exploring the top neighborhoods for short-term rentals in Roeland Park? This section highlights key areas, outlining why they are attractive for hosts and guests, along with notable local attractions. Consider these locations based on your target guest profile and investment strategy.
| Neighborhood / Area | Why Host Here? (Target Guests & Appeal) | Key Attractions & Landmarks |
|---|---|---|
| Roeland Park Central | This area is known for its proximity to local parks and community centers. It's a family-friendly neighborhood that attracts visitors looking for a quieter stay while still being close to the urban amenities of Kansas City. | Roeland Park Community Center, Nall Park, Roeland Park Aquatic Center, Local cafes and restaurants, Nearby Johnson County Library |
| South Roeland Park | Home to several parks and recreation areas, South Roeland Park offers a peaceful atmosphere and is ideal for nature lovers and families seeking relaxation. | Meadowlark Park, Pinecrest Park, Shopping areas, Walking trails, Local dining spots |
| North Roeland Park | Offering easy access to major highways and proximity to downtown Kansas City, North Roeland Park is ideal for business travelers and those wanting to explore the greater Kansas City area. | Roeland Park Plaza, Major highway access, Various restaurants and shopping centers, Art culture in surrounding areas |
| Westwood | Adjacent to Roeland Park, Westwood is a vibrant community known for its charming houses and local businesses, attracting visitors interested in local culture and history. | Westwood Park, Local boutiques, Art galleries, Westwood City Hall, Dining options |
| Mission | Nearby Mission is a bustling area with a variety of restaurants, shopping centers, and recreational options. A popular spot for visitors who want to explore the surrounding suburban areas. | Mission Shopping Center, Local eateries and coffee shops, Outdoor parks, Community events |
| Fairway | Fairway's residential charm and convenient access to shopping make it a desirable location for visitors looking for a suburban experience while being close to urban attractions. | Fairway Park, Shopping centers, Dining options, Nearby golf courses |
| Prairie Village | Known for its beautiful homes and well-maintained parks, Prairie Village attracts visitors who appreciate a quaint suburban atmosphere mixed with cultural offerings. | Prairie Village Shopping Center, Various parks, Local art fairs, Dining and entertainment opportunities |
| Overland Park | While slightly farther away, Overland Park is a major suburb of Kansas City with a wealth of attractions, making it a popular choice for those wanting amenities and activities beyond Roeland Park. | Overland Park Arboretum and Botanical Gardens, Shopping malls, Cultural events, Local breweries and dining options |
Understanding Airbnb License Requirements & STR Laws in Roeland Park (2025)
With 25% of listings showing registration in 2025, understanding potential Airbnb license requirements is crucial in Roeland Park. Always verify the latest short term rental regulations and Airbnb license requirements directly with local government authorities for Roeland Park to ensure full compliance before hosting.
(Source: AirROI data, 2025, based on 25% licensed listings)
Top Performing Airbnb Properties in Roeland Park (2025)
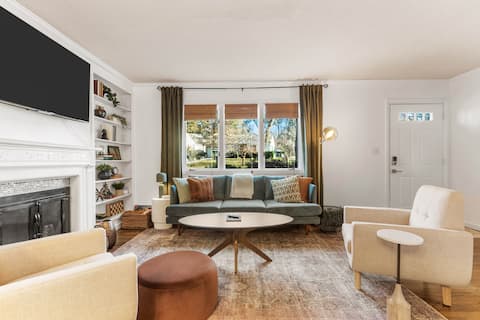
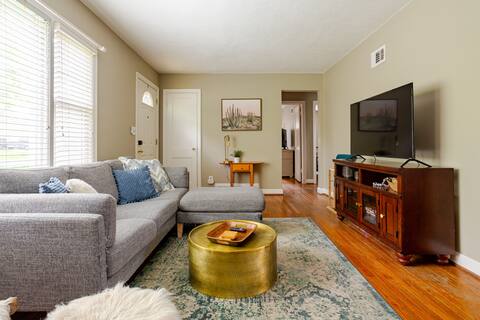
Benchmark your potential! Explore examples of top-performing Airbnb properties in Roeland Parkbased on Trailing Twelve Month (TTM) revenue. Analyze their characteristics, revenue, occupancy rate, and ADR to understand what drives success in this market.
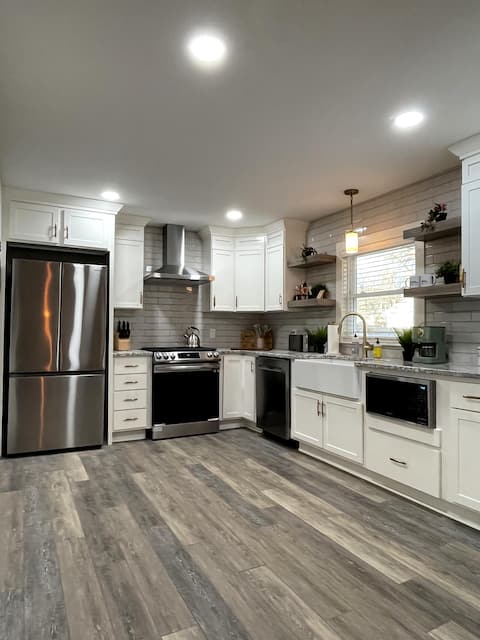
Freshly-remodeled, dog-friendly Westwood charmer!
Entire Place • 3 bedrooms
Adorable Roeland Park Ranch + Pet Friendly!
Entire Place • 2 bedrooms
Cute home, 5mi to downtown & 2mi to plaza!
Entire Place • 2 bedrooms

Cozy home, great for families and friends
Entire Place • 5 bedrooms
Inviting and Centrally Located Home in Kansas City
Entire Place • 3 bedrooms

Be At Home in KC
Entire Place • 3 bedrooms
Note: Performance varies based on location, size, amenities, seasonality, and management quality. Data reflects the past 12 months.
Top Performing Airbnb Hosts in Roeland Park (2025)
Learn from the best! This table showcases top-performing Airbnb hosts in Roeland Park based on the number of properties managed and estimated total revenue over the past year. Analyze their scale and performance metrics.
| Host Name | Properties | Grossing Revenue | Stay Reviews | Avg Rating |
|---|---|---|---|---|
| Lindsey | 4 | $68,065 | 236 | 4.93/5.0 |
| Lucas | 3 | $61,916 | 261 | 4.88/5.0 |
| Eric | 1 | $57,197 | 66 | 4.97/5.0 |
| Kristen | 1 | $44,201 | 91 | 4.91/5.0 |
| Maria | 1 | $38,219 | 84 | 4.85/5.0 |
| Melissa | 1 | $37,269 | 300 | 4.89/5.0 |
| Katie | 1 | $16,200 | 78 | 4.85/5.0 |
| Host #99283561 | 1 | $14,234 | 57 | 4.91/5.0 |
| Justin | 1 | $9,651 | 60 | 4.82/5.0 |
| Host #276833192 | 1 | $7,361 | 5 | 5.00/5.0 |
Analyzing the strategies of top hosts, such as their property selection, pricing, and guest communication, can offer valuable lessons for optimizing your own Airbnb operations in Roeland Park.
Dive Deeper: Advanced Roeland Park STR Market Data (2025)
Ready to unlock more insights? AirROI provides access to advanced metrics and comprehensive Airbnb data for Roeland Park. Explore detailed analytics beyond this report to refine your investment strategy, optimize pricing, and maximize your vacation rental profits.
Explore Advanced MetricsRoeland Park Short-Term Rental Market Composition (2025): Property & Room Types
Room Type Distribution
Property Type Distribution
Market Composition Insights for Roeland Park
- The Roeland Park Airbnb market composition is heavily skewed towards Entire Home/Apt listings, which make up 90% of the 20 active rentals. This indicates strong guest preference for privacy and space.
- Looking at the property type distribution in Roeland Park, House properties are the most common (95%), reflecting the local real estate landscape.
- Houses represent a significant 95% portion, catering likely to families or larger groups.
Roeland Park Airbnb Room Capacity Analysis (2025): Bedroom Distribution
Distribution of Listings by Number of Bedrooms
Room Capacity Insights for Roeland Park
- The dominant room capacity in Roeland Park is 2 bedrooms listings, making up 40% of the market. This suggests a strong demand for properties suitable for couples or solo travelers.
- Together, 2 bedrooms and 3 bedrooms properties represent 65.0% of the active Airbnb listings in Roeland Park, indicating a high concentration in these sizes.
- A significant 35.0% of listings offer 3+ bedrooms, catering to larger groups and families seeking more space in Roeland Park.
Roeland Park Vacation Rental Guest Capacity Trends (2025)
Distribution of Listings by Guest Capacity
Guest Capacity Insights for Roeland Park
- The most common guest capacity trend in Roeland Park vacation rentals is listings accommodating 4 guests (40%). This suggests the primary traveler segment is likely small families or groups.
- Properties designed for 4 guests and 6 guests dominate the Roeland Park STR market, accounting for 60.0% of listings.
- 35.0% of properties accommodate 6+ guests, serving the market segment for larger families or group travel in Roeland Park.
- On average, properties in Roeland Park are equipped to host 4.3 guests.
Roeland Park Airbnb Booking Patterns (2025): Available vs. Booked Days
Available Days Distribution
Booked Days Distribution
Booking Pattern Insights for Roeland Park
- The most common availability pattern in Roeland Park falls within the 271-366 days range, representing 40% of listings. This suggests many properties have significant open periods on their calendars.
- Approximately 70.0% of listings show high availability (181+ days open annually), indicating potential for increased bookings or specific owner usage patterns.
- For booked days, the 91-180 days range is most frequent in Roeland Park (30%), reflecting common guest stay durations or potential owner blocking patterns.
- A notable 30.0% of properties secure long booking periods (181+ days booked per year), highlighting successful long-term rental strategies or significant owner usage.
Roeland Park Airbnb Minimum Stay Requirements Analysis
Distribution of Listings by Minimum Night Requirement
1 Night
3 listings
17.6% of total
2 Nights
3 listings
17.6% of total
7-29 Nights
3 listings
17.6% of total
30+ Nights
8 listings
47.1% of total
Key Insights
- The most prevalent minimum stay requirement in Roeland Park is 30+ Nights, adopted by 47.1% of listings. This highlights the market's preference for longer commitments.
- A significant segment (47.1%) caters to monthly stays (30+ nights) in Roeland Park, pointing to opportunities in the extended-stay market.
Recommendations
- Align with the market by considering a 30+ Nights minimum stay, as 47.1% of Roeland Park hosts use this setting.
- If feasible, allowing 1-night stays, especially midweek or during low season, could capture last-minute bookings, as only 17.6% currently do.
- Explore offering discounts for stays of 30+ nights to attract the 47.1% of the market seeking extended stays.
- Adjust minimum nights based on seasonality – potentially shorter during low season and longer during peak demand periods in Roeland Park.
Roeland Park Airbnb Cancellation Policy Trends Analysis (2025)
Flexible
4 listings
23.5% of total
Moderate
1 listings
5.9% of total
Firm
6 listings
35.3% of total
Strict
6 listings
35.3% of total
Cancellation Policy Insights for Roeland Park
- The prevailing Airbnb cancellation policy trend in Roeland Park is Firm, used by 35.3% of listings.
- A majority (70.6%) of hosts in Roeland Park utilize Firm or Strict policies, indicating a market where hosts prioritize booking security.
Recommendations for Hosts
- Consider adopting a Firm policy to align with the 35.3% market standard in Roeland Park.
- With 35.3% using Strict terms, this is a viable option in Roeland Park, particularly for high-value properties or during peak demand periods.
- Regularly review your cancellation policy against competitors and market demand shifts in Roeland Park.
Roeland Park STR Booking Lead Time Analysis (2025)
Average Booking Lead Time by Month
Booking Lead Time Insights for Roeland Park
- The overall average booking lead time for vacation rentals in Roeland Park is 43 days.
- Guests book furthest in advance for stays during June (average 55 days), likely coinciding with peak travel demand or local events.
- The shortest booking windows occur for stays in February (average 11 days), indicating more last-minute travel plans during this time.
- Seasonally, Summer (46 days avg.) sees the longest lead times, while Winter (23 days avg.) has the shortest, reflecting typical travel planning cycles.
Recommendations for Hosts
- Use the overall average lead time (43 days) as a baseline for your pricing and availability strategy in Roeland Park.
- For June stays, consider implementing length-of-stay discounts or slightly higher rates for bookings made less than 55 days out to capitalize on advance planning.
- During February, focus on last-minute booking availability and promotions, as guests book with very short notice (11 days avg.).
- Target marketing efforts for the Summer season well in advance (at least 46 days) to capture early planners.
- Monitor your own booking lead times against these Roeland Park averages to identify opportunities for dynamic pricing adjustments.
Popular & Essential Airbnb Amenities in Roeland Park (2025)
Amenity Prevalence
No amenities with partial availability (less than 100%) were found to display in the chart. All essential amenities might be present in all listings. Check insights below.
Amenity Insights for Roeland Park
- Essential amenities in Roeland Park that guests expect include: Heating, Wifi, Free parking on premises, Coffee maker, Air conditioning, Carbon monoxide alarm, Microwave, TV, Hot water, Smoke alarm. Lacking these (any) could significantly impact bookings.
Recommendations for Hosts
- Ensure your listing includes all essential amenities for Roeland Park: Heating, Wifi, Free parking on premises, Coffee maker, Air conditioning, Carbon monoxide alarm, Microwave, TV, Hot water, Smoke alarm.
- Highlight unique or less common amenities you offer (e.g., hot tub, dedicated workspace, EV charger) in your listing description and photos.
- Regularly check competitor amenities in Roeland Park to stay competitive.
Roeland Park Airbnb Guest Demographics & Profile Analysis (2025)
Guest Profile Summary for Roeland Park
- The typical guest profile for Airbnb in Roeland Park consists of primarily domestic travelers (98%), often arriving from nearby Wichita, typically belonging to the Post-2000s (Gen Z/Alpha) group (50%), primarily speaking English or Spanish.
- Domestic travelers account for 97.6% of guests.
- Key international markets include United States (97.6%) and DC (0.6%).
- Top languages spoken are English (73%) followed by Spanish (11.4%).
- A significant demographic segment is the Post-2000s (Gen Z/Alpha) group, representing 50% of guests.
Recommendations for Hosts
- Target domestic marketing efforts towards travelers from Wichita and St. Louis.
- Tailor amenities and listing descriptions to appeal to the dominant Post-2000s (Gen Z/Alpha) demographic (e.g., highlight fast WiFi, smart home features, local guides).
- Highlight unique local experiences or amenities relevant to the primary guest profile.
- Consider seasonal promotions aligned with peak travel times for key origin markets.
Nearby Short-Term Rental Market Comparison
How does the Roeland Park Airbnb market stack up against its neighbors? Compare key performance metrics like average monthly revenue, ADR, and occupancy rates in surrounding areas to understand the broader regional STR landscape.
| Market | Active Properties | Monthly Revenue | Daily Rate | Avg. Occupancy |
|---|---|---|---|---|
| Weston | 14 | $3,406 | $329.80 | 38% |
| Pleasant Hill | 10 | $3,037 | $210.07 | 55% |
| Prairie Village | 50 | $3,008 | $208.45 | 59% |
| Overland Park | 263 | $2,567 | $197.48 | 52% |
| Eudora | 14 | $2,363 | $182.44 | 55% |
| Liberty | 35 | $2,249 | $153.13 | 57% |
| Olathe | 71 | $2,239 | $180.28 | 53% |
| Mission | 15 | $2,207 | $166.43 | 61% |
| Smithville | 22 | $2,203 | $169.41 | 49% |
| Lawrence | 232 | $2,143 | $184.79 | 49% |