Salem Airbnb Market Analysis 2025: Short Term Rental Data & Vacation Rental Statistics in Indiana, United States
Is Airbnb profitable in Salem in 2025? Explore comprehensive Airbnb analytics for Salem, Indiana, United States to uncover income potential. This 2025 STR market report for Salem, based on AirROI data from June 2024 to May 2025, reveals key trends in the niche market of 24 active listings.
Whether you're considering an Airbnb investment in Salem, optimizing your existing vacation rental, or exploring rental arbitrage opportunities, understanding the Salem Airbnb data is crucial. Leveraging the low regulation environment is key to maximizing your short term rental income potential. Let's dive into the specifics.
Key Salem Airbnb Performance Metrics Overview
Monthly Airbnb Revenue Variations & Income Potential in Salem (2025)
Understanding the monthly revenue variations for Airbnb listings in Salem is key to maximizing your short term rental income potential. Seasonality significantly impacts earnings. Our analysis, based on data from the past 12 months, shows that the peak revenue month for STRs in Salem is typically September, while December often presents the lowest earnings, highlighting opportunities for strategic pricing adjustments during shoulder and low seasons. Explore the typical Airbnb income in Salem across different performance tiers:
- Best-in-class properties (Top 10%) achieve $2,209+ monthly, often utilizing dynamic pricing and superior guest experiences.
- Strong performing properties (Top 25%) earn $1,613 or more, indicating effective management and desirable locations/amenities.
- Typical properties (Median) generate around $891 per month, representing the average market performance.
- Entry-level properties (Bottom 25%) see earnings around $469, often with potential for optimization.
Average Monthly Airbnb Earnings Trend in Salem
Salem Airbnb Occupancy Rate Trends (2025)
Maximize your bookings by understanding the Salem STR occupancy trends. Seasonal demand shifts significantly influence how often properties are booked. Typically, Junesees the highest demand (peak season occupancy), while December experiences the lowest (low season). Effective strategies, like adjusting minimum stays or offering promotions, can boost occupancy during slower periods. Here's how different property tiers perform in Salem:
- Best-in-class properties (Top 10%) achieve 60%+ occupancy, indicating high desirability and potentially optimized availability.
- Strong performing properties (Top 25%) maintain 38% or higher occupancy, suggesting good market fit and guest satisfaction.
- Typical properties (Median) have an occupancy rate around 22%.
- Entry-level properties (Bottom 25%) average 14% occupancy, potentially facing higher vacancy.
Average Monthly Occupancy Rate Trend in Salem
Average Daily Rate (ADR) Airbnb Trends in Salem (2025)
Effective short term rental pricing strategy in Salem involves understanding monthly ADR fluctuations. The Average Daily Rate (ADR) for Airbnb in Salem typically peaks in May and dips lowest during November. Leveraging Airbnb dynamic pricing tools or strategies based on this seasonality can significantly boost revenue. Here's a look at the typical nightly rates achieved:
- Best-in-class properties (Top 10%) command rates of $340+ per night, often due to premium features or locations.
- Strong performing properties (Top 25%) achieve nightly rates of $203 or more.
- Typical properties (Median) charge around $108 per night.
- Entry-level properties (Bottom 25%) earn around $87 per night.
Average Daily Rate (ADR) Trend by Month in Salem
Get Live Salem Market Intelligence 👇

Explore Real-time Analytics
Airbnb Seasonality Analysis & Trends in Salem (2025)
Peak Season (September, June, August)
- Revenue averages $1,464 per month
- Occupancy rates average 41.0%
- Daily rates average $151
Shoulder Season
- Revenue averages $1,144 per month
- Occupancy maintains around 26.4%
- Daily rates hold near $158
Low Season (January, October, December)
- Revenue drops to average $807 per month
- Occupancy decreases to average 21.7%
- Daily rates adjust to average $145
Seasonality Insights for Salem
- The Airbnb seasonality in Salem shows highly seasonal trends requiring careful strategy. While the sections above show seasonal averages, it's also insightful to look at the extremes:
- During the high season, the absolute peak month showcases Salem's highest earning potential, with monthly revenues capable of climbing to $1,687, occupancy reaching a high of 57.6%, and ADRs peaking at $188.
- Conversely, the slowest single month of the year, typically falling within the low season, marks the market's lowest point. In this month, revenue might dip to $566, occupancy could drop to 16.1%, and ADRs may adjust down to $140.
- Understanding both the seasonal averages and these monthly peaks and troughs in revenue, occupancy, and ADR is crucial for maximizing your Airbnb profit potential in Salem.
Seasonal Strategies for Maximizing Profit
- Peak Season: Maximize revenue through premium pricing and potentially longer minimum stays. Ensure high availability.
- Low Season: Offer competitive pricing, special promotions (e.g., extended stay discounts), and flexible cancellation policies. Target off-season travelers like remote workers or budget-conscious guests.
- Shoulder Seasons: Implement dynamic pricing that balances peak and low rates. Target weekend travelers or specific events. Offer slightly more flexible terms than peak season.
- Regularly analyze your own performance against these Salem seasonality benchmarks and adjust your pricing and availability strategy accordingly.
Best Areas for Airbnb Investment in Salem (2025)
Exploring the top neighborhoods for short-term rentals in Salem? This section highlights key areas, outlining why they are attractive for hosts and guests, along with notable local attractions. Consider these locations based on your target guest profile and investment strategy.
| Neighborhood / Area | Why Host Here? (Target Guests & Appeal) | Key Attractions & Landmarks |
|---|---|---|
| Downtown Salem | The heart of Salem, known for its charming historic buildings and local restaurants. It attracts visitors exploring the city’s rich history and vibrant community events. | Salem Museum, John Hay Center, Lincoln Hills Agricultural Area, Local shops and cafes, Historic architecture |
| Cascades Park Area | A picturesque area with natural beauty and outdoor activities, ideal for nature enthusiasts and families visiting the parks. | Cascades Park, Salem Public Library, Walking trails, Picnic areas, Bird watching spots |
| Salem City Park | Popular with families and kids, this area features recreational facilities and is a great spot for local events, festivals, and gatherings. | Salem City Park, Playgrounds, Sports facilities, Annual community events, Summer concerts |
| Washington County | Close to Salem, this rural area offers a unique experience for guests looking for a quiet retreat in nature, perfect for short stays. | Local farms, Scenic countryside, Hiking trails, Water recreation, Historic sites |
| Lake Salinda | A serene area ideal for water activities, attracting those who enjoy fishing, boating, and other water sports. | Fishing spots, Boating access, Picnic areas, Scenic views, Wildlife spotting |
| West Main Street | Known for its eclectic mix of shops and cafes, this area draws in visitors looking for a unique shopping and dining experience. | Quaint shops, Local eateries, Art galleries, Community events, Seasonal farmers market |
| Historic District | Offers a charming glimpse into Salem's past with its preserved buildings and historical landmarks. Great for history enthusiasts and cultural experiences. | Historic homes, Old brick streets, Local history tours, Community festivals, Salem Art Gallery |
| Sadieville Area | A relaxed setting on the outskirts of Salem, appealing to those seeking tranquility and escape from city life, good for weekend getaways. | Nature trails, Biking routes, Peaceful landscapes, Wildflower viewing, Stargazing spots |
Understanding Airbnb License Requirements & STR Laws in Salem (2025)
While Salem, Indiana, United States currently shows low STR regulations, specific Airbnb license requirements might still exist or change. Always verify the latest short term rental regulations and Airbnb license requirements directly with local government authorities for Salem to ensure full compliance before hosting.
(Source: AirROI data, 2025, based on 4% licensed listings)
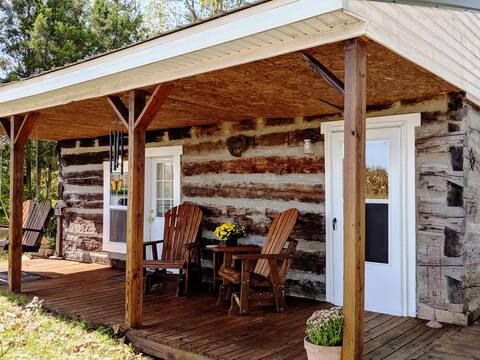
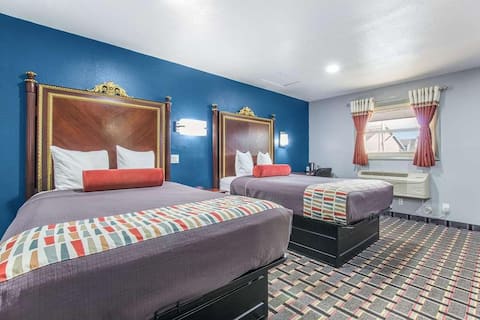
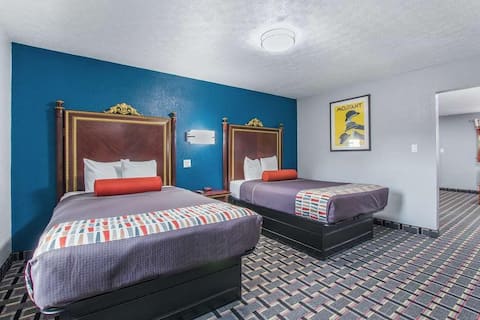
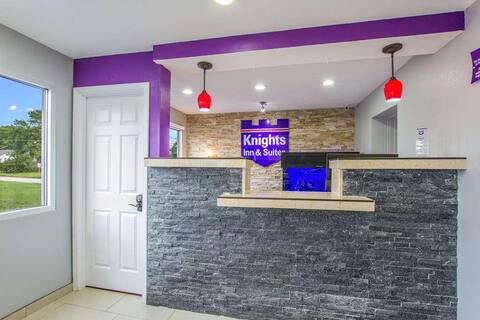
Top Performing Airbnb Properties in Salem (2025)
Benchmark your potential! Explore examples of top-performing Airbnb properties in Salembased on Trailing Twelve Month (TTM) revenue. Analyze their characteristics, revenue, occupancy rate, and ADR to understand what drives success in this market.

Vintage 1910 Cottage Home
Entire Place • 1 bedroom
Dee's Country Cabin
Entire Place • 1 bedroom

The 1920s Annex
Entire Place • 4 bedrooms
Relax and Recharge! 3 Comfortable Units, Parking
Private Room • 3 bedrooms
Rare Find! 3 Spacious Units, Near Salem Speedway
Private Room • 3 bedrooms
Look No Further! 3 Relaxing Units, Pet-friendly
Private Room • 3 bedrooms
Note: Performance varies based on location, size, amenities, seasonality, and management quality. Data reflects the past 12 months.
Top Performing Airbnb Hosts in Salem (2025)
Learn from the best! This table showcases top-performing Airbnb hosts in Salem based on the number of properties managed and estimated total revenue over the past year. Analyze their scale and performance metrics.
| Host Name | Properties | Grossing Revenue | Stay Reviews | Avg Rating |
|---|---|---|---|---|
| Host #496944100 | 12 | $95,870 | 7 | 4.80/5.0 |
| Therisa | 2 | $21,090 | 265 | 4.97/5.0 |
| Judy | 1 | $20,385 | 70 | 4.90/5.0 |
| Deirdre | 1 | $19,387 | 341 | 4.91/5.0 |
| Kaylee | 1 | $18,049 | 4 | 5.00/5.0 |
| Teresa | 3 | $17,915 | 28 | 4.92/5.0 |
| Riley | 1 | $11,130 | 110 | 4.78/5.0 |
| Sid | 1 | $6,253 | 11 | 5.00/5.0 |
| Tara | 1 | $5,367 | 9 | 5.00/5.0 |
| Darrel & Vivian | 1 | $1,717 | 52 | 4.87/5.0 |
Analyzing the strategies of top hosts, such as their property selection, pricing, and guest communication, can offer valuable lessons for optimizing your own Airbnb operations in Salem.
Dive Deeper: Advanced Salem STR Market Data (2025)
Ready to unlock more insights? AirROI provides access to advanced metrics and comprehensive Airbnb data for Salem. Explore detailed analytics beyond this report to refine your investment strategy, optimize pricing, and maximize your vacation rental profits.
Explore Advanced MetricsSalem Short-Term Rental Market Composition (2025): Property & Room Types
Room Type Distribution
Property Type Distribution
Market Composition Insights for Salem
- The Salem Airbnb market composition is heavily skewed towards Entire Home/Apt listings, which make up 50% of the 24 active rentals. This indicates strong guest preference for privacy and space.
- Looking at the property type distribution in Salem, Hotel/Boutique properties are the most common (54.2%), reflecting the local real estate landscape.
- Houses represent a significant 29.2% portion, catering likely to families or larger groups.
- The presence of 54.2% Hotel/Boutique listings indicates integration with traditional hospitality.
- Smaller segments like outdoor/unique (combined 4.2%) offer potential for unique stay experiences.
Salem Airbnb Room Capacity Analysis (2025): Bedroom Distribution
Distribution of Listings by Number of Bedrooms
Room Capacity Insights for Salem
- The dominant room capacity in Salem is 1 bedroom listings, making up 45.8% of the market. This suggests a strong demand for properties suitable for couples or solo travelers.
- Together, 1 bedroom and 2 bedrooms properties represent 79.1% of the active Airbnb listings in Salem, indicating a high concentration in these sizes.
Salem Vacation Rental Guest Capacity Trends (2025)
Distribution of Listings by Guest Capacity
Guest Capacity Insights for Salem
- The most common guest capacity trend in Salem vacation rentals is listings accommodating 2 guests (29.2%). This suggests the primary traveler segment is likely couples or solo travelers.
- Properties designed for 2 guests and 8+ guests dominate the Salem STR market, accounting for 58.4% of listings.
- 45.9% of properties accommodate 6+ guests, serving the market segment for larger families or group travel in Salem.
- On average, properties in Salem are equipped to host 4.9 guests.
Salem Airbnb Booking Patterns (2025): Available vs. Booked Days
Available Days Distribution
Booked Days Distribution
Booking Pattern Insights for Salem
- The most common availability pattern in Salem falls within the 271-366 days range, representing 79.2% of listings. This suggests many properties have significant open periods on their calendars.
- Approximately 87.5% of listings show high availability (181+ days open annually), indicating potential for increased bookings or specific owner usage patterns.
- For booked days, the 31-90 days range is most frequent in Salem (41.7%), reflecting common guest stay durations or potential owner blocking patterns.
- A notable 12.5% of properties secure long booking periods (181+ days booked per year), highlighting successful long-term rental strategies or significant owner usage.
Salem Airbnb Minimum Stay Requirements Analysis
Distribution of Listings by Minimum Night Requirement
1 Night
18 listings
75% of total
2 Nights
5 listings
20.8% of total
3 Nights
1 listings
4.2% of total
Key Insights
- The most prevalent minimum stay requirement in Salem is 1 Night, adopted by 75% of listings. This highlights the market's preference for shorter, flexible bookings.
- A strong majority (95.8%) of the Salem Airbnb data shows acceptance of very short stays (1-2 nights), indicating a dynamic, high-turnover market.
Recommendations
- Align with the market by considering a 1 Night minimum stay, as 75% of Salem hosts use this setting.
- Adjust minimum nights based on seasonality – potentially shorter during low season and longer during peak demand periods in Salem.
Salem Airbnb Cancellation Policy Trends Analysis (2025)
Flexible
2 listings
16.7% of total
Moderate
8 listings
66.7% of total
Firm
2 listings
16.7% of total
Cancellation Policy Insights for Salem
- The prevailing Airbnb cancellation policy trend in Salem is Moderate, used by 66.7% of listings.
- The market strongly favors guest-friendly terms, with 83.4% of listings offering Flexible or Moderate policies. This suggests guests in Salem may expect booking flexibility.
Recommendations for Hosts
- Consider adopting a Moderate policy to align with the 66.7% market standard in Salem.
- Regularly review your cancellation policy against competitors and market demand shifts in Salem.
Salem STR Booking Lead Time Analysis (2025)
Average Booking Lead Time by Month
Booking Lead Time Insights for Salem
- The overall average booking lead time for vacation rentals in Salem is 20 days.
- Guests book furthest in advance for stays during October (average 49 days), likely coinciding with peak travel demand or local events.
- The shortest booking windows occur for stays in January (average 7 days), indicating more last-minute travel plans during this time.
- Seasonally, Fall (29 days avg.) sees the longest lead times, while Winter (11 days avg.) has the shortest, reflecting typical travel planning cycles.
Recommendations for Hosts
- Use the overall average lead time (20 days) as a baseline for your pricing and availability strategy in Salem.
- For October stays, consider implementing length-of-stay discounts or slightly higher rates for bookings made less than 49 days out to capitalize on advance planning.
- During January, focus on last-minute booking availability and promotions, as guests book with very short notice (7 days avg.).
- Target marketing efforts for the Fall season well in advance (at least 29 days) to capture early planners.
- Monitor your own booking lead times against these Salem averages to identify opportunities for dynamic pricing adjustments.
Popular & Essential Airbnb Amenities in Salem (2025)
Amenity Prevalence
Amenity Insights for Salem
- Essential amenities in Salem that guests expect include: Heating, Wifi, TV, Free parking on premises, Hot water, Air conditioning, Smoke alarm, Essentials, Kitchen. Lacking these (any) could significantly impact bookings.
- Popular amenities like Microwave are common but not universal. Offering these can provide a competitive edge.
Recommendations for Hosts
- Ensure your listing includes all essential amenities for Salem: Heating, Wifi, TV, Free parking on premises, Hot water, Air conditioning, Smoke alarm, Essentials, Kitchen.
- Prioritize adding missing essentials: Essentials, Kitchen.
- Consider adding popular differentiators like Microwave to increase appeal.
- Highlight unique or less common amenities you offer (e.g., hot tub, dedicated workspace, EV charger) in your listing description and photos.
- Regularly check competitor amenities in Salem to stay competitive.
Salem Airbnb Guest Demographics & Profile Analysis (2025)
Guest Profile Summary for Salem
- The typical guest profile for Airbnb in Salem consists of primarily domestic travelers (98%), often arriving from nearby Frostproof, typically belonging to the Post-2000s (Gen Z/Alpha) group (50%), primarily speaking English or Spanish.
- Domestic travelers account for 98.0% of guests.
- Key international markets include United States (98%) and Ireland (1%).
- Top languages spoken are English (88.7%) followed by Spanish (4.8%).
- A significant demographic segment is the Post-2000s (Gen Z/Alpha) group, representing 50% of guests.
Recommendations for Hosts
- Target domestic marketing efforts towards travelers from Frostproof and Pittsburgh.
- Tailor amenities and listing descriptions to appeal to the dominant Post-2000s (Gen Z/Alpha) demographic (e.g., highlight fast WiFi, smart home features, local guides).
- Highlight unique local experiences or amenities relevant to the primary guest profile.
- Consider seasonal promotions aligned with peak travel times for key origin markets.
Nearby Short-Term Rental Market Comparison
How does the Salem Airbnb market stack up against its neighbors? Compare key performance metrics like average monthly revenue, ADR, and occupancy rates in surrounding areas to understand the broader regional STR landscape.
| Market | Active Properties | Monthly Revenue | Daily Rate | Avg. Occupancy |
|---|---|---|---|---|
| Simpsonville | 19 | $3,688 | $321.76 | 44% |
| Crestwood | 18 | $3,521 | $531.50 | 39% |
| Bee Spring | 12 | $3,465 | $450.06 | 39% |
| La Grange | 22 | $3,001 | $312.46 | 47% |
| Nashville | 252 | $2,921 | $276.59 | 40% |
| Prospect | 17 | $2,917 | $628.53 | 43% |
| Martinsville | 22 | $2,879 | $240.14 | 47% |
| Shelbyville | 76 | $2,867 | $321.36 | 38% |
| Cub Run | 28 | $2,835 | $258.70 | 45% |
| Greencastle | 51 | $2,809 | $281.46 | 39% |