Matteson Airbnb Market Analysis 2025: Short Term Rental Data & Vacation Rental Statistics in Illinois, United States
Is Airbnb profitable in Matteson in 2025? Explore comprehensive Airbnb analytics for Matteson, Illinois, United States to uncover income potential. This 2025 STR market report for Matteson, based on AirROI data from April 2024 to March 2025, reveals key trends in the niche market of 20 active listings.
Whether you're considering an Airbnb investment in Matteson, optimizing your existing vacation rental, or exploring rental arbitrage opportunities, understanding the Matteson Airbnb data is crucial. Leveraging the low regulation environment is key to maximizing your short term rental income potential. Let's dive into the specifics.
Key Matteson Airbnb Performance Metrics Overview
Monthly Airbnb Revenue Variations & Income Potential in Matteson (2025)
Understanding the monthly revenue variations for Airbnb listings in Matteson is key to maximizing your short term rental income potential. Seasonality significantly impacts earnings. Our analysis, based on data from the past 12 months, shows that the peak revenue month for STRs in Matteson is typically July, while February often presents the lowest earnings, highlighting opportunities for strategic pricing adjustments during shoulder and low seasons. Explore the typical Airbnb income in Matteson across different performance tiers:
- Best-in-class properties (Top 10%) achieve $4,339+ monthly, often utilizing dynamic pricing and superior guest experiences.
- Strong performing properties (Top 25%) earn $3,257 or more, indicating effective management and desirable locations/amenities.
- Typical properties (Median) generate around $1,965 per month, representing the average market performance.
- Entry-level properties (Bottom 25%) see earnings around $1,120, often with potential for optimization.
Average Monthly Airbnb Earnings Trend in Matteson
Matteson Airbnb Occupancy Rate Trends (2025)
Maximize your bookings by understanding the Matteson STR occupancy trends. Seasonal demand shifts significantly influence how often properties are booked. Typically, Octobersees the highest demand (peak season occupancy), while February experiences the lowest (low season). Effective strategies, like adjusting minimum stays or offering promotions, can boost occupancy during slower periods. Here's how different property tiers perform in Matteson:
- Best-in-class properties (Top 10%) achieve 60%+ occupancy, indicating high desirability and potentially optimized availability.
- Strong performing properties (Top 25%) maintain 51% or higher occupancy, suggesting good market fit and guest satisfaction.
- Typical properties (Median) have an occupancy rate around 35%.
- Entry-level properties (Bottom 25%) average 23% occupancy, potentially facing higher vacancy.
Average Monthly Occupancy Rate Trend in Matteson
Average Daily Rate (ADR) Airbnb Trends in Matteson (2025)
Effective short term rental pricing strategy in Matteson involves understanding monthly ADR fluctuations. The Average Daily Rate (ADR) for Airbnb in Matteson typically peaks in July and dips lowest during January. Leveraging Airbnb dynamic pricing tools or strategies based on this seasonality can significantly boost revenue. Here's a look at the typical nightly rates achieved:
- Best-in-class properties (Top 10%) command rates of $388+ per night, often due to premium features or locations.
- Strong performing properties (Top 25%) achieve nightly rates of $284 or more.
- Typical properties (Median) charge around $213 per night.
- Entry-level properties (Bottom 25%) earn around $122 per night.
Average Daily Rate (ADR) Trend by Month in Matteson
Get Live Matteson Market Intelligence 👇

Explore Real-time Analytics
Airbnb Seasonality Analysis & Trends in Matteson (2025)
Peak Season (July, October, August)
- Revenue averages $3,306 per month
- Occupancy rates average 55.4%
- Daily rates average $229
Shoulder Season
- Revenue averages $2,547 per month
- Occupancy maintains around 39.3%
- Daily rates hold near $226
Low Season (January, February, December)
- Revenue drops to average $1,036 per month
- Occupancy decreases to average 17.1%
- Daily rates adjust to average $221
Seasonality Insights for Matteson
- The Airbnb seasonality in Matteson shows highly seasonal trends requiring careful strategy. While the sections above show seasonal averages, it's also insightful to look at the extremes:
- During the high season, the absolute peak month showcases Matteson's highest earning potential, with monthly revenues capable of climbing to $3,380, occupancy reaching a high of 58.4%, and ADRs peaking at $231.
- Conversely, the slowest single month of the year, typically falling within the low season, marks the market's lowest point. In this month, revenue might dip to $588, occupancy could drop to 10.7%, and ADRs may adjust down to $218.
- Understanding both the seasonal averages and these monthly peaks and troughs in revenue, occupancy, and ADR is crucial for maximizing your Airbnb profit potential in Matteson.
Seasonal Strategies for Maximizing Profit
- Peak Season: Maximize revenue through premium pricing and potentially longer minimum stays. Ensure high availability.
- Low Season: Offer competitive pricing, special promotions (e.g., extended stay discounts), and flexible cancellation policies. Target off-season travelers like remote workers or budget-conscious guests.
- Shoulder Seasons: Implement dynamic pricing that balances peak and low rates. Target weekend travelers or specific events. Offer slightly more flexible terms than peak season.
- Regularly analyze your own performance against these Matteson seasonality benchmarks and adjust your pricing and availability strategy accordingly.
Best Areas for Airbnb Investment in Matteson (2025)
Exploring the top neighborhoods for short-term rentals in Matteson? This section highlights key areas, outlining why they are attractive for hosts and guests, along with notable local attractions. Consider these locations based on your target guest profile and investment strategy.
| Neighborhood / Area | Why Host Here? (Target Guests & Appeal) | Key Attractions & Landmarks |
|---|---|---|
| Matteson Town Center | Central hub with shopping, dining, and easy access to highways. Attractive for both families and business travelers seeking convenience and amenities. | Matteson Plaza, Pinebrook Estates Park, Matteson Public Library, local restaurants and cafes |
| Village of Matteson | Family-friendly area with good schools and parks. Ideal for family vacations and travelers interested in local community experiences. | Matteson Community Center, Miller Park, Golf courses nearby, local community events |
| Eagle Ridge | Quiet residential neighborhood with a suburban feel. Great for longer stays and families visiting friends or relatives in the area. | Eagle Ridge Park, local walking trails, community sports fields |
| North Matteson | Growing area with new developments and close proximity to public transportation. Good for younger travelers and professionals. | nearby shopping centers, easy access to train stations, local cafes and bars |
| Lakewood Estates | Peaceful community with scenic views and access to nature. Attractive for those seeking relaxation and outdoor activities. | Lakewood Park, walking paths, nature trails |
| Matteson Ridge | Residential area with a mix of families and retirees. Offers a calm setting for those looking for a home-away-from-home experience. | Matteson Ridge Park, community playgrounds, local eateries |
| South Suburbs | Greater South Suburban area, featuring diverse attractions and easy access to Chicago. Suitable for guests looking to explore both urban and suburban settings. | South Suburban College, local festivals and markets, nearby entertainment options |
| Orland Park nearby | Adjacent to Matteson, Orland Park is well known for its shopping and dining, attracting visitors looking for a vibrant suburban experience. | Orland Square Mall, local dining spots, outdoor parks and recreation areas |
Understanding Airbnb License Requirements & STR Laws in Matteson (2025)
While Matteson, Illinois, United States currently shows low STR regulations, specific Airbnb license requirements might still exist or change. Always verify the latest short term rental regulations and Airbnb license requirements directly with local government authorities for Matteson to ensure full compliance before hosting.
(Source: AirROI data, 2025, finding no licensed listings among those analyzed)
Top Performing Airbnb Properties in Matteson (2025)
Benchmark your potential! Explore examples of top-performing Airbnb properties in Mattesonbased on Trailing Twelve Month (TTM) revenue. Analyze their characteristics, revenue, occupancy rate, and ADR to understand what drives success in this market.
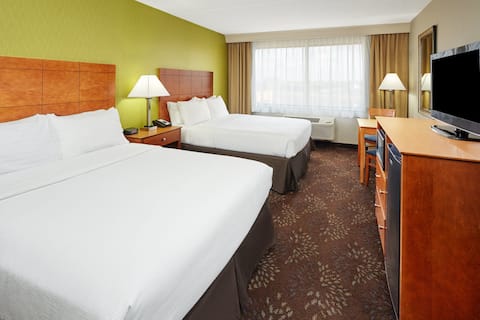
2 Family-Friendly Units, Indoor Pool, Parking
Private Room • 2 bedrooms

Rare Find! 3 Great Units, Onsite Restaurant
Private Room • 3 bedrooms
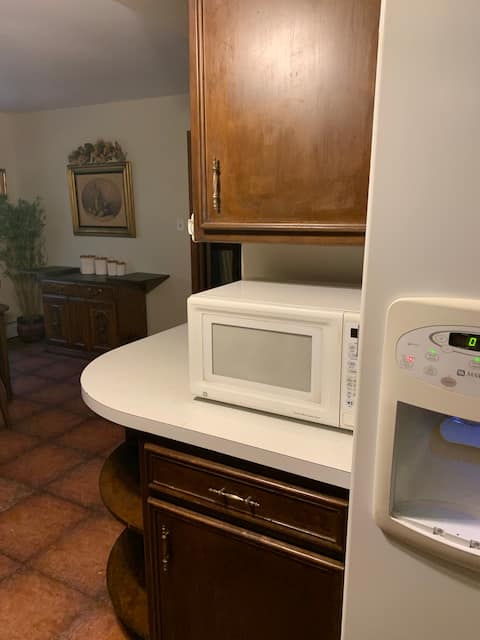
"Just Like Home"
Entire Place • 4 bedrooms
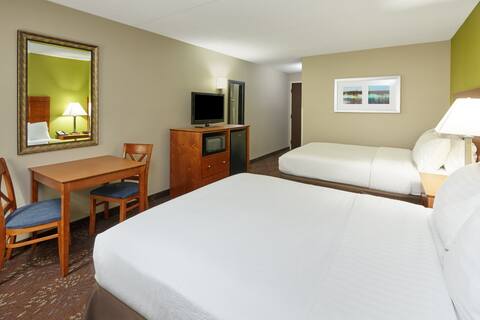
Just What You Were Looking For! Free Parking
Private Room • 1 bedroom
Matteson Awaits! Free Parking, Onsite Restaurant
Private Room • 1 bedroom

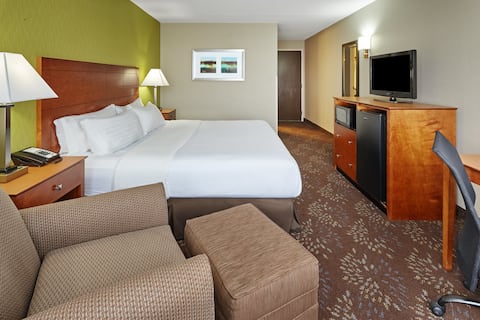
Making The Best Memories Along The Way! Parking
Private Room • 1 bedroom
Note: Performance varies based on location, size, amenities, seasonality, and management quality. Data reflects the past 12 months.
Top Performing Airbnb Hosts in Matteson (2025)
Learn from the best! This table showcases top-performing Airbnb hosts in Matteson based on the number of properties managed and estimated total revenue over the past year. Analyze their scale and performance metrics.
| Host Name | Properties | Grossing Revenue | Stay Reviews | Avg Rating |
|---|---|---|---|---|
| Host #174792040 | 14 | $196,835 | 24 | 0.92/5.0 |
| Jovonda | 1 | $24,613 | 61 | 4.69/5.0 |
| Host #95130925 | 1 | $14,935 | 0 | 0.00/5.0 |
| Harvest | 1 | $9,973 | 134 | 4.56/5.0 |
| Host #136825532 | 1 | $6,491 | 0 | 0.00/5.0 |
| Pam | 1 | $3,970 | 27 | 4.70/5.0 |
| Host #370869399 | 1 | $3,359 | 1 | 0.00/5.0 |
Analyzing the strategies of top hosts, such as their property selection, pricing, and guest communication, can offer valuable lessons for optimizing your own Airbnb operations in Matteson.
Dive Deeper: Advanced Matteson STR Market Data (2025)
Ready to unlock more insights? AirROI provides access to advanced metrics and comprehensive Airbnb data for Matteson. Explore detailed analytics beyond this report to refine your investment strategy, optimize pricing, and maximize your vacation rental profits.
Explore Advanced MetricsMatteson Short-Term Rental Market Composition (2025): Property & Room Types
Room Type Distribution
Property Type Distribution
Market Composition Insights for Matteson
- The Matteson Airbnb market composition is heavily skewed towards Hotel Room listings, which make up 70% of the 20 active rentals. This indicates strong guest preference for privacy and space.
- Looking at the property type distribution in Matteson, Hotel/Boutique properties are the most common (70%), reflecting the local real estate landscape.
- Houses represent a significant 25% portion, catering likely to families or larger groups.
- The presence of 70% Hotel/Boutique listings indicates integration with traditional hospitality.
Matteson Airbnb Room Capacity Analysis (2025): Bedroom Distribution
Distribution of Listings by Number of Bedrooms
Room Capacity Insights for Matteson
- The dominant room capacity in Matteson is 1 bedroom listings, making up 40% of the market. This suggests a strong demand for properties suitable for couples or solo travelers.
- Together, 1 bedroom and 2 bedrooms properties represent 70.0% of the active Airbnb listings in Matteson, indicating a high concentration in these sizes.
- A significant 30.0% of listings offer 3+ bedrooms, catering to larger groups and families seeking more space in Matteson.
Matteson Vacation Rental Guest Capacity Trends (2025)
Distribution of Listings by Guest Capacity
Guest Capacity Insights for Matteson
- The most common guest capacity trend in Matteson vacation rentals is listings accommodating 8+ guests (40%). This suggests the primary traveler segment is likely larger groups.
- Properties designed for 8+ guests and 4 guests dominate the Matteson STR market, accounting for 75.0% of listings.
- 45.0% of properties accommodate 6+ guests, serving the market segment for larger families or group travel in Matteson.
- On average, properties in Matteson are equipped to host 5.3 guests.
Matteson Airbnb Booking Patterns (2025): Available vs. Booked Days
Available Days Distribution
Booked Days Distribution
Booking Pattern Insights for Matteson
- The most common availability pattern in Matteson falls within the 271-366 days range, representing 70% of listings. This suggests many properties have significant open periods on their calendars.
- Approximately 90.0% of listings show high availability (181+ days open annually), indicating potential for increased bookings or specific owner usage patterns.
- For booked days, the 1-30 days range is most frequent in Matteson (35%), reflecting common guest stay durations or potential owner blocking patterns.
- A notable 10.0% of properties secure long booking periods (181+ days booked per year), highlighting successful long-term rental strategies or significant owner usage.
Matteson Airbnb Minimum Stay Requirements Analysis
Distribution of Listings by Minimum Night Requirement
1 Night
14 listings
70% of total
2 Nights
2 listings
10% of total
3 Nights
2 listings
10% of total
30+ Nights
2 listings
10% of total
Key Insights
- The most prevalent minimum stay requirement in Matteson is 1 Night, adopted by 70% of listings. This highlights the market's preference for shorter, flexible bookings.
- A strong majority (80.0%) of the Matteson Airbnb data shows acceptance of very short stays (1-2 nights), indicating a dynamic, high-turnover market.
Recommendations
- Align with the market by considering a 1 Night minimum stay, as 70% of Matteson hosts use this setting.
- Explore offering discounts for stays of 30+ nights to attract the 10% of the market seeking extended stays.
- Adjust minimum nights based on seasonality – potentially shorter during low season and longer during peak demand periods in Matteson.
Matteson Airbnb Cancellation Policy Trends Analysis (2025)
Flexible
1 listings
33.3% of total
Moderate
2 listings
66.7% of total
Cancellation Policy Insights for Matteson
- The prevailing Airbnb cancellation policy trend in Matteson is Moderate, used by 66.7% of listings.
- The market strongly favors guest-friendly terms, with 100.0% of listings offering Flexible or Moderate policies. This suggests guests in Matteson may expect booking flexibility.
Recommendations for Hosts
- Consider adopting a Moderate policy to align with the 66.7% market standard in Matteson.
- Regularly review your cancellation policy against competitors and market demand shifts in Matteson.
Matteson STR Booking Lead Time Analysis (2025)
Average Booking Lead Time by Month
Booking Lead Time Insights for Matteson
- The overall average booking lead time for vacation rentals in Matteson is 20 days.
- Guests book furthest in advance for stays during October (average 56 days), likely coinciding with peak travel demand or local events.
- The shortest booking windows occur for stays in March (average 0 days), indicating more last-minute travel plans during this time.
- Seasonally, Summer (33 days avg.) sees the longest lead times, while Spring (12 days avg.) has the shortest, reflecting typical travel planning cycles.
Recommendations for Hosts
- Use the overall average lead time (20 days) as a baseline for your pricing and availability strategy in Matteson.
- For October stays, consider implementing length-of-stay discounts or slightly higher rates for bookings made less than 56 days out to capitalize on advance planning.
- During March, focus on last-minute booking availability and promotions, as guests book with very short notice (0 days avg.).
- Target marketing efforts for the Summer season well in advance (at least 33 days) to capture early planners.
- Monitor your own booking lead times against these Matteson averages to identify opportunities for dynamic pricing adjustments.
Popular & Essential Airbnb Amenities in Matteson (2025)
Amenity Prevalence
Amenity Insights for Matteson
- Essential amenities in Matteson that guests expect include: Essentials, Kitchen, Air conditioning, Free parking on premises, Heating, Wifi, Smoke alarm, TV, Washer, Hot water. Lacking these (any) could significantly impact bookings.
Recommendations for Hosts
- Ensure your listing includes all essential amenities for Matteson: Essentials, Kitchen, Air conditioning, Free parking on premises, Heating, Wifi, Smoke alarm, TV, Washer, Hot water.
- Prioritize adding missing essentials: Washer, Hot water.
- Highlight unique or less common amenities you offer (e.g., hot tub, dedicated workspace, EV charger) in your listing description and photos.
- Regularly check competitor amenities in Matteson to stay competitive.
Matteson Airbnb Guest Demographics & Profile Analysis (2025)
Guest Profile Summary for Matteson
- The typical guest profile for Airbnb in Matteson consists of primarily domestic travelers (98%), often arriving from nearby Powder Springs, typically belonging to the Post-2000s (Gen Z/Alpha) group (50%), primarily speaking English or Spanish.
- Domestic travelers account for 97.7% of guests.
- Key international markets include United States (97.7%) and Canada (2.3%).
- Top languages spoken are English (71.4%) followed by Spanish (9.5%).
- A significant demographic segment is the Post-2000s (Gen Z/Alpha) group, representing 50% of guests.
Recommendations for Hosts
- Target domestic marketing efforts towards travelers from Powder Springs and Charlotte.
- Tailor amenities and listing descriptions to appeal to the dominant Post-2000s (Gen Z/Alpha) demographic (e.g., highlight fast WiFi, smart home features, local guides).
- Highlight unique local experiences or amenities relevant to the primary guest profile.
- Consider seasonal promotions aligned with peak travel times for key origin markets.
Nearby Short-Term Rental Market Comparison
How does the Matteson Airbnb market stack up against its neighbors? Compare key performance metrics like average monthly revenue, ADR, and occupancy rates in surrounding areas to understand the broader regional STR landscape.
| Market | Active Properties | Monthly Revenue | Daily Rate | Avg. Occupancy |
|---|---|---|---|---|
| Town of Sugar Creek | 17 | $8,213 | $658.36 | 50% |
| Twin Lakes | 26 | $6,719 | $515.43 | 45% |
| Fennville | 10 | $5,326 | $372.77 | 44% |
| Saugatuck Township | 140 | $5,282 | $462.94 | 43% |
| Laketown Township | 62 | $5,207 | $457.63 | 45% |
| Port Sheldon Township | 27 | $5,185 | $511.35 | 52% |
| Lake Geneva | 167 | $4,958 | $408.65 | 44% |
| Lake Villa | 10 | $4,889 | $294.85 | 57% |
| McHenry | 31 | $4,820 | $436.41 | 44% |
| New Buffalo Township | 253 | $4,731 | $602.57 | 36% |