Manteno Airbnb Market Analysis 2025: Short Term Rental Data & Vacation Rental Statistics in Illinois, United States
Is Airbnb profitable in Manteno in 2025? Explore comprehensive Airbnb analytics for Manteno, Illinois, United States to uncover income potential. This 2025 STR market report for Manteno, based on AirROI data from April 2024 to March 2025, reveals key trends in the niche market of 17 active listings.
Whether you're considering an Airbnb investment in Manteno, optimizing your existing vacation rental, or exploring rental arbitrage opportunities, understanding the Manteno Airbnb data is crucial. Leveraging the low regulation environment is key to maximizing your short term rental income potential. Let's dive into the specifics.
Key Manteno Airbnb Performance Metrics Overview
Monthly Airbnb Revenue Variations & Income Potential in Manteno (2025)
Understanding the monthly revenue variations for Airbnb listings in Manteno is key to maximizing your short term rental income potential. Seasonality significantly impacts earnings. Our analysis, based on data from the past 12 months, shows that the peak revenue month for STRs in Manteno is typically April, while March often presents the lowest earnings, highlighting opportunities for strategic pricing adjustments during shoulder and low seasons. Explore the typical Airbnb income in Manteno across different performance tiers:
- Best-in-class properties (Top 10%) achieve $4,376+ monthly, often utilizing dynamic pricing and superior guest experiences.
- Strong performing properties (Top 25%) earn $3,666 or more, indicating effective management and desirable locations/amenities.
- Typical properties (Median) generate around $2,796 per month, representing the average market performance.
- Entry-level properties (Bottom 25%) see earnings around $841, often with potential for optimization.
Average Monthly Airbnb Earnings Trend in Manteno
Manteno Airbnb Occupancy Rate Trends (2025)
Maximize your bookings by understanding the Manteno STR occupancy trends. Seasonal demand shifts significantly influence how often properties are booked. Typically, Aprilsees the highest demand (peak season occupancy), while March experiences the lowest (low season). Effective strategies, like adjusting minimum stays or offering promotions, can boost occupancy during slower periods. Here's how different property tiers perform in Manteno:
- Best-in-class properties (Top 10%) achieve 85%+ occupancy, indicating high desirability and potentially optimized availability.
- Strong performing properties (Top 25%) maintain 73% or higher occupancy, suggesting good market fit and guest satisfaction.
- Typical properties (Median) have an occupancy rate around 57%.
- Entry-level properties (Bottom 25%) average 39% occupancy, potentially facing higher vacancy.
Average Monthly Occupancy Rate Trend in Manteno
Average Daily Rate (ADR) Airbnb Trends in Manteno (2025)
Effective short term rental pricing strategy in Manteno involves understanding monthly ADR fluctuations. The Average Daily Rate (ADR) for Airbnb in Manteno typically peaks in December and dips lowest during September. Leveraging Airbnb dynamic pricing tools or strategies based on this seasonality can significantly boost revenue. Here's a look at the typical nightly rates achieved:
- Best-in-class properties (Top 10%) command rates of $239+ per night, often due to premium features or locations.
- Strong performing properties (Top 25%) achieve nightly rates of $169 or more.
- Typical properties (Median) charge around $133 per night.
- Entry-level properties (Bottom 25%) earn around $73 per night.
Average Daily Rate (ADR) Trend by Month in Manteno
Get Live Manteno Market Intelligence 👇

Explore Real-time Analytics
Airbnb Seasonality Analysis & Trends in Manteno (2025)
Peak Season (April, May, July)
- Revenue averages $3,414 per month
- Occupancy rates average 66.9%
- Daily rates average $125
Shoulder Season
- Revenue averages $2,704 per month
- Occupancy maintains around 55.2%
- Daily rates hold near $134
Low Season (February, March, September)
- Revenue drops to average $2,116 per month
- Occupancy decreases to average 49.5%
- Daily rates adjust to average $134
Seasonality Insights for Manteno
- The Airbnb seasonality in Manteno shows moderate seasonality with distinct peak and low periods. While the sections above show seasonal averages, it's also insightful to look at the extremes:
- During the high season, the absolute peak month showcases Manteno's highest earning potential, with monthly revenues capable of climbing to $3,569, occupancy reaching a high of 76.7%, and ADRs peaking at $147.
- Conversely, the slowest single month of the year, typically falling within the low season, marks the market's lowest point. In this month, revenue might dip to $1,924, occupancy could drop to 37.5%, and ADRs may adjust down to $121.
- Understanding both the seasonal averages and these monthly peaks and troughs in revenue, occupancy, and ADR is crucial for maximizing your Airbnb profit potential in Manteno.
Seasonal Strategies for Maximizing Profit
- Peak Season: Maximize revenue through premium pricing and potentially longer minimum stays. Ensure high availability.
- Low Season: Offer competitive pricing, special promotions (e.g., extended stay discounts), and flexible cancellation policies. Target off-season travelers like remote workers or budget-conscious guests.
- Shoulder Seasons: Implement dynamic pricing that balances peak and low rates. Target weekend travelers or specific events. Offer slightly more flexible terms than peak season.
- Regularly analyze your own performance against these Manteno seasonality benchmarks and adjust your pricing and availability strategy accordingly.
Best Areas for Airbnb Investment in Manteno (2025)
Exploring the top neighborhoods for short-term rentals in Manteno? This section highlights key areas, outlining why they are attractive for hosts and guests, along with notable local attractions. Consider these locations based on your target guest profile and investment strategy.
| Neighborhood / Area | Why Host Here? (Target Guests & Appeal) | Key Attractions & Landmarks |
|---|---|---|
| Manteno Town Center | The heart of Manteno, where visitors can enjoy local shops, dining, and community events. It's an ideal location for guests seeking a small-town experience with convenience. | Manteno Village Park, Manteno Sports Complex, local restaurants, Main Street shops |
| Kankakee River | Beautiful natural area ideal for outdoor activities such as fishing, kayaking, and hiking. Great for guests looking for nature and tranquility near Manteno. | Kankakee River State Park, riverfront trails, wildlife viewing, picnic areas |
| Manteno State Hospital Historic District | An area rich in history, perfect for those interested in architecture and local history. The historical significance attracts visitors interested in the past. | Historic buildings, guided tours, nature trails around the property |
| Camp Manteno | A campground that appeals to families and groups. Visitors can enjoy outdoor activities, making it a great location for family gatherings and events. | Camp sites, hiking trails, campfire areas, community events |
| Manteno Antique Mall | A popular destination for antique lovers and shoppers. Guests seeking unique finds and local culture will enjoy staying nearby. | Antique shopping, local crafts, local eateries nearby |
| Manteno Park District Recreation Center | A family-friendly location offering recreational facilities and activities. A great choice for families traveling to the area. | sports fields, indoor swimming pool, fitness classes |
| Nearby Bourbonnais | Just a short drive from Manteno, Bourbonnais offers more dining and shopping options. Great for guests who want to explore a bit further while still being close to Manteno. | Bourbonnais Village Hall, Bourbonnais Historical Society, popular shopping centers |
| Local Festivals | Manteno hosts several local festivals throughout the year, drawing visitors from all over. Renting an Airbnb during these events ensures convenient access. | Manteno Music Festival, Manteno Pumpkin Festival, summer farmers market |
Understanding Airbnb License Requirements & STR Laws in Manteno (2025)
While Manteno, Illinois, United States currently shows low STR regulations, specific Airbnb license requirements might still exist or change. Always verify the latest short term rental regulations and Airbnb license requirements directly with local government authorities for Manteno to ensure full compliance before hosting.
(Source: AirROI data, 2025, finding no licensed listings among those analyzed)
Top Performing Airbnb Properties in Manteno (2025)
Benchmark your potential! Explore examples of top-performing Airbnb properties in Mantenobased on Trailing Twelve Month (TTM) revenue. Analyze their characteristics, revenue, occupancy rate, and ADR to understand what drives success in this market.
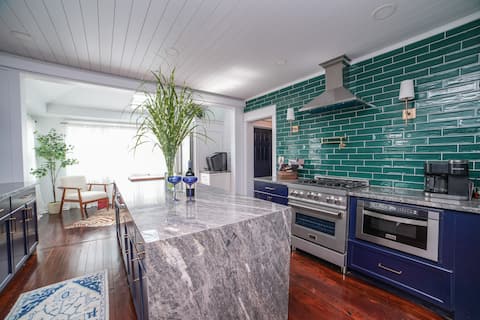
The White House
Entire Place • 4 bedrooms

Updated, bright, and modern, 3 bedroom home.
Entire Place • 3 bedrooms
Watertower Villa 2
Entire Place • 2 bedrooms

King-size beds ! All the luxeries of home!
Entire Place • 3 bedrooms
Newly renovated modern home.
Entire Place • 2 bedrooms

Awesome getaway! 2 king beds 3 large smart TVs.
Entire Place • 2 bedrooms
Note: Performance varies based on location, size, amenities, seasonality, and management quality. Data reflects the past 12 months.
Top Performing Airbnb Hosts in Manteno (2025)
Learn from the best! This table showcases top-performing Airbnb hosts in Manteno based on the number of properties managed and estimated total revenue over the past year. Analyze their scale and performance metrics.
| Host Name | Properties | Grossing Revenue | Stay Reviews | Avg Rating |
|---|---|---|---|---|
| Ami | 4 | $144,006 | 811 | 4.96/5.0 |
| Shawn | 3 | $130,596 | 234 | 4.99/5.0 |
| Burgandy | 1 | $59,860 | 15 | 4.93/5.0 |
| Sarah | 2 | $50,289 | 18 | 4.91/5.0 |
| Vera | 2 | $12,834 | 91 | 4.83/5.0 |
| Julie | 1 | $7,626 | 24 | 4.96/5.0 |
| Teri | 1 | $4,578 | 29 | 4.97/5.0 |
| Colleen | 3 | $3,755 | 25 | 4.94/5.0 |
Analyzing the strategies of top hosts, such as their property selection, pricing, and guest communication, can offer valuable lessons for optimizing your own Airbnb operations in Manteno.
Dive Deeper: Advanced Manteno STR Market Data (2025)
Ready to unlock more insights? AirROI provides access to advanced metrics and comprehensive Airbnb data for Manteno. Explore detailed analytics beyond this report to refine your investment strategy, optimize pricing, and maximize your vacation rental profits.
Explore Advanced MetricsManteno Short-Term Rental Market Composition (2025): Property & Room Types
Room Type Distribution
Property Type Distribution
Market Composition Insights for Manteno
- The Manteno Airbnb market composition is heavily skewed towards Entire Home/Apt listings, which make up 58.8% of the 17 active rentals. This indicates strong guest preference for privacy and space.
- However, a notable 41.2% share for Private Rooms suggests opportunities for budget-conscious travelers or hosts renting out spare rooms.
- Looking at the property type distribution in Manteno, House properties are the most common (88.2%), reflecting the local real estate landscape.
- Houses represent a significant 88.2% portion, catering likely to families or larger groups.
Manteno Airbnb Room Capacity Analysis (2025): Bedroom Distribution
Distribution of Listings by Number of Bedrooms
Room Capacity Insights for Manteno
- The dominant room capacity in Manteno is 2 bedrooms listings, making up 35.3% of the market. This suggests a strong demand for properties suitable for couples or solo travelers.
- Together, 2 bedrooms and 3 bedrooms properties represent 58.8% of the active Airbnb listings in Manteno, indicating a high concentration in these sizes.
- A significant 35.3% of listings offer 3+ bedrooms, catering to larger groups and families seeking more space in Manteno.
Manteno Vacation Rental Guest Capacity Trends (2025)
Distribution of Listings by Guest Capacity
Guest Capacity Insights for Manteno
- The most common guest capacity trend in Manteno vacation rentals is listings accommodating 6 guests (41.2%). This suggests the primary traveler segment is likely larger groups.
- Properties designed for 6 guests and 8+ guests dominate the Manteno STR market, accounting for 58.8% of listings.
- 58.8% of properties accommodate 6+ guests, serving the market segment for larger families or group travel in Manteno.
- On average, properties in Manteno are equipped to host 3.9 guests.
Manteno Airbnb Booking Patterns (2025): Available vs. Booked Days
Available Days Distribution
Booked Days Distribution
Booking Pattern Insights for Manteno
- The most common availability pattern in Manteno falls within the 91-180 days range, representing 41.2% of listings. This suggests many properties have significant open periods on their calendars.
- Approximately 41.2% of listings show high availability (181+ days open annually), indicating potential for increased bookings or specific owner usage patterns.
- For booked days, the 181-270 days range is most frequent in Manteno (41.2%), reflecting common guest stay durations or potential owner blocking patterns.
- A notable 58.8% of properties secure long booking periods (181+ days booked per year), highlighting successful long-term rental strategies or significant owner usage.
Manteno Airbnb Minimum Stay Requirements Analysis
Distribution of Listings by Minimum Night Requirement
1 Night
13 listings
81.3% of total
2 Nights
3 listings
18.8% of total
Key Insights
- The most prevalent minimum stay requirement in Manteno is 1 Night, adopted by 81.3% of listings. This highlights the market's preference for shorter, flexible bookings.
- A strong majority (100.1%) of the Manteno Airbnb data shows acceptance of very short stays (1-2 nights), indicating a dynamic, high-turnover market.
Recommendations
- Align with the market by considering a 1 Night minimum stay, as 81.3% of Manteno hosts use this setting.
- Adjust minimum nights based on seasonality – potentially shorter during low season and longer during peak demand periods in Manteno.
Manteno Airbnb Cancellation Policy Trends Analysis (2025)
Flexible
10 listings
62.5% of total
Moderate
5 listings
31.3% of total
Firm
1 listings
6.3% of total
Cancellation Policy Insights for Manteno
- The prevailing Airbnb cancellation policy trend in Manteno is Flexible, used by 62.5% of listings.
- The market strongly favors guest-friendly terms, with 93.8% of listings offering Flexible or Moderate policies. This suggests guests in Manteno may expect booking flexibility.
Recommendations for Hosts
- Consider adopting a Flexible policy to align with the 62.5% market standard in Manteno.
- Given the high prevalence of Flexible policies (62.5%), offering this can enhance booking appeal, especially during shoulder seasons.
- Regularly review your cancellation policy against competitors and market demand shifts in Manteno.
Manteno STR Booking Lead Time Analysis (2025)
Average Booking Lead Time by Month
Booking Lead Time Insights for Manteno
- The overall average booking lead time for vacation rentals in Manteno is 30 days.
- Guests book furthest in advance for stays during June (average 52 days), likely coinciding with peak travel demand or local events.
- The shortest booking windows occur for stays in February (average 19 days), indicating more last-minute travel plans during this time.
- Seasonally, Summer (48 days avg.) sees the longest lead times, while Winter (26 days avg.) has the shortest, reflecting typical travel planning cycles.
Recommendations for Hosts
- Use the overall average lead time (30 days) as a baseline for your pricing and availability strategy in Manteno.
- For June stays, consider implementing length-of-stay discounts or slightly higher rates for bookings made less than 52 days out to capitalize on advance planning.
- Target marketing efforts for the Summer season well in advance (at least 48 days) to capture early planners.
- Monitor your own booking lead times against these Manteno averages to identify opportunities for dynamic pricing adjustments.
Popular & Essential Airbnb Amenities in Manteno (2025)
Amenity Prevalence
Amenity Insights for Manteno
- Essential amenities in Manteno that guests expect include: Heating, Hair dryer, Kitchen, Smoke alarm, First aid kit, Air conditioning, Carbon monoxide alarm. Lacking these (any) could significantly impact bookings.
- Popular amenities like Washer, Fire extinguisher, Dedicated workspace are common but not universal. Offering these can provide a competitive edge.
Recommendations for Hosts
- Ensure your listing includes all essential amenities for Manteno: Heating, Hair dryer, Kitchen, Smoke alarm, First aid kit, Air conditioning, Carbon monoxide alarm.
- Consider adding popular differentiators like Washer or Fire extinguisher to increase appeal.
- Highlight unique or less common amenities you offer (e.g., hot tub, dedicated workspace, EV charger) in your listing description and photos.
- Regularly check competitor amenities in Manteno to stay competitive.
Manteno Airbnb Guest Demographics & Profile Analysis (2025)
Guest Profile Summary for Manteno
- The typical guest profile for Airbnb in Manteno consists of primarily domestic travelers (97%), often arriving from nearby Chicago, typically belonging to the Post-2000s (Gen Z/Alpha) group (50%), primarily speaking English or Spanish.
- Domestic travelers account for 97.1% of guests.
- Key international markets include United States (97.1%) and Hungary (0.5%).
- Top languages spoken are English (81.5%) followed by Spanish (13%).
- A significant demographic segment is the Post-2000s (Gen Z/Alpha) group, representing 50% of guests.
Recommendations for Hosts
- Target domestic marketing efforts towards travelers from Chicago and Wimauma.
- Tailor amenities and listing descriptions to appeal to the dominant Post-2000s (Gen Z/Alpha) demographic (e.g., highlight fast WiFi, smart home features, local guides).
- Highlight unique local experiences or amenities relevant to the primary guest profile.
- Consider seasonal promotions aligned with peak travel times for key origin markets.
Nearby Short-Term Rental Market Comparison
How does the Manteno Airbnb market stack up against its neighbors? Compare key performance metrics like average monthly revenue, ADR, and occupancy rates in surrounding areas to understand the broader regional STR landscape.
| Market | Active Properties | Monthly Revenue | Daily Rate | Avg. Occupancy |
|---|---|---|---|---|
| Town of Sugar Creek | 17 | $8,213 | $658.36 | 50% |
| Twin Lakes | 26 | $6,719 | $515.43 | 45% |
| Fennville | 10 | $5,326 | $372.77 | 44% |
| Saugatuck Township | 140 | $5,282 | $462.94 | 43% |
| Laketown Township | 62 | $5,207 | $457.63 | 45% |
| Port Sheldon Township | 27 | $5,185 | $511.35 | 52% |
| Lake Geneva | 167 | $4,958 | $408.65 | 44% |
| Lake Villa | 10 | $4,889 | $294.85 | 57% |
| McHenry | 31 | $4,820 | $436.41 | 44% |
| New Buffalo Township | 253 | $4,731 | $602.57 | 36% |