Kurtistown Airbnb Market Analysis 2025: Short Term Rental Data & Vacation Rental Statistics in Hawaii, United States
Is Airbnb profitable in Kurtistown in 2025? Explore comprehensive Airbnb analytics for Kurtistown, Hawaii, United States to uncover income potential. This 2025 STR market report for Kurtistown, based on AirROI data from April 2024 to March 2025, reveals key trends in the niche market of 17 active listings.
Whether you're considering an Airbnb investment in Kurtistown, optimizing your existing vacation rental, or exploring rental arbitrage opportunities, understanding the Kurtistown Airbnb data is crucial. Understanding the local regulations is key to maximizing your short term rental income potential. Let's dive into the specifics.
Key Kurtistown Airbnb Performance Metrics Overview
Monthly Airbnb Revenue Variations & Income Potential in Kurtistown (2025)
Understanding the monthly revenue variations for Airbnb listings in Kurtistown is key to maximizing your short term rental income potential. Seasonality significantly impacts earnings. Our analysis, based on data from the past 12 months, shows that the peak revenue month for STRs in Kurtistown is typically January, while November often presents the lowest earnings, highlighting opportunities for strategic pricing adjustments during shoulder and low seasons. Explore the typical Airbnb income in Kurtistown across different performance tiers:
- Best-in-class properties (Top 10%) achieve $4,566+ monthly, often utilizing dynamic pricing and superior guest experiences.
- Strong performing properties (Top 25%) earn $3,493 or more, indicating effective management and desirable locations/amenities.
- Typical properties (Median) generate around $2,340 per month, representing the average market performance.
- Entry-level properties (Bottom 25%) see earnings around $889, often with potential for optimization.
Average Monthly Airbnb Earnings Trend in Kurtistown
Kurtistown Airbnb Occupancy Rate Trends (2025)
Maximize your bookings by understanding the Kurtistown STR occupancy trends. Seasonal demand shifts significantly influence how often properties are booked. Typically, Octobersees the highest demand (peak season occupancy), while June experiences the lowest (low season). Effective strategies, like adjusting minimum stays or offering promotions, can boost occupancy during slower periods. Here's how different property tiers perform in Kurtistown:
- Best-in-class properties (Top 10%) achieve 89%+ occupancy, indicating high desirability and potentially optimized availability.
- Strong performing properties (Top 25%) maintain 76% or higher occupancy, suggesting good market fit and guest satisfaction.
- Typical properties (Median) have an occupancy rate around 54%.
- Entry-level properties (Bottom 25%) average 24% occupancy, potentially facing higher vacancy.
Average Monthly Occupancy Rate Trend in Kurtistown
Average Daily Rate (ADR) Airbnb Trends in Kurtistown (2025)
Effective short term rental pricing strategy in Kurtistown involves understanding monthly ADR fluctuations. The Average Daily Rate (ADR) for Airbnb in Kurtistown typically peaks in January and dips lowest during September. Leveraging Airbnb dynamic pricing tools or strategies based on this seasonality can significantly boost revenue. Here's a look at the typical nightly rates achieved:
- Best-in-class properties (Top 10%) command rates of $191+ per night, often due to premium features or locations.
- Strong performing properties (Top 25%) achieve nightly rates of $167 or more.
- Typical properties (Median) charge around $118 per night.
- Entry-level properties (Bottom 25%) earn around $95 per night.
Average Daily Rate (ADR) Trend by Month in Kurtistown
Get Live Kurtistown Market Intelligence 👇

Explore Real-time Analytics
Airbnb Seasonality Analysis & Trends in Kurtistown (2025)
Peak Season (January, April, July)
- Revenue averages $2,754 per month
- Occupancy rates average 55.9%
- Daily rates average $134
Shoulder Season
- Revenue averages $2,391 per month
- Occupancy maintains around 51.4%
- Daily rates hold near $129
Low Season (September, November, December)
- Revenue drops to average $2,096 per month
- Occupancy decreases to average 51.3%
- Daily rates adjust to average $131
Seasonality Insights for Kurtistown
- The Airbnb seasonality in Kurtistown shows moderate seasonality with distinct peak and low periods. While the sections above show seasonal averages, it's also insightful to look at the extremes:
- During the high season, the absolute peak month showcases Kurtistown's highest earning potential, with monthly revenues capable of climbing to $2,910, occupancy reaching a high of 63.3%, and ADRs peaking at $144.
- Conversely, the slowest single month of the year, typically falling within the low season, marks the market's lowest point. In this month, revenue might dip to $1,970, occupancy could drop to 41.7%, and ADRs may adjust down to $125.
- Understanding both the seasonal averages and these monthly peaks and troughs in revenue, occupancy, and ADR is crucial for maximizing your Airbnb profit potential in Kurtistown.
Seasonal Strategies for Maximizing Profit
- Peak Season: Maximize revenue through premium pricing and potentially longer minimum stays. Ensure high availability.
- Low Season: Offer competitive pricing, special promotions (e.g., extended stay discounts), and flexible cancellation policies. Target off-season travelers like remote workers or budget-conscious guests.
- Shoulder Seasons: Implement dynamic pricing that balances peak and low rates. Target weekend travelers or specific events. Offer slightly more flexible terms than peak season.
- Regularly analyze your own performance against these Kurtistown seasonality benchmarks and adjust your pricing and availability strategy accordingly.
Best Areas for Airbnb Investment in Kurtistown (2025)
Exploring the top neighborhoods for short-term rentals in Kurtistown? This section highlights key areas, outlining why they are attractive for hosts and guests, along with notable local attractions. Consider these locations based on your target guest profile and investment strategy.
| Neighborhood / Area | Why Host Here? (Target Guests & Appeal) | Key Attractions & Landmarks |
|---|---|---|
| Volcano Village | Quaint and rustic area close to Hawaii Volcanoes National Park. Great for nature lovers, hikers, and those seeking an adventurous vacation. | Hawaii Volcanoes National Park, Thurston Lava Tube, Kīlauea Visitor Center, Volcano Art Center, Akatsuka Orchid Gardens |
| Hilo | The largest town on the Big Island, known for its rich culture and lush landscapes. A hub for travelers looking to experience local Hawaiian life. | Liliuokalani Gardens, Hilo Farmers Market, Rainbow Falls, Pacific Tsunami Museum, Mauna Loa Observatory |
| Pahoa | A charming small town with an artsy vibe, popular among those looking for a unique and eclectic experience in Hawaii. | Pahoa Village Park, Ahalanui Park, Black Sand Beach at Isaac Hale Beach Park, Lava Tree State Monument, Kehena Black Sand Beach |
| Captain Cook | Beautiful coastal area known for its coffee farms and marine life, ideal for guests seeking a more rural Hawaiian experience. | Greenwell Farms, Pu'uhonua o Honaunau National Historical Park, Kealakekua Bay, Ka Lae, Honaunau Bay |
| Kailua-Kona | Popular tourist destination on the west coast known for its beaches, resorts, and vibrant nightlife. Perfect for upscale short-term rentals. | Kona Coffee Living History Farm, Kailua Bay, Magic Sands Beach, Hulihee Palace, Alii Drive |
| Waimea | A rural town known for its equestrian culture and lush landscapes. Attracts guests interested in Hawaii's natural beauty and agriculture. | Parker Ranch, Waimea Park, Waimea Plains, Hawai'i Tropical Botanical Garden, Pololu Valley Lookout |
| Punalu'u | Home to the famous black sand beach, ideal for those looking for a tranquil getaway in a picturesque setting. | Punalu'u Black Sand Beach, Punalu’u Beach Park, Hawai’i Volcanoes National Park, Ka Lae (South Point), Green Sand Beach at Papakolea |
| Hawaiian Paradise Park | A residential area with proximity to Hilo and beautiful ocean views, making it attractive for families looking for a quiet retreat. | Nearby beaches, Local parks, Scenic drives, Ocean views, Community center |
Understanding Airbnb License Requirements & STR Laws in Kurtistown (2025)
With 24% of listings showing registration in 2025, understanding potential Airbnb license requirements is crucial in Kurtistown. Always verify the latest short term rental regulations and Airbnb license requirements directly with local government authorities for Kurtistown to ensure full compliance before hosting.
(Source: AirROI data, 2025, based on 24% licensed listings)
Top Performing Airbnb Properties in Kurtistown (2025)
Benchmark your potential! Explore examples of top-performing Airbnb properties in Kurtistownbased on Trailing Twelve Month (TTM) revenue. Analyze their characteristics, revenue, occupancy rate, and ADR to understand what drives success in this market.
Big Island Bungalow Near Kilauea
Entire Place • 1 bedroom

Bamboo Bungalow
Entire Place • 1 bedroom

Great Location: Volcano to Hilo
Entire Place • 2 bedrooms
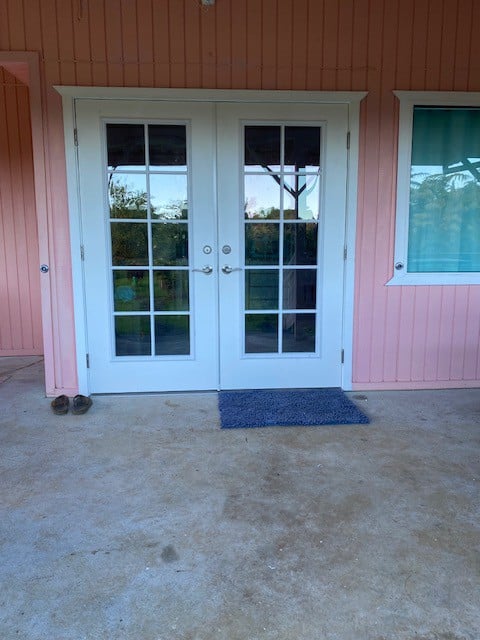
Koki Kottage. Central location for east Hawaii
Entire Place • N/A
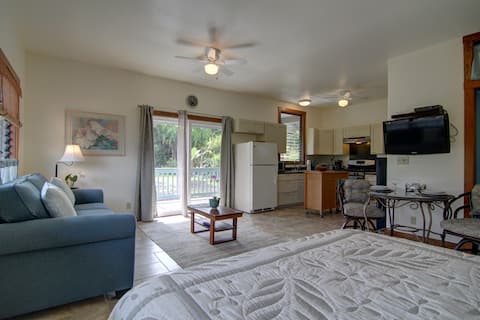
The Pink House Garden Level Suite
Entire Place • 1 bedroom
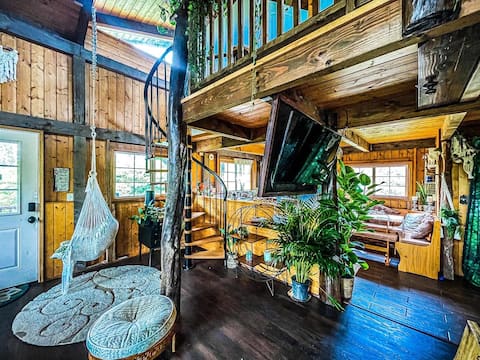
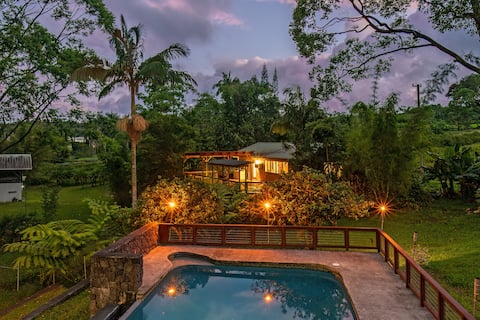
Rustic Relaxation Retreat Unique Fairytale Haven
Entire Place • 2 bedrooms
Note: Performance varies based on location, size, amenities, seasonality, and management quality. Data reflects the past 12 months.
Top Performing Airbnb Hosts in Kurtistown (2025)
Learn from the best! This table showcases top-performing Airbnb hosts in Kurtistown based on the number of properties managed and estimated total revenue over the past year. Analyze their scale and performance metrics.
| Host Name | Properties | Grossing Revenue | Stay Reviews | Avg Rating |
|---|---|---|---|---|
| Amber | 1 | $58,491 | 30 | 4.93/5.0 |
| Jeanine | 1 | $47,372 | 392 | 4.97/5.0 |
| Kerinne | 1 | $39,560 | 524 | 4.91/5.0 |
| Lori And Ken | 1 | $33,162 | 247 | 5.00/5.0 |
| Gregg | 1 | $32,011 | 18 | 4.83/5.0 |
| Byron | 2 | $25,771 | 20 | 4.90/5.0 |
| Amanda | 1 | $24,912 | 131 | 4.65/5.0 |
| Nick | 1 | $14,763 | 46 | 4.85/5.0 |
| Host #11574528 | 1 | $13,333 | 0 | 0.00/5.0 |
| Marisa | 1 | $13,071 | 28 | 4.93/5.0 |
Analyzing the strategies of top hosts, such as their property selection, pricing, and guest communication, can offer valuable lessons for optimizing your own Airbnb operations in Kurtistown.
Dive Deeper: Advanced Kurtistown STR Market Data (2025)
Ready to unlock more insights? AirROI provides access to advanced metrics and comprehensive Airbnb data for Kurtistown. Explore detailed analytics beyond this report to refine your investment strategy, optimize pricing, and maximize your vacation rental profits.
Explore Advanced MetricsKurtistown Short-Term Rental Market Composition (2025): Property & Room Types
Room Type Distribution
Property Type Distribution
Market Composition Insights for Kurtistown
- The Kurtistown Airbnb market composition is heavily skewed towards Entire Home/Apt listings, which make up 88.2% of the 17 active rentals. This indicates strong guest preference for privacy and space.
- Looking at the property type distribution in Kurtistown, Hotel/Boutique properties are the most common (47.1%), reflecting the local real estate landscape.
- Houses represent a significant 17.6% portion, catering likely to families or larger groups.
- The presence of 47.1% Hotel/Boutique listings indicates integration with traditional hospitality.
Kurtistown Airbnb Room Capacity Analysis (2025): Bedroom Distribution
Distribution of Listings by Number of Bedrooms
Room Capacity Insights for Kurtistown
- The dominant room capacity in Kurtistown is 2 bedrooms listings, making up 29.4% of the market. This suggests a strong demand for properties suitable for couples or solo travelers.
- Together, 2 bedrooms and 1 bedroom properties represent 52.9% of the active Airbnb listings in Kurtistown, indicating a high concentration in these sizes.
Kurtistown Vacation Rental Guest Capacity Trends (2025)
Distribution of Listings by Guest Capacity
Guest Capacity Insights for Kurtistown
- The most common guest capacity trend in Kurtistown vacation rentals is listings accommodating 4 guests (47.1%). This suggests the primary traveler segment is likely small families or groups.
- Properties designed for 4 guests and 2 guests dominate the Kurtistown STR market, accounting for 64.7% of listings.
- 23.6% of properties accommodate 6+ guests, serving the market segment for larger families or group travel in Kurtistown.
- On average, properties in Kurtistown are equipped to host 3.9 guests.
Kurtistown Airbnb Booking Patterns (2025): Available vs. Booked Days
Available Days Distribution
Booked Days Distribution
Booking Pattern Insights for Kurtistown
- The most common availability pattern in Kurtistown falls within the 271-366 days range, representing 58.8% of listings. This suggests many properties have significant open periods on their calendars.
- Approximately 64.7% of listings show high availability (181+ days open annually), indicating potential for increased bookings or specific owner usage patterns.
- For booked days, the 31-90 days range is most frequent in Kurtistown (52.9%), reflecting common guest stay durations or potential owner blocking patterns.
- A notable 35.2% of properties secure long booking periods (181+ days booked per year), highlighting successful long-term rental strategies or significant owner usage.
Kurtistown Airbnb Minimum Stay Requirements Analysis
Distribution of Listings by Minimum Night Requirement
1 Night
6 listings
35.3% of total
2 Nights
7 listings
41.2% of total
3 Nights
1 listings
5.9% of total
4-6 Nights
1 listings
5.9% of total
30+ Nights
2 listings
11.8% of total
Key Insights
- The most prevalent minimum stay requirement in Kurtistown is 2 Nights, adopted by 41.2% of listings. This highlights the market's preference for shorter, flexible bookings.
- A strong majority (76.5%) of the Kurtistown Airbnb data shows acceptance of very short stays (1-2 nights), indicating a dynamic, high-turnover market.
- A significant segment (11.8%) caters to monthly stays (30+ nights) in Kurtistown, pointing to opportunities in the extended-stay market.
Recommendations
- Align with the market by considering a 2 Nights minimum stay, as 41.2% of Kurtistown hosts use this setting.
- Explore offering discounts for stays of 30+ nights to attract the 11.8% of the market seeking extended stays.
- Adjust minimum nights based on seasonality – potentially shorter during low season and longer during peak demand periods in Kurtistown.
Kurtistown Airbnb Cancellation Policy Trends Analysis (2025)
Super Strict 30 Days
1 listings
6.7% of total
Flexible
2 listings
13.3% of total
Moderate
5 listings
33.3% of total
Firm
5 listings
33.3% of total
Strict
2 listings
13.3% of total
Cancellation Policy Insights for Kurtistown
- The prevailing Airbnb cancellation policy trend in Kurtistown is Moderate, used by 33.3% of listings.
- There's a relatively balanced mix between guest-friendly (46.6%) and stricter (46.6%) policies, offering choices for different guest needs.
Recommendations for Hosts
- Consider adopting a Moderate policy to align with the 33.3% market standard in Kurtistown.
- Using a Strict policy might deter some guests, as only 13.3% of listings use it. Evaluate if potential revenue protection outweighs possible lower booking rates.
- Regularly review your cancellation policy against competitors and market demand shifts in Kurtistown.
Kurtistown STR Booking Lead Time Analysis (2025)
Average Booking Lead Time by Month
Booking Lead Time Insights for Kurtistown
- The overall average booking lead time for vacation rentals in Kurtistown is 65 days.
- Guests book furthest in advance for stays during April (average 82 days), likely coinciding with peak travel demand or local events.
- The shortest booking windows occur for stays in March (average 44 days), indicating more last-minute travel plans during this time.
- Seasonally, Summer (74 days avg.) sees the longest lead times, while Spring (60 days avg.) has the shortest, reflecting typical travel planning cycles.
Recommendations for Hosts
- Use the overall average lead time (65 days) as a baseline for your pricing and availability strategy in Kurtistown.
- For April stays, consider implementing length-of-stay discounts or slightly higher rates for bookings made less than 82 days out to capitalize on advance planning.
- Target marketing efforts for the Summer season well in advance (at least 74 days) to capture early planners.
- Monitor your own booking lead times against these Kurtistown averages to identify opportunities for dynamic pricing adjustments.
Popular & Essential Airbnb Amenities in Kurtistown (2025)
Amenity Prevalence
Amenity Insights for Kurtistown
- Essential amenities in Kurtistown that guests expect include: Essentials, Free parking on premises, Wifi. Lacking these (any) could significantly impact bookings.
- Popular amenities like Coffee maker, Hangers, Hot water are common but not universal. Offering these can provide a competitive edge.
Recommendations for Hosts
- Ensure your listing includes all essential amenities for Kurtistown: Essentials, Free parking on premises, Wifi.
- Consider adding popular differentiators like Coffee maker or Hangers to increase appeal.
- Highlight unique or less common amenities you offer (e.g., hot tub, dedicated workspace, EV charger) in your listing description and photos.
- Regularly check competitor amenities in Kurtistown to stay competitive.
Kurtistown Airbnb Guest Demographics & Profile Analysis (2025)
Guest Profile Summary for Kurtistown
- The typical guest profile for Airbnb in Kurtistown consists of primarily domestic travelers (80%), often arriving from nearby Honolulu, typically belonging to the Post-2000s (Gen Z/Alpha) group (50%), primarily speaking English or Spanish.
- Domestic travelers account for 80.0% of guests.
- Key international markets include United States (80%) and Canada (3.7%).
- Top languages spoken are English (58.3%) followed by Spanish (8.9%).
- A significant demographic segment is the Post-2000s (Gen Z/Alpha) group, representing 50% of guests.
Recommendations for Hosts
- Target domestic marketing efforts towards travelers from Honolulu and Seattle.
- Tailor amenities and listing descriptions to appeal to the dominant Post-2000s (Gen Z/Alpha) demographic (e.g., highlight fast WiFi, smart home features, local guides).
- Highlight unique local experiences or amenities relevant to the primary guest profile.
- Consider seasonal promotions aligned with peak travel times for key origin markets.
Nearby Short-Term Rental Market Comparison
How does the Kurtistown Airbnb market stack up against its neighbors? Compare key performance metrics like average monthly revenue, ADR, and occupancy rates in surrounding areas to understand the broader regional STR landscape.
| Market | Active Properties | Monthly Revenue | Daily Rate | Avg. Occupancy |
|---|---|---|---|---|
| Nīnole | 10 | $10,470 | $1172.56 | 56% |
| Hana | 68 | $7,428 | $408.41 | 66% |
| Honalo | 22 | $7,294 | $405.37 | 59% |
| Waimea | 361 | $7,118 | $715.66 | 44% |
| Paia | 84 | $6,976 | $509.77 | 54% |
| Kula | 14 | $6,937 | $333.16 | 71% |
| Puakō | 63 | $6,697 | $669.64 | 47% |
| Waikoloa Beach Resort | 26 | $5,982 | $480.32 | 49% |
| Makawao | 20 | $5,793 | $405.16 | 51% |
| Kapalua | 311 | $5,555 | $669.55 | 38% |