Honomu Airbnb Market Analysis 2025: Short Term Rental Data & Vacation Rental Statistics in Hawaii, United States
Is Airbnb profitable in Honomu in 2025? Explore comprehensive Airbnb analytics for Honomu, Hawaii, United States to uncover income potential. This 2025 STR market report for Honomu, based on AirROI data from June 2024 to May 2025, reveals key trends in the niche market of 19 active listings.
Whether you're considering an Airbnb investment in Honomu, optimizing your existing vacation rental, or exploring rental arbitrage opportunities, understanding the Honomu Airbnb data is crucial. Navigating the high regulation landscape is key to maximizing your short term rental income potential. Let's dive into the specifics.
Key Honomu Airbnb Performance Metrics Overview
Monthly Airbnb Revenue Variations & Income Potential in Honomu (2025)
Understanding the monthly revenue variations for Airbnb listings in Honomu is key to maximizing your short term rental income potential. Seasonality significantly impacts earnings. Our analysis, based on data from the past 12 months, shows that the peak revenue month for STRs in Honomu is typically August, while November often presents the lowest earnings, highlighting opportunities for strategic pricing adjustments during shoulder and low seasons. Explore the typical Airbnb income in Honomu across different performance tiers:
- Best-in-class properties (Top 10%) achieve $8,044+ monthly, often utilizing dynamic pricing and superior guest experiences.
- Strong performing properties (Top 25%) earn $4,772 or more, indicating effective management and desirable locations/amenities.
- Typical properties (Median) generate around $3,050 per month, representing the average market performance.
- Entry-level properties (Bottom 25%) see earnings around $1,769, often with potential for optimization.
Average Monthly Airbnb Earnings Trend in Honomu
Honomu Airbnb Occupancy Rate Trends (2025)
Maximize your bookings by understanding the Honomu STR occupancy trends. Seasonal demand shifts significantly influence how often properties are booked. Typically, Decembersees the highest demand (peak season occupancy), while September experiences the lowest (low season). Effective strategies, like adjusting minimum stays or offering promotions, can boost occupancy during slower periods. Here's how different property tiers perform in Honomu:
- Best-in-class properties (Top 10%) achieve 79%+ occupancy, indicating high desirability and potentially optimized availability.
- Strong performing properties (Top 25%) maintain 61% or higher occupancy, suggesting good market fit and guest satisfaction.
- Typical properties (Median) have an occupancy rate around 42%.
- Entry-level properties (Bottom 25%) average 28% occupancy, potentially facing higher vacancy.
Average Monthly Occupancy Rate Trend in Honomu
Average Daily Rate (ADR) Airbnb Trends in Honomu (2025)
Effective short term rental pricing strategy in Honomu involves understanding monthly ADR fluctuations. The Average Daily Rate (ADR) for Airbnb in Honomu typically peaks in February and dips lowest during September. Leveraging Airbnb dynamic pricing tools or strategies based on this seasonality can significantly boost revenue. Here's a look at the typical nightly rates achieved:
- Best-in-class properties (Top 10%) command rates of $578+ per night, often due to premium features or locations.
- Strong performing properties (Top 25%) achieve nightly rates of $306 or more.
- Typical properties (Median) charge around $210 per night.
- Entry-level properties (Bottom 25%) earn around $150 per night.
Average Daily Rate (ADR) Trend by Month in Honomu
Get Live Honomu Market Intelligence 👇

Explore Real-time Analytics
Airbnb Seasonality Analysis & Trends in Honomu (2025)
Peak Season (August, July, December)
- Revenue averages $5,459 per month
- Occupancy rates average 50.8%
- Daily rates average $381
Shoulder Season
- Revenue averages $4,155 per month
- Occupancy maintains around 45.2%
- Daily rates hold near $454
Low Season (May, June, November)
- Revenue drops to average $3,295 per month
- Occupancy decreases to average 41.4%
- Daily rates adjust to average $417
Seasonality Insights for Honomu
- The Airbnb seasonality in Honomu shows moderate seasonality with distinct peak and low periods. While the sections above show seasonal averages, it's also insightful to look at the extremes:
- During the high season, the absolute peak month showcases Honomu's highest earning potential, with monthly revenues capable of climbing to $6,048, occupancy reaching a high of 53.7%, and ADRs peaking at $501.
- Conversely, the slowest single month of the year, typically falling within the low season, marks the market's lowest point. In this month, revenue might dip to $3,105, occupancy could drop to 34.2%, and ADRs may adjust down to $369.
- Understanding both the seasonal averages and these monthly peaks and troughs in revenue, occupancy, and ADR is crucial for maximizing your Airbnb profit potential in Honomu.
Seasonal Strategies for Maximizing Profit
- Peak Season: Maximize revenue through premium pricing and potentially longer minimum stays. Ensure high availability.
- Low Season: Offer competitive pricing, special promotions (e.g., extended stay discounts), and flexible cancellation policies. Target off-season travelers like remote workers or budget-conscious guests.
- Shoulder Seasons: Implement dynamic pricing that balances peak and low rates. Target weekend travelers or specific events. Offer slightly more flexible terms than peak season.
- Regularly analyze your own performance against these Honomu seasonality benchmarks and adjust your pricing and availability strategy accordingly.
Best Areas for Airbnb Investment in Honomu (2025)
Exploring the top neighborhoods for short-term rentals in Honomu? This section highlights key areas, outlining why they are attractive for hosts and guests, along with notable local attractions. Consider these locations based on your target guest profile and investment strategy.
| Neighborhood / Area | Why Host Here? (Target Guests & Appeal) | Key Attractions & Landmarks |
|---|---|---|
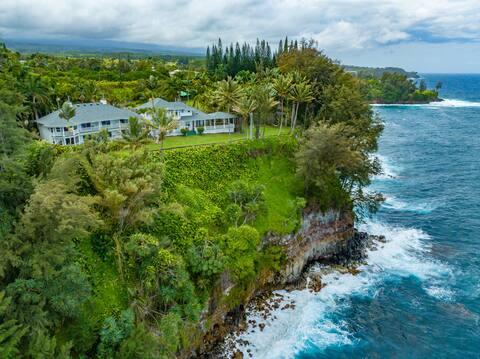
| Honomu | Charming small town near Hilo, known for its lush rainforests and close proximity to natural attractions. Ideal for guests looking for a relaxing stay in a beautiful setting, away from the hustle and bustle. | Akaka Falls State Park, Honomu Falls, Hilo's Bayfront, Rainbow Falls, Hilo Farmers Market, Big Island Candies |
| Akaka Falls | Famous for its stunning waterfall, Akaka Falls attracts nature lovers and photographers. Visitors come to hike and enjoy the scenic beauty, making it a prime location for vacation rentals. | Akaka Falls, Hiking Trails, Scenic Overlooks, Botanical Gardens |
| Hilo | The largest town on the Big Island, Hilo offers a variety of amenities, cultural attractions, and is a gateway to many natural wonders. It appeals to tourists looking for local experiences and convenience. | Liliuokalani Gardens, Hilo Farmers Market, Imiloa Astronomy Center, Pacific Tsunami Museum, Hilo Art Museum |
| Onomea Bay | Known for its beautiful coast and botanical gardens, Onomea Bay is ideal for guests wanting to experience Hawaii's natural beauty and serenity. Perfect for eco-tourism. | Onomea Bay Botanical Gardens, Scenic Coastal Views, Hiking Trails around the Coast, Wildlife Viewing |
| Pepeekeo | A small community known for its scenic views and quiet living. It attracts guests looking for a peaceful retreat close to nature, providing a rustic Hawaiian experience. | Pepeekeo Scenic Drive, Lush Landscapes, Local Craft Shops |
| Pahoa | A quirky town with a unique culture and access to the volcanic landscapes of the Big Island. A favored location for those eager to explore beyond typical tourist spots. | Pahoa Village, Green Lake, Kilauea Volcano, Hot Ponds |
| Kalapana | A small coastal community known for its unique black sand beaches and volcanic activity. Attracts adventurous travelers looking to explore Hawaii's dynamic landscapes. | Kaimu Black Sand Beach, Kalapana Lava Viewing Area, Historic Sites |
| Waimea | A picturesque town known for its ranching culture and proximity to beautiful parks. Ideal for families and those who want to experience the diversity of Hawaii. | Waimea Park, Parker Ranch, Pololu Valley Lookout |
Understanding Airbnb License Requirements & STR Laws in Honomu (2025)
Yes, Honomu, Hawaii, United States enforces high STR regulations. Obtaining a license and ensuring compliance is almost certainly required according to current 2025 STR laws. Always verify the latest short term rental regulations and Airbnb license requirements directly with local government authorities for Honomu to ensure full compliance before hosting.
(Source: AirROI data, 2025, based on 37% licensed listings)
Top Performing Airbnb Properties in Honomu (2025)
Benchmark your potential! Explore examples of top-performing Airbnb properties in Honomubased on Trailing Twelve Month (TTM) revenue. Analyze their characteristics, revenue, occupancy rate, and ADR to understand what drives success in this market.
Bliss Island Estate
Entire Place • 8 bedrooms
Luxury Ocean view Home near Akaka falls w/ Hot tub
Entire Place • 5 bedrooms

Honomu Place: Pool, Slide, Hot Tub, & Gym #*
Entire Place • 5 bedrooms

Heavenly Hawaii Retreat Home near Hilo &Waterfalls
Entire Place • 4 bedrooms

Honomū Haven *At the Gateway to 'Akaka Falls*
Entire Place • 5 bedrooms
Spectacular view and natural beauty
Entire Place • 3 bedrooms
Note: Performance varies based on location, size, amenities, seasonality, and management quality. Data reflects the past 12 months.
Top Performing Airbnb Hosts in Honomu (2025)
Learn from the best! This table showcases top-performing Airbnb hosts in Honomu based on the number of properties managed and estimated total revenue over the past year. Analyze their scale and performance metrics.
| Host Name | Properties | Grossing Revenue | Stay Reviews | Avg Rating |
|---|---|---|---|---|
| Host #495345281 | 1 | $143,695 | 0 | N/A/5.0 |
| Cody | 5 | $119,667 | 506 | 4.92/5.0 |
| Avani | 1 | $94,412 | 90 | 4.80/5.0 |
| Anthony | 1 | $82,463 | 133 | 4.83/5.0 |
| Jade | 1 | $79,721 | 77 | 4.91/5.0 |
| Ramona | 1 | $55,641 | 118 | 4.83/5.0 |
| Andrea | 1 | $54,795 | 126 | 4.92/5.0 |
| Host #151398424 | 1 | $37,529 | 1 | N/A/5.0 |
| Rick | 1 | $35,021 | 58 | 4.76/5.0 |
| Sam And Mari | 1 | $32,903 | 24 | 5.00/5.0 |
Analyzing the strategies of top hosts, such as their property selection, pricing, and guest communication, can offer valuable lessons for optimizing your own Airbnb operations in Honomu.
Dive Deeper: Advanced Honomu STR Market Data (2025)
Ready to unlock more insights? AirROI provides access to advanced metrics and comprehensive Airbnb data for Honomu. Explore detailed analytics beyond this report to refine your investment strategy, optimize pricing, and maximize your vacation rental profits.
Explore Advanced MetricsHonomu Short-Term Rental Market Composition (2025): Property & Room Types
Room Type Distribution
Property Type Distribution
Market Composition Insights for Honomu
- The Honomu Airbnb market composition is heavily skewed towards Entire Home/Apt listings, which make up 73.7% of the 19 active rentals. This indicates strong guest preference for privacy and space.
- Looking at the property type distribution in Honomu, House properties are the most common (52.6%), reflecting the local real estate landscape.
- Houses represent a significant 52.6% portion, catering likely to families or larger groups.
- The presence of 42.1% Hotel/Boutique listings indicates integration with traditional hospitality.
Honomu Airbnb Room Capacity Analysis (2025): Bedroom Distribution
Distribution of Listings by Number of Bedrooms
Room Capacity Insights for Honomu
- The dominant room capacity in Honomu is 1 bedroom listings, making up 42.1% of the market. This suggests a strong demand for properties suitable for couples or solo travelers.
- Together, 1 bedroom and 3 bedrooms properties represent 73.7% of the active Airbnb listings in Honomu, indicating a high concentration in these sizes.
- A significant 58.0% of listings offer 3+ bedrooms, catering to larger groups and families seeking more space in Honomu.
Honomu Vacation Rental Guest Capacity Trends (2025)
Distribution of Listings by Guest Capacity
Guest Capacity Insights for Honomu
- The most common guest capacity trend in Honomu vacation rentals is listings accommodating 8+ guests (31.6%). This suggests the primary traveler segment is likely larger groups.
- Properties designed for 8+ guests and 6 guests dominate the Honomu STR market, accounting for 57.9% of listings.
- 57.9% of properties accommodate 6+ guests, serving the market segment for larger families or group travel in Honomu.
- On average, properties in Honomu are equipped to host 5.2 guests.
Honomu Airbnb Booking Patterns (2025): Available vs. Booked Days
Available Days Distribution
Booked Days Distribution
Booking Pattern Insights for Honomu
- The most common availability pattern in Honomu falls within the 181-270 days range, representing 47.4% of listings. This suggests many properties have significant open periods on their calendars.
- Approximately 73.7% of listings show high availability (181+ days open annually), indicating potential for increased bookings or specific owner usage patterns.
- For booked days, the 91-180 days range is most frequent in Honomu (47.4%), reflecting common guest stay durations or potential owner blocking patterns.
- A notable 26.3% of properties secure long booking periods (181+ days booked per year), highlighting successful long-term rental strategies or significant owner usage.
Honomu Airbnb Minimum Stay Requirements Analysis
Distribution of Listings by Minimum Night Requirement
1 Night
8 listings
47.1% of total
2 Nights
3 listings
17.6% of total
3 Nights
2 listings
11.8% of total
30+ Nights
4 listings
23.5% of total
Key Insights
- The most prevalent minimum stay requirement in Honomu is 1 Night, adopted by 47.1% of listings. This highlights the market's preference for shorter, flexible bookings.
- A strong majority (64.7%) of the Honomu Airbnb data shows acceptance of very short stays (1-2 nights), indicating a dynamic, high-turnover market.
- A significant segment (23.5%) caters to monthly stays (30+ nights) in Honomu, pointing to opportunities in the extended-stay market.
Recommendations
- Align with the market by considering a 1 Night minimum stay, as 47.1% of Honomu hosts use this setting.
- Explore offering discounts for stays of 30+ nights to attract the 23.5% of the market seeking extended stays.
- Adjust minimum nights based on seasonality – potentially shorter during low season and longer during peak demand periods in Honomu.
Honomu Airbnb Cancellation Policy Trends Analysis (2025)
Flexible
3 listings
18.8% of total
Moderate
3 listings
18.8% of total
Firm
6 listings
37.5% of total
Strict
4 listings
25% of total
Cancellation Policy Insights for Honomu
- The prevailing Airbnb cancellation policy trend in Honomu is Firm, used by 37.5% of listings.
- A majority (62.5%) of hosts in Honomu utilize Firm or Strict policies, indicating a market where hosts prioritize booking security.
Recommendations for Hosts
- Consider adopting a Firm policy to align with the 37.5% market standard in Honomu.
- Regularly review your cancellation policy against competitors and market demand shifts in Honomu.
Honomu STR Booking Lead Time Analysis (2025)
Average Booking Lead Time by Month
Booking Lead Time Insights for Honomu
- The overall average booking lead time for vacation rentals in Honomu is 71 days.
- Guests book furthest in advance for stays during April (average 114 days), likely coinciding with peak travel demand or local events.
- The shortest booking windows occur for stays in September (average 47 days), indicating more last-minute travel plans during this time.
- Seasonally, Spring (84 days avg.) sees the longest lead times, while Fall (58 days avg.) has the shortest, reflecting typical travel planning cycles.
Recommendations for Hosts
- Use the overall average lead time (71 days) as a baseline for your pricing and availability strategy in Honomu.
- For April stays, consider implementing length-of-stay discounts or slightly higher rates for bookings made less than 114 days out to capitalize on advance planning.
- Target marketing efforts for the Spring season well in advance (at least 84 days) to capture early planners.
- Monitor your own booking lead times against these Honomu averages to identify opportunities for dynamic pricing adjustments.
Popular & Essential Airbnb Amenities in Honomu (2025)
Amenity Prevalence
Amenity Insights for Honomu
- Essential amenities in Honomu that guests expect include: Wifi. Lacking these (this) could significantly impact bookings.
- Popular amenities like Smoke alarm, TV, Free parking on premises are common but not universal. Offering these can provide a competitive edge.
Recommendations for Hosts
- Ensure your listing includes all essential amenities for Honomu: Wifi.
- Consider adding popular differentiators like Smoke alarm or TV to increase appeal.
- Highlight unique or less common amenities you offer (e.g., hot tub, dedicated workspace, EV charger) in your listing description and photos.
- Regularly check competitor amenities in Honomu to stay competitive.
Honomu Airbnb Guest Demographics & Profile Analysis (2025)
Guest Profile Summary for Honomu
- The typical guest profile for Airbnb in Honomu consists of primarily domestic travelers (89%), often arriving from nearby Seattle, typically belonging to the Post-2000s (Gen Z/Alpha) group (50%), primarily speaking English or Spanish.
- Domestic travelers account for 89.2% of guests.
- Key international markets include United States (89.2%) and Canada (3.6%).
- Top languages spoken are English (69.6%) followed by Spanish (9.6%).
- A significant demographic segment is the Post-2000s (Gen Z/Alpha) group, representing 50% of guests.
Recommendations for Hosts
- Target domestic marketing efforts towards travelers from Seattle and San Diego.
- Tailor amenities and listing descriptions to appeal to the dominant Post-2000s (Gen Z/Alpha) demographic (e.g., highlight fast WiFi, smart home features, local guides).
- Highlight unique local experiences or amenities relevant to the primary guest profile.
- Consider seasonal promotions aligned with peak travel times for key origin markets.
Nearby Short-Term Rental Market Comparison
How does the Honomu Airbnb market stack up against its neighbors? Compare key performance metrics like average monthly revenue, ADR, and occupancy rates in surrounding areas to understand the broader regional STR landscape.
| Market | Active Properties | Monthly Revenue | Daily Rate | Avg. Occupancy |
|---|---|---|---|---|
| Nīnole | 10 | $10,321 | $1210.58 | 52% |
| Honalo | 21 | $7,986 | $441.61 | 59% |
| Waimea | 363 | $7,592 | $763.62 | 45% |
| Hana | 71 | $7,339 | $416.89 | 64% |
| Waikoloa Beach Resort | 24 | $7,135 | $493.60 | 53% |
| Paia | 87 | $6,813 | $505.90 | 53% |
| Puakō | 65 | $6,748 | $677.26 | 46% |
| Kula | 15 | $6,635 | $334.65 | 68% |
| Kapalua | 322 | $6,202 | $722.31 | 39% |
| Makawao | 21 | $5,895 | $410.51 | 51% |