St. Cloud Airbnb Market Analysis 2025: Short Term Rental Data & Vacation Rental Statistics in Florida, United States
Is Airbnb profitable in St. Cloud in 2025? Explore comprehensive Airbnb analytics for St. Cloud, Florida, United States to uncover income potential. This 2025 STR market report for St. Cloud, based on AirROI data from April 2024 to March 2025, reveals key trends in the niche market of 31 active listings.
Whether you're considering an Airbnb investment in St. Cloud, optimizing your existing vacation rental, or exploring rental arbitrage opportunities, understanding the St. Cloud Airbnb data is crucial. Leveraging the low regulation environment is key to maximizing your short term rental income potential. Let's dive into the specifics.
Key St. Cloud Airbnb Performance Metrics Overview
Monthly Airbnb Revenue Variations & Income Potential in St. Cloud (2025)
Understanding the monthly revenue variations for Airbnb listings in St. Cloud is key to maximizing your short term rental income potential. Seasonality significantly impacts earnings. Our analysis, based on data from the past 12 months, shows that the peak revenue month for STRs in St. Cloud is typically April, while October often presents the lowest earnings, highlighting opportunities for strategic pricing adjustments during shoulder and low seasons. Explore the typical Airbnb income in St. Cloud across different performance tiers:
- Best-in-class properties (Top 10%) achieve $4,008+ monthly, often utilizing dynamic pricing and superior guest experiences.
- Strong performing properties (Top 25%) earn $2,687 or more, indicating effective management and desirable locations/amenities.
- Typical properties (Median) generate around $1,549 per month, representing the average market performance.
- Entry-level properties (Bottom 25%) see earnings around $850, often with potential for optimization.
Average Monthly Airbnb Earnings Trend in St. Cloud
St. Cloud Airbnb Occupancy Rate Trends (2025)
Maximize your bookings by understanding the St. Cloud STR occupancy trends. Seasonal demand shifts significantly influence how often properties are booked. Typically, Junesees the highest demand (peak season occupancy), while October experiences the lowest (low season). Effective strategies, like adjusting minimum stays or offering promotions, can boost occupancy during slower periods. Here's how different property tiers perform in St. Cloud:
- Best-in-class properties (Top 10%) achieve 83%+ occupancy, indicating high desirability and potentially optimized availability.
- Strong performing properties (Top 25%) maintain 69% or higher occupancy, suggesting good market fit and guest satisfaction.
- Typical properties (Median) have an occupancy rate around 48%.
- Entry-level properties (Bottom 25%) average 26% occupancy, potentially facing higher vacancy.
Average Monthly Occupancy Rate Trend in St. Cloud
Average Daily Rate (ADR) Airbnb Trends in St. Cloud (2025)
Effective short term rental pricing strategy in St. Cloud involves understanding monthly ADR fluctuations. The Average Daily Rate (ADR) for Airbnb in St. Cloud typically peaks in July and dips lowest during March. Leveraging Airbnb dynamic pricing tools or strategies based on this seasonality can significantly boost revenue. Here's a look at the typical nightly rates achieved:
- Best-in-class properties (Top 10%) command rates of $220+ per night, often due to premium features or locations.
- Strong performing properties (Top 25%) achieve nightly rates of $154 or more.
- Typical properties (Median) charge around $94 per night.
- Entry-level properties (Bottom 25%) earn around $62 per night.
Average Daily Rate (ADR) Trend by Month in St. Cloud
Get Live St. Cloud Market Intelligence 👇

Explore Real-time Analytics
Airbnb Seasonality Analysis & Trends in St. Cloud (2025)
Peak Season (April, June, May)
- Revenue averages $2,789 per month
- Occupancy rates average 57.4%
- Daily rates average $133
Shoulder Season
- Revenue averages $1,852 per month
- Occupancy maintains around 48.4%
- Daily rates hold near $124
Low Season (August, September, October)
- Revenue drops to average $1,354 per month
- Occupancy decreases to average 39.0%
- Daily rates adjust to average $132
Seasonality Insights for St. Cloud
- The Airbnb seasonality in St. Cloud shows highly seasonal trends requiring careful strategy. While the sections above show seasonal averages, it's also insightful to look at the extremes:
- During the high season, the absolute peak month showcases St. Cloud's highest earning potential, with monthly revenues capable of climbing to $3,004, occupancy reaching a high of 65.8%, and ADRs peaking at $134.
- Conversely, the slowest single month of the year, typically falling within the low season, marks the market's lowest point. In this month, revenue might dip to $1,274, occupancy could drop to 37.0%, and ADRs may adjust down to $118.
- Understanding both the seasonal averages and these monthly peaks and troughs in revenue, occupancy, and ADR is crucial for maximizing your Airbnb profit potential in St. Cloud.
Seasonal Strategies for Maximizing Profit
- Peak Season: Maximize revenue through premium pricing and potentially longer minimum stays. Ensure high availability.
- Low Season: Offer competitive pricing, special promotions (e.g., extended stay discounts), and flexible cancellation policies. Target off-season travelers like remote workers or budget-conscious guests.
- Shoulder Seasons: Implement dynamic pricing that balances peak and low rates. Target weekend travelers or specific events. Offer slightly more flexible terms than peak season.
- Regularly analyze your own performance against these St. Cloud seasonality benchmarks and adjust your pricing and availability strategy accordingly.
Best Areas for Airbnb Investment in St. Cloud (2025)
Exploring the top neighborhoods for short-term rentals in St. Cloud? This section highlights key areas, outlining why they are attractive for hosts and guests, along with notable local attractions. Consider these locations based on your target guest profile and investment strategy.
| Neighborhood / Area | Why Host Here? (Target Guests & Appeal) | Key Attractions & Landmarks |
|---|---|---|
| Cypress Lake | A scenic area known for its beautiful lakes and nature parks, ideal for families and outdoor enthusiasts. Offers a mix of recreational activities and relaxation close to local attractions. | Cypress Lake Park, Lakefront Park, St. Cloud Heritage Museum, Canoeing and kayaking opportunities, Fishing spots on Lake Tohopekaliga |
| Downtown St. Cloud | The vibrant heart of St. Cloud offers a mix of shopping, dining, and entertainment options. A great location for visitors wanting to experience the local culture and community events. | St. Cloud City Hall, Historic Downtown St. Cloud, restaurants and cafes, local shops, St. Cloud Community Center |
| Harmony | A new community focused on sustainability and outdoor living, Harmony is perfect for eco-tourists and families. The area features walking trails, parks, and lakes. | Harmony Town Square, Harmony Conservation Area, peaceful parks, nature trails, vibrant community events |
| Lakefront District | This charming area offers lakeside accommodations and proximity to recreational activities. Ideal for those looking to relax by the water or enjoy outdoor sports. | Lake Tohopekaliga, boating and fishing, parks and picnic areas, walking trails, sunset views |
| Civic Center | Close to the major civic activities and events in the city, the Civic Center area is great for visitors attending conferences or community gatherings. | St. Cloud Civic Center, community events, local festivals, theater events, conferences |
| Pleasant Hill | A family-friendly neighborhood with parks and schools, ideal for longer stays by families or groups visiting the area. | Pleasant Hill Park, local playgrounds, community events, family-friendly restaurants, easy access to local amenities |
| Gary's Place | A popular area known for its eclectic mix of dining and entertainment, attracting a younger crowd and those looking for a lively atmosphere. | local bars and restaurants, live music venues, public events, festivals, nightlife options |
| Poinciana Boulevard | A major thoroughfare connecting visitors to various attractions around St. Cloud, making it an accessible location for those wanting to explore nearby areas. | shopping centers, restaurants, easy access to Orlando attractions, public transport options, local attractions nearby |
Understanding Airbnb License Requirements & STR Laws in St. Cloud (2025)
While St. Cloud, Florida, United States currently shows low STR regulations, specific Airbnb license requirements might still exist or change. Always verify the latest short term rental regulations and Airbnb license requirements directly with local government authorities for St. Cloud to ensure full compliance before hosting.
(Source: AirROI data, 2025, finding no licensed listings among those analyzed)
Top Performing Airbnb Properties in St. Cloud (2025)
Benchmark your potential! Explore examples of top-performing Airbnb properties in St. Cloudbased on Trailing Twelve Month (TTM) revenue. Analyze their characteristics, revenue, occupancy rate, and ADR to understand what drives success in this market.
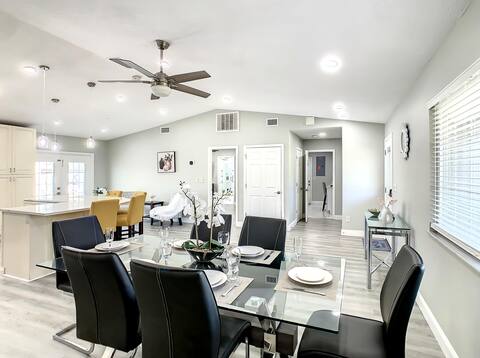
Pool House in a Quiet Area, Disney Universal
Entire Place • 3 bedrooms
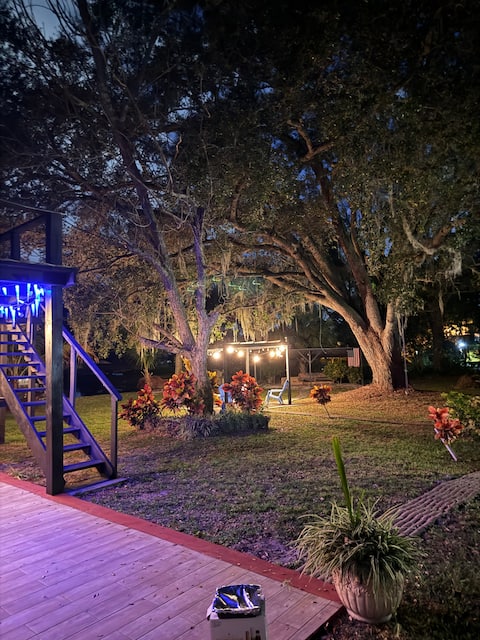
Paradise Retreat - St. Cloud, FL
Entire Place • 4 bedrooms

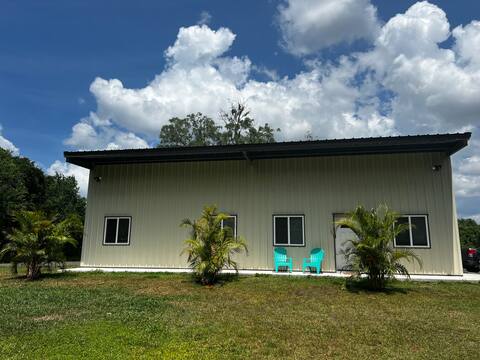
With tree house, Surprising Tropical-style resort
Entire Place • 6 bedrooms
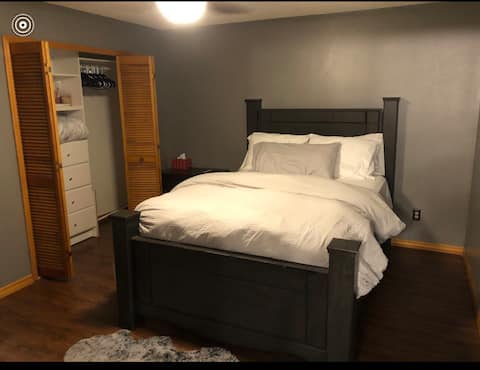
Country Guesthouse
Entire Place • 2 bedrooms
A magical stay in Saint Cloud
Entire Place • 3 bedrooms
A Getaway Home in The Clouds
Entire Place • 4 bedrooms
Note: Performance varies based on location, size, amenities, seasonality, and management quality. Data reflects the past 12 months.
Top Performing Airbnb Hosts in St. Cloud (2025)
Learn from the best! This table showcases top-performing Airbnb hosts in St. Cloud based on the number of properties managed and estimated total revenue over the past year. Analyze their scale and performance metrics.
| Host Name | Properties | Grossing Revenue | Stay Reviews | Avg Rating |
|---|---|---|---|---|
| Sreedevi | 1 | $51,356 | 115 | 4.93/5.0 |
| Cheryl | 2 | $44,858 | 762 | 4.95/5.0 |
| Sandra & Ram | 1 | $44,582 | 10 | 4.70/5.0 |
| Broad | 1 | $40,701 | 53 | 4.89/5.0 |
| Fernnanda | 1 | $27,998 | 19 | 4.95/5.0 |
| Zachary | 1 | $27,834 | 45 | 4.98/5.0 |
| James | 1 | $24,478 | 5 | 4.60/5.0 |
| Aparna | 1 | $23,473 | 48 | 4.77/5.0 |
| William | 2 | $19,965 | 38 | 4.89/5.0 |
| Ana | 2 | $19,842 | 15 | 2.50/5.0 |
Analyzing the strategies of top hosts, such as their property selection, pricing, and guest communication, can offer valuable lessons for optimizing your own Airbnb operations in St. Cloud.
Dive Deeper: Advanced St. Cloud STR Market Data (2025)
Ready to unlock more insights? AirROI provides access to advanced metrics and comprehensive Airbnb data for St. Cloud. Explore detailed analytics beyond this report to refine your investment strategy, optimize pricing, and maximize your vacation rental profits.
Explore Advanced MetricsSt. Cloud Short-Term Rental Market Composition (2025): Property & Room Types
Room Type Distribution
Property Type Distribution
Market Composition Insights for St. Cloud
- The St. Cloud Airbnb market composition is heavily skewed towards Entire Home/Apt listings, which make up 77.4% of the 31 active rentals. This indicates strong guest preference for privacy and space.
- Looking at the property type distribution in St. Cloud, House properties are the most common (61.3%), reflecting the local real estate landscape.
- Houses represent a significant 61.3% portion, catering likely to families or larger groups.
- The presence of 12.9% Hotel/Boutique listings indicates integration with traditional hospitality.
- Smaller segments like apartment/condo (combined 3.2%) offer potential for unique stay experiences.
St. Cloud Airbnb Room Capacity Analysis (2025): Bedroom Distribution
Distribution of Listings by Number of Bedrooms
Room Capacity Insights for St. Cloud
- The dominant room capacity in St. Cloud is 1 bedroom listings, making up 51.6% of the market. This suggests a strong demand for properties suitable for couples or solo travelers.
- Together, 1 bedroom and 3 bedrooms properties represent 67.7% of the active Airbnb listings in St. Cloud, indicating a high concentration in these sizes.
- With over half the market (51.6%) consisting of studios or 1-bedroom units, St. Cloud is particularly well-suited for individuals or couples.
- A significant 29.1% of listings offer 3+ bedrooms, catering to larger groups and families seeking more space in St. Cloud.
St. Cloud Vacation Rental Guest Capacity Trends (2025)
Distribution of Listings by Guest Capacity
Guest Capacity Insights for St. Cloud
- The most common guest capacity trend in St. Cloud vacation rentals is listings accommodating 2 guests (32.3%). This suggests the primary traveler segment is likely couples or solo travelers.
- Properties designed for 2 guests and 8+ guests dominate the St. Cloud STR market, accounting for 48.4% of listings.
- 25.8% of properties accommodate 6+ guests, serving the market segment for larger families or group travel in St. Cloud.
- On average, properties in St. Cloud are equipped to host 3.9 guests.
St. Cloud Airbnb Booking Patterns (2025): Available vs. Booked Days
Available Days Distribution
Booked Days Distribution
Booking Pattern Insights for St. Cloud
- The most common availability pattern in St. Cloud falls within the 271-366 days range, representing 35.5% of listings. This suggests many properties have significant open periods on their calendars.
- Approximately 67.8% of listings show high availability (181+ days open annually), indicating potential for increased bookings or specific owner usage patterns.
- For booked days, the 91-180 days range is most frequent in St. Cloud (35.5%), reflecting common guest stay durations or potential owner blocking patterns.
- A notable 32.2% of properties secure long booking periods (181+ days booked per year), highlighting successful long-term rental strategies or significant owner usage.
St. Cloud Airbnb Minimum Stay Requirements Analysis
Distribution of Listings by Minimum Night Requirement
1 Night
12 listings
44.4% of total
2 Nights
12 listings
44.4% of total
3 Nights
1 listings
3.7% of total
4-6 Nights
1 listings
3.7% of total
30+ Nights
1 listings
3.7% of total
Key Insights
- The most prevalent minimum stay requirement in St. Cloud is 1 Night, adopted by 44.4% of listings. This highlights the market's preference for shorter, flexible bookings.
- A strong majority (88.8%) of the St. Cloud Airbnb data shows acceptance of very short stays (1-2 nights), indicating a dynamic, high-turnover market.
Recommendations
- Align with the market by considering a 1 Night minimum stay, as 44.4% of St. Cloud hosts use this setting.
- Adjust minimum nights based on seasonality – potentially shorter during low season and longer during peak demand periods in St. Cloud.
St. Cloud Airbnb Cancellation Policy Trends Analysis (2025)
Super Strict 60 Days
1 listings
4.8% of total
Flexible
5 listings
23.8% of total
Moderate
5 listings
23.8% of total
Firm
6 listings
28.6% of total
Strict
4 listings
19% of total
Cancellation Policy Insights for St. Cloud
- The prevailing Airbnb cancellation policy trend in St. Cloud is Firm, used by 28.6% of listings.
- There's a relatively balanced mix between guest-friendly (47.6%) and stricter (47.6%) policies, offering choices for different guest needs.
Recommendations for Hosts
- Consider adopting a Firm policy to align with the 28.6% market standard in St. Cloud.
- Regularly review your cancellation policy against competitors and market demand shifts in St. Cloud.
St. Cloud STR Booking Lead Time Analysis (2025)
Average Booking Lead Time by Month
Booking Lead Time Insights for St. Cloud
- The overall average booking lead time for vacation rentals in St. Cloud is 38 days.
- Guests book furthest in advance for stays during April (average 59 days), likely coinciding with peak travel demand or local events.
- The shortest booking windows occur for stays in September (average 24 days), indicating more last-minute travel plans during this time.
- Seasonally, Spring (39 days avg.) sees the longest lead times, while Fall (35 days avg.) has the shortest, reflecting typical travel planning cycles.
Recommendations for Hosts
- Use the overall average lead time (38 days) as a baseline for your pricing and availability strategy in St. Cloud.
- For April stays, consider implementing length-of-stay discounts or slightly higher rates for bookings made less than 59 days out to capitalize on advance planning.
- Target marketing efforts for the Spring season well in advance (at least 39 days) to capture early planners.
- Monitor your own booking lead times against these St. Cloud averages to identify opportunities for dynamic pricing adjustments.
Popular & Essential Airbnb Amenities in St. Cloud (2025)
Amenity Prevalence
Amenity Insights for St. Cloud
- Essential amenities in St. Cloud that guests expect include: Air conditioning, Wifi, Smoke alarm, Free parking on premises, Hot water. Lacking these (any) could significantly impact bookings.
- Popular amenities like TV, Carbon monoxide alarm, Essentials are common but not universal. Offering these can provide a competitive edge.
Recommendations for Hosts
- Ensure your listing includes all essential amenities for St. Cloud: Air conditioning, Wifi, Smoke alarm, Free parking on premises, Hot water.
- Prioritize adding missing essentials: Free parking on premises, Hot water.
- Consider adding popular differentiators like TV or Carbon monoxide alarm to increase appeal.
- Highlight unique or less common amenities you offer (e.g., hot tub, dedicated workspace, EV charger) in your listing description and photos.
- Regularly check competitor amenities in St. Cloud to stay competitive.
St. Cloud Airbnb Guest Demographics & Profile Analysis (2025)
Guest Profile Summary for St. Cloud
- The typical guest profile for Airbnb in St. Cloud consists of primarily domestic travelers (91%), often arriving from nearby Orlando, typically belonging to the Post-2000s (Gen Z/Alpha) group (50%), primarily speaking English or Spanish.
- Domestic travelers account for 91.2% of guests.
- Key international markets include United States (91.2%) and Canada (1.8%).
- Top languages spoken are English (70.9%) followed by Spanish (22.8%).
- A significant demographic segment is the Post-2000s (Gen Z/Alpha) group, representing 50% of guests.
Recommendations for Hosts
- Target domestic marketing efforts towards travelers from Orlando and Miami.
- Tailor amenities and listing descriptions to appeal to the dominant Post-2000s (Gen Z/Alpha) demographic (e.g., highlight fast WiFi, smart home features, local guides).
- Highlight unique local experiences or amenities relevant to the primary guest profile.
- Consider seasonal promotions aligned with peak travel times for key origin markets.
Nearby Short-Term Rental Market Comparison
How does the St. Cloud Airbnb market stack up against its neighbors? Compare key performance metrics like average monthly revenue, ADR, and occupancy rates in surrounding areas to understand the broader regional STR landscape.
| Market | Active Properties | Monthly Revenue | Daily Rate | Avg. Occupancy |
|---|---|---|---|---|
| Sailfish Point | 21 | $21,390 | $1469.53 | 61% |
| Reunion | 11 | $7,012 | $541.35 | 44% |
| Anna Maria island | 602 | $5,813 | $699.62 | 41% |
| Thonotosassa | 14 | $5,393 | $332.81 | 51% |
| Vilano Beach | 141 | $5,234 | $401.84 | 46% |
| St. Augustine Beach | 10 | $4,981 | $378.65 | 43% |
| Melbourne Beach | 221 | $4,864 | $415.14 | 42% |
| Indian Rocks Beach | 860 | $4,471 | $363.85 | 47% |
| Siesta Key | 1,110 | $4,041 | $450.55 | 43% |
| Seminole | 497 | $3,889 | $269.37 | 54% |