O'Brien Airbnb Market Analysis 2025: Short Term Rental Data & Vacation Rental Statistics in Florida, United States
Is Airbnb profitable in O'Brien in 2025? Explore comprehensive Airbnb analytics for O'Brien, Florida, United States to uncover income potential. This 2025 STR market report for O'Brien, based on AirROI data from November 2024 to October 2025, reveals key trends in the niche market of 18 active listings.
Whether you're considering an Airbnb investment in O'Brien, optimizing your existing vacation rental, or exploring rental arbitrage opportunities, understanding the O'Brien Airbnb data is crucial. Leveraging the low regulation environment is key to maximizing your short term rental income potential. Let's dive into the specifics.
Key O'Brien Airbnb Performance Metrics Overview
Monthly Airbnb Revenue Variations & Income Potential in O'Brien (2025)
Understanding the monthly revenue variations for Airbnb listings in O'Brien is key to maximizing your short term rental income potential. Seasonality significantly impacts earnings. Our analysis, based on data from the past 12 months, shows that the peak revenue month for STRs in O'Brien is typically December, while April often presents the lowest earnings, highlighting opportunities for strategic pricing adjustments during shoulder and low seasons. Explore the typical Airbnb income in O'Brien across different performance tiers:
- Best-in-class properties (Top 10%) achieve $4,050+ monthly, often utilizing dynamic pricing and superior guest experiences.
- Strong performing properties (Top 25%) earn $2,705 or more, indicating effective management and desirable locations/amenities.
- Typical properties (Median) generate around $1,461 per month, representing the average market performance.
- Entry-level properties (Bottom 25%) see earnings around $732, often with potential for optimization.
Average Monthly Airbnb Earnings Trend in O'Brien
O'Brien Airbnb Occupancy Rate Trends (2025)
Maximize your bookings by understanding the O'Brien STR occupancy trends. Seasonal demand shifts significantly influence how often properties are booked. Typically, Decembersees the highest demand (peak season occupancy), while September experiences the lowest (low season). Effective strategies, like adjusting minimum stays or offering promotions, can boost occupancy during slower periods. Here's how different property tiers perform in O'Brien:
- Best-in-class properties (Top 10%) achieve 75%+ occupancy, indicating high desirability and potentially optimized availability.
- Strong performing properties (Top 25%) maintain 64% or higher occupancy, suggesting good market fit and guest satisfaction.
- Typical properties (Median) have an occupancy rate around 47%.
- Entry-level properties (Bottom 25%) average 22% occupancy, potentially facing higher vacancy.
Average Monthly Occupancy Rate Trend in O'Brien
Average Daily Rate (ADR) Airbnb Trends in O'Brien (2025)
Effective short term rental pricing strategy in O'Brien involves understanding monthly ADR fluctuations. The Average Daily Rate (ADR) for Airbnb in O'Brien typically peaks in October and dips lowest during March. Leveraging Airbnb dynamic pricing tools or strategies based on this seasonality can significantly boost revenue. Here's a look at the typical nightly rates achieved:
- Best-in-class properties (Top 10%) command rates of $207+ per night, often due to premium features or locations.
- Strong performing properties (Top 25%) achieve nightly rates of $150 or more.
- Typical properties (Median) charge around $122 per night.
- Entry-level properties (Bottom 25%) earn around $82 per night.
Average Daily Rate (ADR) Trend by Month in O'Brien
Get Live O'Brien Market Intelligence 👇

Explore Real-time Analytics
Airbnb Seasonality Analysis & Trends in O'Brien (2025)
Peak Season (December, November, July)
- Revenue averages $2,358 per month
- Occupancy rates average 55.6%
- Daily rates average $131
Shoulder Season
- Revenue averages $1,947 per month
- Occupancy maintains around 44.3%
- Daily rates hold near $134
Low Season (February, April, September)
- Revenue drops to average $1,625 per month
- Occupancy decreases to average 38.9%
- Daily rates adjust to average $132
Seasonality Insights for O'Brien
- The Airbnb seasonality in O'Brien shows moderate seasonality with distinct peak and low periods. While the sections above show seasonal averages, it's also insightful to look at the extremes:
- During the high season, the absolute peak month showcases O'Brien's highest earning potential, with monthly revenues capable of climbing to $2,583, occupancy reaching a high of 62.4%, and ADRs peaking at $143.
- Conversely, the slowest single month of the year, typically falling within the low season, marks the market's lowest point. In this month, revenue might dip to $1,494, occupancy could drop to 32.5%, and ADRs may adjust down to $125.
- Understanding both the seasonal averages and these monthly peaks and troughs in revenue, occupancy, and ADR is crucial for maximizing your Airbnb profit potential in O'Brien.
Seasonal Strategies for Maximizing Profit
- Peak Season: Maximize revenue through premium pricing and potentially longer minimum stays. Ensure high availability.
- Low Season: Offer competitive pricing, special promotions (e.g., extended stay discounts), and flexible cancellation policies. Target off-season travelers like remote workers or budget-conscious guests.
- Shoulder Seasons: Implement dynamic pricing that balances peak and low rates. Target weekend travelers or specific events. Offer slightly more flexible terms than peak season.
- Regularly analyze your own performance against these O'Brien seasonality benchmarks and adjust your pricing and availability strategy accordingly.
Best Areas for Airbnb Investment in O'Brien (2025)
Exploring the top neighborhoods for short-term rentals in O'Brien? This section highlights key areas, outlining why they are attractive for hosts and guests, along with notable local attractions. Consider these locations based on your target guest profile and investment strategy.
| Neighborhood / Area | Why Host Here? (Target Guests & Appeal) | Key Attractions & Landmarks |
|---|---|---|
| O'Brien Lake | A serene community with a beautiful lake setting, ideal for travelers looking to relax and enjoy nature. Popular for fishing, kayaking, and outdoor activities. | O'Brien Lake, Local parks, Fishing spots, Nature trails |
| Suwannee River | Famous for its beautiful river and natural springs, attracting visitors who enjoy canoeing, tubing, and exploring the outdoors. | Suwannee River State Park, Local springs, Canoeing and tubing, Wildlife watching |
| Suwannee River Wilderness Trail | A scenic trail perfect for hiking and biking, drawing outdoor enthusiasts and those seeking adventure. | Suwannee River Wilderness Trail, Picnic areas, Wildlife viewing, Nature hikes |
| Live Oak | Nearby town with historical sites and community events; offers a more suburban feel with easy access to larger cities. | Live Oak Historic District, Suwannee County Historical Museum, Local festivals |
| Ginnie Springs | A popular destination known for its crystal-clear springs, perfect for swimming, snorkeling, and tubing. Great for families and adventure seekers. | Ginnie Springs, Camping areas, Scuba diving spots, Picnic facilities |
| Stephen Foster Folk Culture Center State Park | A cultural hub dedicated to the life of Stephen Foster, offering programs and events that attract music lovers and history enthusiasts. | Stephen Foster Museum, Pavilion, Folk music events |
| Olustee Battlefield Historic State Park | A site of historical importance with walking trails and reenactments, appealing to history buffs and families. | Battlefield trails, Visitor center, Historical reenactments |
| Ichetucknee Springs State Park | Famous for its stunning natural springs, this park offers swimming, tubing, and snorkeling opportunities, perfect for families. | Ichetucknee Springs, Lazy river tubing, Snorkeling spots, Nature trails |
Understanding Airbnb License Requirements & STR Laws in O'Brien (2025)
While O'Brien, Florida, United States currently shows low STR regulations, specific Airbnb license requirements might still exist or change. Always verify the latest short term rental regulations and Airbnb license requirements directly with local government authorities for O'Brien to ensure full compliance before hosting.
(Source: AirROI data, 2025, finding no licensed listings among those analyzed)
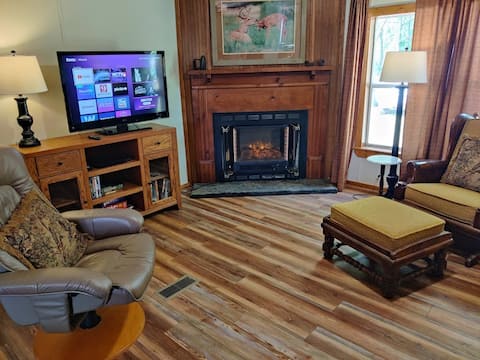
Top Performing Airbnb Properties in O'Brien (2025)
Benchmark your potential! Explore examples of top-performing Airbnb properties in O'Brienbased on Trailing Twelve Month (TTM) revenue. Analyze their characteristics, revenue, occupancy rate, and ADR to understand what drives success in this market.

The Hidden Palms
Entire Place • 4 bedrooms
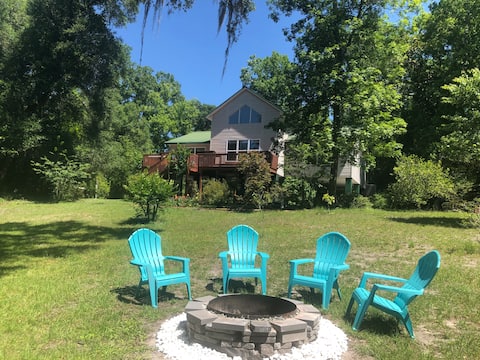
The Outback
Entire Place • 3 bedrooms
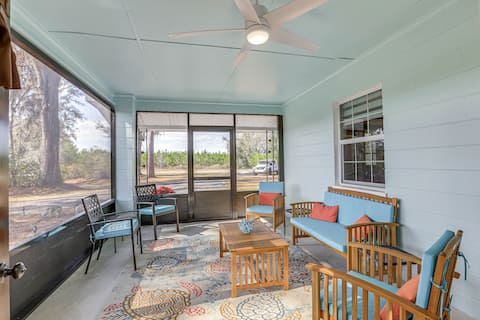
Suwannee River Chalet
Entire Place • 3 bedrooms
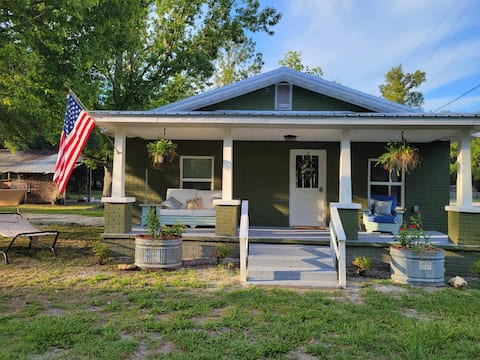
Pet-Friendly Florida Escape w/ Patio & Fire Pit!
Entire Place • 3 bedrooms
Springs Cottage
Entire Place • 2 bedrooms
Good country living scuba diving capital
Entire Place • 3 bedrooms
Note: Performance varies based on location, size, amenities, seasonality, and management quality. Data reflects the past 12 months.
Top Performing Airbnb Hosts in O'Brien (2025)
Learn from the best! This table showcases top-performing Airbnb hosts in O'Brien based on the number of properties managed and estimated total revenue over the past year. Analyze their scale and performance metrics.
| Host Name | Properties | Grossing Revenue | Stay Reviews | Avg Rating |
|---|---|---|---|---|
| Evolve | 3 | $47,186 | 156 | 4.82/5.0 |
| Randy | 1 | $45,153 | 132 | 4.87/5.0 |
| Judy | 2 | $44,331 | 63 | 4.95/5.0 |
| Bill | 1 | $39,492 | 70 | 4.99/5.0 |
| Melinda Christine | 1 | $23,140 | 42 | 4.67/5.0 |
| Michael | 1 | $20,178 | 129 | 4.97/5.0 |
| David | 1 | $18,648 | 45 | 4.82/5.0 |
| Doug | 1 | $17,559 | 540 | 4.83/5.0 |
| Dawn | 1 | $14,585 | 58 | 4.88/5.0 |
| Margarita'S Destination Possib | 1 | $13,876 | 169 | 4.76/5.0 |
Analyzing the strategies of top hosts, such as their property selection, pricing, and guest communication, can offer valuable lessons for optimizing your own Airbnb operations in O'Brien.
Dive Deeper: Advanced O'Brien STR Market Data (2025)
Ready to unlock more insights? AirROI provides access to advanced metrics and comprehensive Airbnb data for O'Brien. Explore detailed analytics beyond this report to refine your investment strategy, optimize pricing, and maximize your vacation rental profits.
Explore Advanced MetricsO'Brien Short-Term Rental Market Composition (2025): Property & Room Types
Room Type Distribution
Property Type Distribution
Market Composition Insights for O'Brien
- The O'Brien Airbnb market composition is heavily skewed towards Entire Home/Apt listings, which make up 94.4% of the 18 active rentals. This indicates strong guest preference for privacy and space.
- Looking at the property type distribution in O'Brien, House properties are the most common (72.2%), reflecting the local real estate landscape.
- Houses represent a significant 72.2% portion, catering likely to families or larger groups.
- The presence of 5.6% Hotel/Boutique listings indicates integration with traditional hospitality.
O'Brien Airbnb Room Capacity Analysis (2025): Bedroom Distribution
Distribution of Listings by Number of Bedrooms
Room Capacity Insights for O'Brien
- The dominant room capacity in O'Brien is 3 bedrooms listings, making up 27.8% of the market. This suggests a strong demand for properties suitable for families or small groups.
- Together, 3 bedrooms and 1 bedroom properties represent 55.6% of the active Airbnb listings in O'Brien, indicating a high concentration in these sizes.
- A significant 33.4% of listings offer 3+ bedrooms, catering to larger groups and families seeking more space in O'Brien.
O'Brien Vacation Rental Guest Capacity Trends (2025)
Distribution of Listings by Guest Capacity
Guest Capacity Insights for O'Brien
- The most common guest capacity trend in O'Brien vacation rentals is listings accommodating 4 guests (27.8%). This suggests the primary traveler segment is likely small families or groups.
- Properties designed for 4 guests and 6 guests dominate the O'Brien STR market, accounting for 50.0% of listings.
- 50.0% of properties accommodate 6+ guests, serving the market segment for larger families or group travel in O'Brien.
- On average, properties in O'Brien are equipped to host 5.2 guests.
O'Brien Airbnb Booking Patterns (2025): Available vs. Booked Days
Available Days Distribution
Booked Days Distribution
Booking Pattern Insights for O'Brien
- The most common availability pattern in O'Brien falls within the 181-270 days range, representing 44.4% of listings. This suggests many properties have significant open periods on their calendars.
- Approximately 77.7% of listings show high availability (181+ days open annually), indicating potential for increased bookings or specific owner usage patterns.
- For booked days, the 91-180 days range is most frequent in O'Brien (44.4%), reflecting common guest stay durations or potential owner blocking patterns.
- A notable 22.2% of properties secure long booking periods (181+ days booked per year), highlighting successful long-term rental strategies or significant owner usage.
O'Brien Airbnb Minimum Stay Requirements Analysis
Distribution of Listings by Minimum Night Requirement
1 Night
6 listings
33.3% of total
2 Nights
7 listings
38.9% of total
3 Nights
2 listings
11.1% of total
30+ Nights
3 listings
16.7% of total
Key Insights
- The most prevalent minimum stay requirement in O'Brien is 2 Nights, adopted by 38.9% of listings. This highlights the market's preference for shorter, flexible bookings.
- A strong majority (72.2%) of the O'Brien Airbnb data shows acceptance of very short stays (1-2 nights), indicating a dynamic, high-turnover market.
- A significant segment (16.7%) caters to monthly stays (30+ nights) in O'Brien, pointing to opportunities in the extended-stay market.
Recommendations
- Align with the market by considering a 2 Nights minimum stay, as 38.9% of O'Brien hosts use this setting.
- Explore offering discounts for stays of 30+ nights to attract the 16.7% of the market seeking extended stays.
- Adjust minimum nights based on seasonality – potentially shorter during low season and longer during peak demand periods in O'Brien.
O'Brien Airbnb Cancellation Policy Trends Analysis (2025)
Flexible
8 listings
44.4% of total
Moderate
5 listings
27.8% of total
Firm
2 listings
11.1% of total
Strict
3 listings
16.7% of total
Cancellation Policy Insights for O'Brien
- The prevailing Airbnb cancellation policy trend in O'Brien is Flexible, used by 44.4% of listings.
- The market strongly favors guest-friendly terms, with 72.2% of listings offering Flexible or Moderate policies. This suggests guests in O'Brien may expect booking flexibility.
Recommendations for Hosts
- Consider adopting a Flexible policy to align with the 44.4% market standard in O'Brien.
- Regularly review your cancellation policy against competitors and market demand shifts in O'Brien.
O'Brien STR Booking Lead Time Analysis (2025)
Average Booking Lead Time by Month
Booking Lead Time Insights for O'Brien
- The overall average booking lead time for vacation rentals in O'Brien is 23 days.
- Guests book furthest in advance for stays during April (average 50 days), likely coinciding with peak travel demand or local events.
- The shortest booking windows occur for stays in November (average 10 days), indicating more last-minute travel plans during this time.
- Seasonally, Spring (40 days avg.) sees the longest lead times, while Winter (15 days avg.) has the shortest, reflecting typical travel planning cycles.
Recommendations for Hosts
- Use the overall average lead time (23 days) as a baseline for your pricing and availability strategy in O'Brien.
- For April stays, consider implementing length-of-stay discounts or slightly higher rates for bookings made less than 50 days out to capitalize on advance planning.
- During November, focus on last-minute booking availability and promotions, as guests book with very short notice (10 days avg.).
- Target marketing efforts for the Spring season well in advance (at least 40 days) to capture early planners.
- Monitor your own booking lead times against these O'Brien averages to identify opportunities for dynamic pricing adjustments.
Popular & Essential Airbnb Amenities in O'Brien (2025)
Amenity Prevalence
Amenity Insights for O'Brien
- Essential amenities in O'Brien that guests expect include: Refrigerator, Free parking on premises. Lacking these (any) could significantly impact bookings.
- Popular amenities like Dishes and silverware, Bed linens, Coffee maker are common but not universal. Offering these can provide a competitive edge.
- Warning: Wifi is not universally provided but is considered essential globally. Ensure reliable Wifi is offered.
Recommendations for Hosts
- Ensure your listing includes all essential amenities for O'Brien: Refrigerator, Free parking on premises.
- Consider adding popular differentiators like Dishes and silverware or Bed linens to increase appeal.
- Highlight unique or less common amenities you offer (e.g., hot tub, dedicated workspace, EV charger) in your listing description and photos.
- Regularly check competitor amenities in O'Brien to stay competitive.
O'Brien Airbnb Guest Demographics & Profile Analysis (2025)
Guest Profile Summary for O'Brien
- The typical guest profile for Airbnb in O'Brien consists of primarily domestic travelers (96%), often arriving from nearby Fort Lauderdale, typically belonging to the Post-2000s (Gen Z/Alpha) group (50%), primarily speaking English or Spanish.
- Domestic travelers account for 96.4% of guests.
- Key international markets include United States (96.4%) and Germany (0.7%).
- Top languages spoken are English (78.8%) followed by Spanish (15%).
- A significant demographic segment is the Post-2000s (Gen Z/Alpha) group, representing 50% of guests.
Recommendations for Hosts
- Target domestic marketing efforts towards travelers from Fort Lauderdale and Bradenton.
- Tailor amenities and listing descriptions to appeal to the dominant Post-2000s (Gen Z/Alpha) demographic (e.g., highlight fast WiFi, smart home features, local guides).
- Highlight unique local experiences or amenities relevant to the primary guest profile.
- Consider seasonal promotions aligned with peak travel times for key origin markets.
Nearby Short-Term Rental Market Comparison
How does the O'Brien Airbnb market stack up against its neighbors? Compare key performance metrics like average monthly revenue, ADR, and occupancy rates in surrounding areas to understand the broader regional STR landscape.
| Market | Active Properties | Monthly Revenue | Daily Rate | Avg. Occupancy |
|---|---|---|---|---|
| St. Augustine Beach | 10 | $6,713 | $427.27 | 48% |
| Ponte Vedra Beach | 224 | $5,941 | $579.42 | 42% |
| Vilano Beach | 174 | $5,928 | $452.40 | 46% |
| Jacksonville Beach | 746 | $4,261 | $331.57 | 49% |
| St. Simons | 86 | $3,843 | $383.90 | 41% |
| Montgomery | 11 | $3,831 | $255.84 | 54% |
| Saint Augustine | 1,811 | $3,721 | $288.93 | 47% |
| Hammock Beach | 202 | $3,525 | $441.60 | 37% |
| Saint Simons | 918 | $3,478 | $378.32 | 37% |
| Fleming Island | 14 | $3,474 | $252.52 | 48% |