Georgetown Airbnb Market Analysis 2025: Short Term Rental Data & Vacation Rental Statistics in Delaware, United States
Is Airbnb profitable in Georgetown in 2025? Explore comprehensive Airbnb analytics for Georgetown, Delaware, United States to uncover income potential. This 2025 STR market report for Georgetown, based on AirROI data from April 2024 to March 2025, reveals key trends in the niche market of 18 active listings.
Whether you're considering an Airbnb investment in Georgetown, optimizing your existing vacation rental, or exploring rental arbitrage opportunities, understanding the Georgetown Airbnb data is crucial. Leveraging the low regulation environment is key to maximizing your short term rental income potential. Let's dive into the specifics.
Key Georgetown Airbnb Performance Metrics Overview
Monthly Airbnb Revenue Variations & Income Potential in Georgetown (2025)
Understanding the monthly revenue variations for Airbnb listings in Georgetown is key to maximizing your short term rental income potential. Seasonality significantly impacts earnings. Our analysis, based on data from the past 12 months, shows that the peak revenue month for STRs in Georgetown is typically June, while March often presents the lowest earnings, highlighting opportunities for strategic pricing adjustments during shoulder and low seasons. Explore the typical Airbnb income in Georgetown across different performance tiers:
- Best-in-class properties (Top 10%) achieve $7,257+ monthly, often utilizing dynamic pricing and superior guest experiences.
- Strong performing properties (Top 25%) earn $4,450 or more, indicating effective management and desirable locations/amenities.
- Typical properties (Median) generate around $2,400 per month, representing the average market performance.
- Entry-level properties (Bottom 25%) see earnings around $1,045, often with potential for optimization.
Average Monthly Airbnb Earnings Trend in Georgetown
Georgetown Airbnb Occupancy Rate Trends (2025)
Maximize your bookings by understanding the Georgetown STR occupancy trends. Seasonal demand shifts significantly influence how often properties are booked. Typically, Junesees the highest demand (peak season occupancy), while November experiences the lowest (low season). Effective strategies, like adjusting minimum stays or offering promotions, can boost occupancy during slower periods. Here's how different property tiers perform in Georgetown:
- Best-in-class properties (Top 10%) achieve 77%+ occupancy, indicating high desirability and potentially optimized availability.
- Strong performing properties (Top 25%) maintain 66% or higher occupancy, suggesting good market fit and guest satisfaction.
- Typical properties (Median) have an occupancy rate around 46%.
- Entry-level properties (Bottom 25%) average 21% occupancy, potentially facing higher vacancy.
Average Monthly Occupancy Rate Trend in Georgetown
Average Daily Rate (ADR) Airbnb Trends in Georgetown (2025)
Effective short term rental pricing strategy in Georgetown involves understanding monthly ADR fluctuations. The Average Daily Rate (ADR) for Airbnb in Georgetown typically peaks in July and dips lowest during November. Leveraging Airbnb dynamic pricing tools or strategies based on this seasonality can significantly boost revenue. Here's a look at the typical nightly rates achieved:
- Best-in-class properties (Top 10%) command rates of $351+ per night, often due to premium features or locations.
- Strong performing properties (Top 25%) achieve nightly rates of $291 or more.
- Typical properties (Median) charge around $160 per night.
- Entry-level properties (Bottom 25%) earn around $93 per night.
Average Daily Rate (ADR) Trend by Month in Georgetown
Get Live Georgetown Market Intelligence 👇

Explore Real-time Analytics
Airbnb Seasonality Analysis & Trends in Georgetown (2025)
Peak Season (June, July, May)
- Revenue averages $4,502 per month
- Occupancy rates average 56.8%
- Daily rates average $207
Shoulder Season
- Revenue averages $3,059 per month
- Occupancy maintains around 43.5%
- Daily rates hold near $195
Low Season (February, March, November)
- Revenue drops to average $2,273 per month
- Occupancy decreases to average 40.7%
- Daily rates adjust to average $183
Seasonality Insights for Georgetown
- The Airbnb seasonality in Georgetown shows highly seasonal trends requiring careful strategy. While the sections above show seasonal averages, it's also insightful to look at the extremes:
- During the high season, the absolute peak month showcases Georgetown's highest earning potential, with monthly revenues capable of climbing to $4,764, occupancy reaching a high of 61.3%, and ADRs peaking at $214.
- Conversely, the slowest single month of the year, typically falling within the low season, marks the market's lowest point. In this month, revenue might dip to $2,016, occupancy could drop to 33.8%, and ADRs may adjust down to $179.
- Understanding both the seasonal averages and these monthly peaks and troughs in revenue, occupancy, and ADR is crucial for maximizing your Airbnb profit potential in Georgetown.
Seasonal Strategies for Maximizing Profit
- Peak Season: Maximize revenue through premium pricing and potentially longer minimum stays. Ensure high availability.
- Low Season: Offer competitive pricing, special promotions (e.g., extended stay discounts), and flexible cancellation policies. Target off-season travelers like remote workers or budget-conscious guests.
- Shoulder Seasons: Implement dynamic pricing that balances peak and low rates. Target weekend travelers or specific events. Offer slightly more flexible terms than peak season.
- Regularly analyze your own performance against these Georgetown seasonality benchmarks and adjust your pricing and availability strategy accordingly.
Best Areas for Airbnb Investment in Georgetown (2025)
Exploring the top neighborhoods for short-term rentals in Georgetown? This section highlights key areas, outlining why they are attractive for hosts and guests, along with notable local attractions. Consider these locations based on your target guest profile and investment strategy.
| Neighborhood / Area | Why Host Here? (Target Guests & Appeal) | Key Attractions & Landmarks |
|---|---|---|
| Historic Georgetown | The charming historic district is filled with beautiful architecture, quaint shops, and restaurants. It attracts visitors interested in history and culture, making it ideal for Airbnb hosting. | The Georgetown Court House, The Brick Hotel, Georgetown Historical Society, Archives of Delaware, Mariner's Bethel United Methodist Church |
| Nassau DE | Located near the beaches, Nassau is a great area for families and beachgoers. It combines suburban comfort with easy access to coastal fun. | Delaware beaches, Nassau Valley Vineyards, Cape Henlopen State Park, The Big Chill Beach Club |
| Millsboro | Just a short drive from both Georgetown and the beach, Millsboro offers a mix of suburban and rural living. It's popular for those who want a more relaxed pace. | Cupola Park, Millsboro Town Center, Baywood Greens Golf Club, Fishing and boating on Indian River |
| Long Neck | A tranquil area with proximity to the Indian River and beaches, great for outdoor activities and relaxation. Appeals to nature lovers and retirees. | Rehoboth Bay, John J. Williams Highway parks, Long Neck's waterfront restaurants |
| Harbeson | This area is known for its peaceful setting and community feel, appealing to those looking for a quiet retreat, while still being close to amenities. | Local farms, Nature trails, Community events |
| Dewey Beach | A vibrant beach town popular with tourists especially during the summer. Known for its nightlife and beach activities, making it a hot spot for rentals. | Dewey Beach concerts, The Starboard, Dewey Beach Surfing and Watersports |
| Rehoboth Beach | A famed beach destination with a boardwalk, shops, and restaurants. Highly sought after for summer rentals, drawing families and vacationers. | Rehoboth Beach Boardwalk, Funland amusement park, Rehoboth Beach Convention Center |
| Selbyville | Located near water attractions and with easy access to both the beach and bay, it’s an excellent choice for families seeking a quieter vacation experience. | Fenwick Island State Park, The Water Park at Ocean City, Local seafood dining |
Understanding Airbnb License Requirements & STR Laws in Georgetown (2025)
While Georgetown, Delaware, United States currently shows low STR regulations, specific Airbnb license requirements might still exist or change. Always verify the latest short term rental regulations and Airbnb license requirements directly with local government authorities for Georgetown to ensure full compliance before hosting.
(Source: AirROI data, 2025, finding no licensed listings among those analyzed)
Top Performing Airbnb Properties in Georgetown (2025)
Benchmark your potential! Explore examples of top-performing Airbnb properties in Georgetownbased on Trailing Twelve Month (TTM) revenue. Analyze their characteristics, revenue, occupancy rate, and ADR to understand what drives success in this market.
Peaceful Private Nature Home near Shopping center
Entire Place • 4 bedrooms
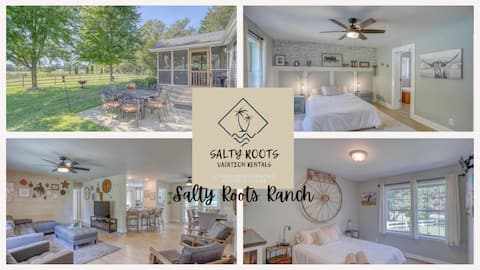
Salty Roots Ranch_Yard & Game Room_Mins to Milton
Entire Place • 5 bedrooms

Holly Hill: Quiet Wooded Retreat Close to Beaches
Entire Place • 2 bedrooms
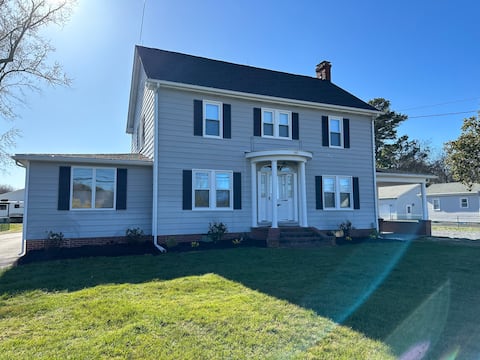
The 1934 Farmhouse (close to the beaches)
Entire Place • 4 bedrooms
Peaceful Georgetown Home - 13 Mi to Lewes Beach!
Entire Place • 3 bedrooms

New 3BR home near Sports at the Beach & Lewes
Entire Place • 3 bedrooms
Note: Performance varies based on location, size, amenities, seasonality, and management quality. Data reflects the past 12 months.
Top Performing Airbnb Hosts in Georgetown (2025)
Learn from the best! This table showcases top-performing Airbnb hosts in Georgetown based on the number of properties managed and estimated total revenue over the past year. Analyze their scale and performance metrics.
| Host Name | Properties | Grossing Revenue | Stay Reviews | Avg Rating |
|---|---|---|---|---|
| Hilary | 1 | $93,582 | 65 | 4.92/5.0 |
| Briana | 1 | $69,493 | 18 | 4.78/5.0 |
| Jake | 1 | $47,547 | 27 | 5.00/5.0 |
| Charles | 1 | $47,431 | 108 | 4.69/5.0 |
| Evolve | 1 | $41,096 | 100 | 4.93/5.0 |
| Host #446968938 | 1 | $36,357 | 7 | 4.86/5.0 |
| Nancy | 1 | $32,875 | 85 | 5.00/5.0 |
| Richard | 1 | $30,915 | 148 | 4.85/5.0 |
| Ed | 1 | $22,048 | 90 | 4.94/5.0 |
| Host #109249340 | 3 | $16,920 | 156 | 3.26/5.0 |
Analyzing the strategies of top hosts, such as their property selection, pricing, and guest communication, can offer valuable lessons for optimizing your own Airbnb operations in Georgetown.
Dive Deeper: Advanced Georgetown STR Market Data (2025)
Ready to unlock more insights? AirROI provides access to advanced metrics and comprehensive Airbnb data for Georgetown. Explore detailed analytics beyond this report to refine your investment strategy, optimize pricing, and maximize your vacation rental profits.
Explore Advanced MetricsGeorgetown Short-Term Rental Market Composition (2025): Property & Room Types
Room Type Distribution
Property Type Distribution
Market Composition Insights for Georgetown
- The Georgetown Airbnb market composition is heavily skewed towards Entire Home/Apt listings, which make up 66.7% of the 18 active rentals. This indicates strong guest preference for privacy and space.
- However, a notable 27.8% share for Private Rooms suggests opportunities for budget-conscious travelers or hosts renting out spare rooms.
- Looking at the property type distribution in Georgetown, House properties are the most common (72.2%), reflecting the local real estate landscape.
- Houses represent a significant 72.2% portion, catering likely to families or larger groups.
- The presence of 5.6% Hotel/Boutique listings indicates integration with traditional hospitality.
Georgetown Airbnb Room Capacity Analysis (2025): Bedroom Distribution
Distribution of Listings by Number of Bedrooms
Room Capacity Insights for Georgetown
- The dominant room capacity in Georgetown is 1 bedroom listings, making up 38.9% of the market. This suggests a strong demand for properties suitable for couples or solo travelers.
- Together, 1 bedroom and 3 bedrooms properties represent 61.1% of the active Airbnb listings in Georgetown, indicating a high concentration in these sizes.
- A significant 50.0% of listings offer 3+ bedrooms, catering to larger groups and families seeking more space in Georgetown.
Georgetown Vacation Rental Guest Capacity Trends (2025)
Distribution of Listings by Guest Capacity
Guest Capacity Insights for Georgetown
- The most common guest capacity trend in Georgetown vacation rentals is listings accommodating 8+ guests (33.3%). This suggests the primary traveler segment is likely larger groups.
- Properties designed for 8+ guests and 2 guests dominate the Georgetown STR market, accounting for 55.5% of listings.
- 55.6% of properties accommodate 6+ guests, serving the market segment for larger families or group travel in Georgetown.
- On average, properties in Georgetown are equipped to host 5.0 guests.
Georgetown Airbnb Booking Patterns (2025): Available vs. Booked Days
Available Days Distribution
Booked Days Distribution
Booking Pattern Insights for Georgetown
- The most common availability pattern in Georgetown falls within the 181-270 days range, representing 44.4% of listings. This suggests many properties have significant open periods on their calendars.
- Approximately 72.2% of listings show high availability (181+ days open annually), indicating potential for increased bookings or specific owner usage patterns.
- For booked days, the 91-180 days range is most frequent in Georgetown (44.4%), reflecting common guest stay durations or potential owner blocking patterns.
- A notable 27.8% of properties secure long booking periods (181+ days booked per year), highlighting successful long-term rental strategies or significant owner usage.
Georgetown Airbnb Minimum Stay Requirements Analysis
Distribution of Listings by Minimum Night Requirement
1 Night
5 listings
41.7% of total
2 Nights
5 listings
41.7% of total
30+ Nights
2 listings
16.7% of total
Key Insights
- The most prevalent minimum stay requirement in Georgetown is 1 Night, adopted by 41.7% of listings. This highlights the market's preference for shorter, flexible bookings.
- A strong majority (83.4%) of the Georgetown Airbnb data shows acceptance of very short stays (1-2 nights), indicating a dynamic, high-turnover market.
- A significant segment (16.7%) caters to monthly stays (30+ nights) in Georgetown, pointing to opportunities in the extended-stay market.
Recommendations
- Align with the market by considering a 1 Night minimum stay, as 41.7% of Georgetown hosts use this setting.
- Explore offering discounts for stays of 30+ nights to attract the 16.7% of the market seeking extended stays.
- Adjust minimum nights based on seasonality – potentially shorter during low season and longer during peak demand periods in Georgetown.
Georgetown Airbnb Cancellation Policy Trends Analysis (2025)
Flexible
4 listings
30.8% of total
Moderate
3 listings
23.1% of total
Firm
3 listings
23.1% of total
Strict
3 listings
23.1% of total
Cancellation Policy Insights for Georgetown
- The prevailing Airbnb cancellation policy trend in Georgetown is Flexible, used by 30.8% of listings.
- There's a relatively balanced mix between guest-friendly (53.9%) and stricter (46.2%) policies, offering choices for different guest needs.
Recommendations for Hosts
- Consider adopting a Flexible policy to align with the 30.8% market standard in Georgetown.
- Regularly review your cancellation policy against competitors and market demand shifts in Georgetown.
Georgetown STR Booking Lead Time Analysis (2025)
Average Booking Lead Time by Month
Booking Lead Time Insights for Georgetown
- The overall average booking lead time for vacation rentals in Georgetown is 52 days.
- Guests book furthest in advance for stays during January (average 116 days), likely coinciding with peak travel demand or local events.
- The shortest booking windows occur for stays in October (average 15 days), indicating more last-minute travel plans during this time.
- Seasonally, Winter (53 days avg.) sees the longest lead times, while Fall (31 days avg.) has the shortest, reflecting typical travel planning cycles.
Recommendations for Hosts
- Use the overall average lead time (52 days) as a baseline for your pricing and availability strategy in Georgetown.
- For January stays, consider implementing length-of-stay discounts or slightly higher rates for bookings made less than 116 days out to capitalize on advance planning.
- Target marketing efforts for the Winter season well in advance (at least 53 days) to capture early planners.
- Monitor your own booking lead times against these Georgetown averages to identify opportunities for dynamic pricing adjustments.
Popular & Essential Airbnb Amenities in Georgetown (2025)
Amenity Prevalence
Amenity Insights for Georgetown
- Essential amenities in Georgetown that guests expect include: Heating, Air conditioning, TV, Smoke alarm, Hot water, Wifi. Lacking these (any) could significantly impact bookings.
- Popular amenities like Essentials, Free parking on premises, Kitchen are common but not universal. Offering these can provide a competitive edge.
Recommendations for Hosts
- Ensure your listing includes all essential amenities for Georgetown: Heating, Air conditioning, TV, Smoke alarm, Hot water, Wifi.
- Consider adding popular differentiators like Essentials or Free parking on premises to increase appeal.
- Highlight unique or less common amenities you offer (e.g., hot tub, dedicated workspace, EV charger) in your listing description and photos.
- Regularly check competitor amenities in Georgetown to stay competitive.
Georgetown Airbnb Guest Demographics & Profile Analysis (2025)
Guest Profile Summary for Georgetown
- The typical guest profile for Airbnb in Georgetown consists of primarily domestic travelers (96%), often arriving from nearby Philadelphia, typically belonging to the Post-2000s (Gen Z/Alpha) group (50%), primarily speaking English or Spanish.
- Domestic travelers account for 96.4% of guests.
- Key international markets include United States (96.4%) and DC (2.1%).
- Top languages spoken are English (68.9%) followed by Spanish (11.7%).
- A significant demographic segment is the Post-2000s (Gen Z/Alpha) group, representing 50% of guests.
Recommendations for Hosts
- Target domestic marketing efforts towards travelers from Philadelphia and Lancaster.
- Tailor amenities and listing descriptions to appeal to the dominant Post-2000s (Gen Z/Alpha) demographic (e.g., highlight fast WiFi, smart home features, local guides).
- Highlight unique local experiences or amenities relevant to the primary guest profile.
- Consider seasonal promotions aligned with peak travel times for key origin markets.
Nearby Short-Term Rental Market Comparison
How does the Georgetown Airbnb market stack up against its neighbors? Compare key performance metrics like average monthly revenue, ADR, and occupancy rates in surrounding areas to understand the broader regional STR landscape.
| Market | Active Properties | Monthly Revenue | Daily Rate | Avg. Occupancy |
|---|---|---|---|---|
| Centreville | 15 | $6,205 | $510.77 | 47% |
| Mayo | 13 | $5,786 | $439.15 | 52% |
| Stone Harbor | 34 | $5,711 | $639.17 | 45% |
| Stevensville | 70 | $5,476 | $499.46 | 43% |
| Harvey Cedars | 23 | $5,311 | $775.06 | 40% |
| Chester | 17 | $5,299 | $437.72 | 43% |
| Arundel on the Bay | 25 | $5,285 | $509.37 | 39% |
| Middletown Township | 10 | $5,208 | $392.83 | 53% |
| Lower Windsor Township | 15 | $5,190 | $348.51 | 45% |
| Cape May Point | 25 | $5,145 | $509.59 | 48% |