Dagsboro Airbnb Market Analysis 2025: Short Term Rental Data & Vacation Rental Statistics in Delaware, United States
Is Airbnb profitable in Dagsboro in 2025? Explore comprehensive Airbnb analytics for Dagsboro, Delaware, United States to uncover income potential. This 2025 STR market report for Dagsboro, based on AirROI data from April 2024 to March 2025, reveals key trends in the niche market of 17 active listings.
Whether you're considering an Airbnb investment in Dagsboro, optimizing your existing vacation rental, or exploring rental arbitrage opportunities, understanding the Dagsboro Airbnb data is crucial. Leveraging the low regulation environment is key to maximizing your short term rental income potential. Let's dive into the specifics.
Key Dagsboro Airbnb Performance Metrics Overview
Monthly Airbnb Revenue Variations & Income Potential in Dagsboro (2025)
Understanding the monthly revenue variations for Airbnb listings in Dagsboro is key to maximizing your short term rental income potential. Seasonality significantly impacts earnings. Our analysis, based on data from the past 12 months, shows that the peak revenue month for STRs in Dagsboro is typically May, while November often presents the lowest earnings, highlighting opportunities for strategic pricing adjustments during shoulder and low seasons. Explore the typical Airbnb income in Dagsboro across different performance tiers:
- Best-in-class properties (Top 10%) achieve $5,476+ monthly, often utilizing dynamic pricing and superior guest experiences.
- Strong performing properties (Top 25%) earn $3,786 or more, indicating effective management and desirable locations/amenities.
- Typical properties (Median) generate around $1,937 per month, representing the average market performance.
- Entry-level properties (Bottom 25%) see earnings around $844, often with potential for optimization.
Average Monthly Airbnb Earnings Trend in Dagsboro
Dagsboro Airbnb Occupancy Rate Trends (2025)
Maximize your bookings by understanding the Dagsboro STR occupancy trends. Seasonal demand shifts significantly influence how often properties are booked. Typically, Julysees the highest demand (peak season occupancy), while January experiences the lowest (low season). Effective strategies, like adjusting minimum stays or offering promotions, can boost occupancy during slower periods. Here's how different property tiers perform in Dagsboro:
- Best-in-class properties (Top 10%) achieve 65%+ occupancy, indicating high desirability and potentially optimized availability.
- Strong performing properties (Top 25%) maintain 46% or higher occupancy, suggesting good market fit and guest satisfaction.
- Typical properties (Median) have an occupancy rate around 26%.
- Entry-level properties (Bottom 25%) average 17% occupancy, potentially facing higher vacancy.
Average Monthly Occupancy Rate Trend in Dagsboro
Average Daily Rate (ADR) Airbnb Trends in Dagsboro (2025)
Effective short term rental pricing strategy in Dagsboro involves understanding monthly ADR fluctuations. The Average Daily Rate (ADR) for Airbnb in Dagsboro typically peaks in July and dips lowest during October. Leveraging Airbnb dynamic pricing tools or strategies based on this seasonality can significantly boost revenue. Here's a look at the typical nightly rates achieved:
- Best-in-class properties (Top 10%) command rates of $409+ per night, often due to premium features or locations.
- Strong performing properties (Top 25%) achieve nightly rates of $270 or more.
- Typical properties (Median) charge around $187 per night.
- Entry-level properties (Bottom 25%) earn around $145 per night.
Average Daily Rate (ADR) Trend by Month in Dagsboro
Get Live Dagsboro Market Intelligence 👇

Explore Real-time Analytics
Airbnb Seasonality Analysis & Trends in Dagsboro (2025)
Peak Season (May, June, April)
- Revenue averages $4,929 per month
- Occupancy rates average 37.4%
- Daily rates average $225
Shoulder Season
- Revenue averages $2,354 per month
- Occupancy maintains around 33.6%
- Daily rates hold near $226
Low Season (February, March, November)
- Revenue drops to average $1,005 per month
- Occupancy decreases to average 29.1%
- Daily rates adjust to average $218
Seasonality Insights for Dagsboro
- The Airbnb seasonality in Dagsboro shows highly seasonal trends requiring careful strategy. While the sections above show seasonal averages, it's also insightful to look at the extremes:
- During the high season, the absolute peak month showcases Dagsboro's highest earning potential, with monthly revenues capable of climbing to $5,800, occupancy reaching a high of 57.4%, and ADRs peaking at $241.
- Conversely, the slowest single month of the year, typically falling within the low season, marks the market's lowest point. In this month, revenue might dip to $787, occupancy could drop to 18.6%, and ADRs may adjust down to $211.
- Understanding both the seasonal averages and these monthly peaks and troughs in revenue, occupancy, and ADR is crucial for maximizing your Airbnb profit potential in Dagsboro.
Seasonal Strategies for Maximizing Profit
- Peak Season: Maximize revenue through premium pricing and potentially longer minimum stays. Ensure high availability.
- Low Season: Offer competitive pricing, special promotions (e.g., extended stay discounts), and flexible cancellation policies. Target off-season travelers like remote workers or budget-conscious guests.
- Shoulder Seasons: Implement dynamic pricing that balances peak and low rates. Target weekend travelers or specific events. Offer slightly more flexible terms than peak season.
- Regularly analyze your own performance against these Dagsboro seasonality benchmarks and adjust your pricing and availability strategy accordingly.
Best Areas for Airbnb Investment in Dagsboro (2025)
Exploring the top neighborhoods for short-term rentals in Dagsboro? This section highlights key areas, outlining why they are attractive for hosts and guests, along with notable local attractions. Consider these locations based on your target guest profile and investment strategy.
| Neighborhood / Area | Why Host Here? (Target Guests & Appeal) | Key Attractions & Landmarks |
|---|---|---|
| Dagsboro Beach | A quiet and relaxing beach area that offers a serene atmosphere, making it ideal for families and vacation seekers looking for seaside tranquility. | Dagsboro Beach, John McKinney Park, Nearby Indian River Bay, Fresh Pond Trail, Bayside Resort Golf Club |
| Bethany Beach | A popular coastal town known for its charm, family-friendly beaches, and boardwalk, attracting many tourists during the summer season. | Bethany Beach Boardwalk, Bethany Beach Nature Center, Paddleboarding and kayaking on the ocean, Local shops and restaurants, Ocean View Beach Club |
| Fenwick Island | A small coastal town that offers a laid-back atmosphere, famous for its clean beaches and proximity to attractions in both Delaware and Maryland. | Fenwick Island State Park, DiscoverSea Shipwreck Museum, Water activities like fishing and crabbing, Local dining options, Sea Cabin Beach |
| Ocean View | A growing residential area with attractions for families, close to the beach and perfect for those looking for a retreat from the larger resort towns. | Bear Trap Dunes Golf Club, Ocean View Beach Club, Community parks, Local markets, Fishing and outdoor activities |
| Selbyville | A quaint town with access to nature and water activities, ideal for travelers who enjoy outdoor pursuits and a quieter pace. | Assawoman Wildlife Area, Local seafood restaurants, Pony Island Lane Beach, Crabbing and fishing spots, Bay Creek Marina |
| Millsboro | Situated inland but close to the beaches, Millsboro offers a blend of local charm and access to major highways, appealing to those seeking diverse activities. | Pot-Nets Lakeside, Local vineyards, Millsboro Town Park, Shopping areas nearby, Water sports locations |
| Rehoboth Beach | A vibrant beach town with a bustling boardwalk, known for its shopping, dining, and nightlife, making it a prime target for visitors year-round. | Rehoboth Beach Boardwalk, Funland Amusement Park, Rehoboth Clear Space Theatre, Shopping at the Tanger Outlets, Nearby Cape Henlopen State Park |
| Lewes | Rich in history and close to the beach, Lewes provides a charming small-town feel, making it attractive for families and history buffs alike. | Cape Henlopen State Park, Historic Lewes Farmers Market, Zwaanendael Museum, Lewes Beach, Nearby nature trails |
Understanding Airbnb License Requirements & STR Laws in Dagsboro (2025)
While Dagsboro, Delaware, United States currently shows low STR regulations, specific Airbnb license requirements might still exist or change. Always verify the latest short term rental regulations and Airbnb license requirements directly with local government authorities for Dagsboro to ensure full compliance before hosting.
(Source: AirROI data, 2025, finding no licensed listings among those analyzed)
Top Performing Airbnb Properties in Dagsboro (2025)
Benchmark your potential! Explore examples of top-performing Airbnb properties in Dagsborobased on Trailing Twelve Month (TTM) revenue. Analyze their characteristics, revenue, occupancy rate, and ADR to understand what drives success in this market.
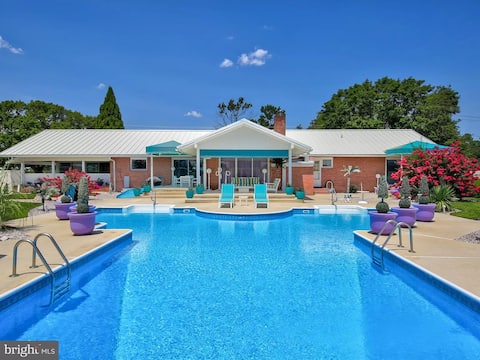
Private pool oasis by beach 17+
Entire Place • 4 bedrooms

The Garden at Clayton House
Entire Place • 3 bedrooms
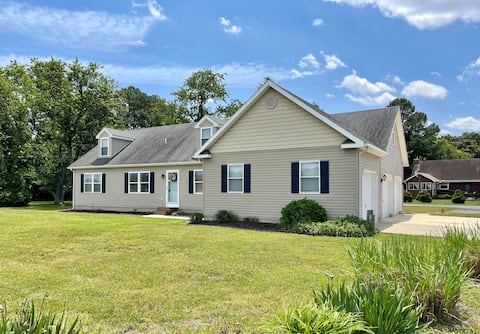
Beautiful Beach Home | Sleeps 10 | Garage | Bikes
Entire Place • 4 bedrooms
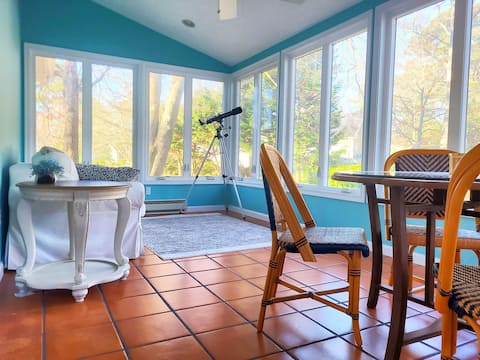
Beachy days and starry nights
Entire Place • 3 bedrooms

Sunset Cottage,
Entire Place • 2 bedrooms
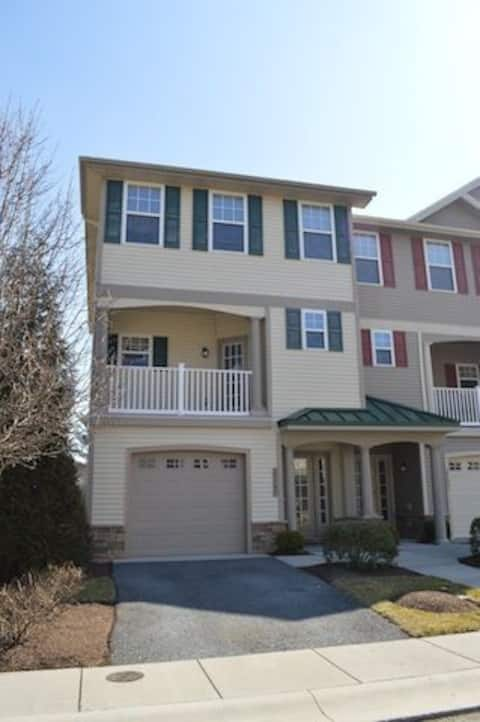
Beaches, Shops, Golf!
Entire Place • 3 bedrooms
Note: Performance varies based on location, size, amenities, seasonality, and management quality. Data reflects the past 12 months.
Top Performing Airbnb Hosts in Dagsboro (2025)
Learn from the best! This table showcases top-performing Airbnb hosts in Dagsboro based on the number of properties managed and estimated total revenue over the past year. Analyze their scale and performance metrics.
| Host Name | Properties | Grossing Revenue | Stay Reviews | Avg Rating |
|---|---|---|---|---|
| Julie | 1 | $61,768 | 17 | 4.82/5.0 |
| Karen | 1 | $54,485 | 10 | 5.00/5.0 |
| Erin | 1 | $43,307 | 31 | 4.77/5.0 |
| Ariel | 1 | $36,023 | 41 | 4.98/5.0 |
| Angi | 1 | $30,528 | 23 | 5.00/5.0 |
| Brett | 1 | $29,678 | 46 | 4.54/5.0 |
| James | 3 | $20,889 | 72 | 4.95/5.0 |
| Joanne | 1 | $14,801 | 248 | 4.98/5.0 |
| Host #311880992 | 2 | $14,086 | 0 | 0.00/5.0 |
| Gerald | 1 | $5,329 | 59 | 4.63/5.0 |
Analyzing the strategies of top hosts, such as their property selection, pricing, and guest communication, can offer valuable lessons for optimizing your own Airbnb operations in Dagsboro.
Dive Deeper: Advanced Dagsboro STR Market Data (2025)
Ready to unlock more insights? AirROI provides access to advanced metrics and comprehensive Airbnb data for Dagsboro. Explore detailed analytics beyond this report to refine your investment strategy, optimize pricing, and maximize your vacation rental profits.
Explore Advanced MetricsDagsboro Short-Term Rental Market Composition (2025): Property & Room Types
Room Type Distribution
Property Type Distribution
Market Composition Insights for Dagsboro
- The Dagsboro Airbnb market composition is heavily skewed towards Entire Home/Apt listings, which make up 88.2% of the 17 active rentals. This indicates strong guest preference for privacy and space.
- Looking at the property type distribution in Dagsboro, House properties are the most common (70.6%), reflecting the local real estate landscape.
- Houses represent a significant 70.6% portion, catering likely to families or larger groups.
Dagsboro Airbnb Room Capacity Analysis (2025): Bedroom Distribution
Distribution of Listings by Number of Bedrooms
Room Capacity Insights for Dagsboro
- The dominant room capacity in Dagsboro is 3 bedrooms listings, making up 47.1% of the market. This suggests a strong demand for properties suitable for families or small groups.
- Together, 3 bedrooms and 2 bedrooms properties represent 64.7% of the active Airbnb listings in Dagsboro, indicating a high concentration in these sizes.
- A significant 58.9% of listings offer 3+ bedrooms, catering to larger groups and families seeking more space in Dagsboro.
Dagsboro Vacation Rental Guest Capacity Trends (2025)
Distribution of Listings by Guest Capacity
Guest Capacity Insights for Dagsboro
- The most common guest capacity trend in Dagsboro vacation rentals is listings accommodating 8+ guests (41.2%). This suggests the primary traveler segment is likely larger groups.
- Properties designed for 8+ guests and 6 guests dominate the Dagsboro STR market, accounting for 64.7% of listings.
- 64.7% of properties accommodate 6+ guests, serving the market segment for larger families or group travel in Dagsboro.
- On average, properties in Dagsboro are equipped to host 5.5 guests.
Dagsboro Airbnb Booking Patterns (2025): Available vs. Booked Days
Available Days Distribution
Booked Days Distribution
Booking Pattern Insights for Dagsboro
- The most common availability pattern in Dagsboro falls within the 271-366 days range, representing 58.8% of listings. This suggests many properties have significant open periods on their calendars.
- Approximately 94.1% of listings show high availability (181+ days open annually), indicating potential for increased bookings or specific owner usage patterns.
- For booked days, the 1-30 days range is most frequent in Dagsboro (35.3%), reflecting common guest stay durations or potential owner blocking patterns.
- A notable 5.9% of properties secure long booking periods (181+ days booked per year), highlighting successful long-term rental strategies or significant owner usage.
Dagsboro Airbnb Minimum Stay Requirements Analysis
Distribution of Listings by Minimum Night Requirement
1 Night
1 listings
7.1% of total
2 Nights
8 listings
57.1% of total
3 Nights
3 listings
21.4% of total
4-6 Nights
1 listings
7.1% of total
30+ Nights
1 listings
7.1% of total
Key Insights
- The most prevalent minimum stay requirement in Dagsboro is 2 Nights, adopted by 57.1% of listings. This highlights the market's preference for shorter, flexible bookings.
- A strong majority (64.2%) of the Dagsboro Airbnb data shows acceptance of very short stays (1-2 nights), indicating a dynamic, high-turnover market.
Recommendations
- Align with the market by considering a 2 Nights minimum stay, as 57.1% of Dagsboro hosts use this setting.
- If feasible, allowing 1-night stays, especially midweek or during low season, could capture last-minute bookings, as only 7.1% currently do.
- A 2-night minimum appears standard (57.1%). Consider this for weekends or peak periods.
- Explore offering discounts for stays of 30+ nights to attract the 7.1% of the market seeking extended stays.
- Adjust minimum nights based on seasonality – potentially shorter during low season and longer during peak demand periods in Dagsboro.
Dagsboro Airbnb Cancellation Policy Trends Analysis (2025)
Flexible
4 listings
30.8% of total
Moderate
4 listings
30.8% of total
Firm
4 listings
30.8% of total
Strict
1 listings
7.7% of total
Cancellation Policy Insights for Dagsboro
- The prevailing Airbnb cancellation policy trend in Dagsboro is Flexible, used by 30.8% of listings.
- There's a relatively balanced mix between guest-friendly (61.6%) and stricter (38.5%) policies, offering choices for different guest needs.
- Strict cancellation policies are quite rare (7.7%), potentially making listings with this policy less competitive unless justified by high demand or property type.
Recommendations for Hosts
- Consider adopting a Flexible policy to align with the 30.8% market standard in Dagsboro.
- Using a Strict policy might deter some guests, as only 7.7% of listings use it. Evaluate if potential revenue protection outweighs possible lower booking rates.
- Regularly review your cancellation policy against competitors and market demand shifts in Dagsboro.
Dagsboro STR Booking Lead Time Analysis (2025)
Average Booking Lead Time by Month
Booking Lead Time Insights for Dagsboro
- The overall average booking lead time for vacation rentals in Dagsboro is 44 days.
- Guests book furthest in advance for stays during June (average 77 days), likely coinciding with peak travel demand or local events.
- The shortest booking windows occur for stays in March (average 16 days), indicating more last-minute travel plans during this time.
- Seasonally, Summer (58 days avg.) sees the longest lead times, while Spring (34 days avg.) has the shortest, reflecting typical travel planning cycles.
Recommendations for Hosts
- Use the overall average lead time (44 days) as a baseline for your pricing and availability strategy in Dagsboro.
- For June stays, consider implementing length-of-stay discounts or slightly higher rates for bookings made less than 77 days out to capitalize on advance planning.
- Target marketing efforts for the Summer season well in advance (at least 58 days) to capture early planners.
- Monitor your own booking lead times against these Dagsboro averages to identify opportunities for dynamic pricing adjustments.
Popular & Essential Airbnb Amenities in Dagsboro (2025)
Amenity Prevalence
Amenity Insights for Dagsboro
- Essential amenities in Dagsboro that guests expect include: Free parking on premises, Kitchen, Air conditioning, Wifi, Smoke alarm. Lacking these (any) could significantly impact bookings.
- Popular amenities like Dishes and silverware, Refrigerator, Heating are common but not universal. Offering these can provide a competitive edge.
Recommendations for Hosts
- Ensure your listing includes all essential amenities for Dagsboro: Free parking on premises, Kitchen, Air conditioning, Wifi, Smoke alarm.
- Consider adding popular differentiators like Dishes and silverware or Refrigerator to increase appeal.
- Highlight unique or less common amenities you offer (e.g., hot tub, dedicated workspace, EV charger) in your listing description and photos.
- Regularly check competitor amenities in Dagsboro to stay competitive.
Dagsboro Airbnb Guest Demographics & Profile Analysis (2025)
Guest Profile Summary for Dagsboro
- The typical guest profile for Airbnb in Dagsboro consists of primarily domestic travelers (93%), often arriving from nearby Lancaster, typically belonging to the Post-2000s (Gen Z/Alpha) group (50%), primarily speaking English or Spanish.
- Domestic travelers account for 92.8% of guests.
- Key international markets include United States (92.8%) and DC (2.7%).
- Top languages spoken are English (70.3%) followed by Spanish (13.5%).
- A significant demographic segment is the Post-2000s (Gen Z/Alpha) group, representing 50% of guests.
Recommendations for Hosts
- Target domestic marketing efforts towards travelers from Lancaster and Philadelphia.
- Tailor amenities and listing descriptions to appeal to the dominant Post-2000s (Gen Z/Alpha) demographic (e.g., highlight fast WiFi, smart home features, local guides).
- Highlight unique local experiences or amenities relevant to the primary guest profile.
- Consider seasonal promotions aligned with peak travel times for key origin markets.
Nearby Short-Term Rental Market Comparison
How does the Dagsboro Airbnb market stack up against its neighbors? Compare key performance metrics like average monthly revenue, ADR, and occupancy rates in surrounding areas to understand the broader regional STR landscape.
| Market | Active Properties | Monthly Revenue | Daily Rate | Avg. Occupancy |
|---|---|---|---|---|
| Centreville | 15 | $6,205 | $510.77 | 47% |
| Mayo | 13 | $5,786 | $439.15 | 52% |
| Stone Harbor | 34 | $5,711 | $639.17 | 45% |
| Stevensville | 70 | $5,476 | $499.46 | 43% |
| Harvey Cedars | 23 | $5,311 | $775.06 | 40% |
| Chester | 17 | $5,299 | $437.72 | 43% |
| Arundel on the Bay | 25 | $5,285 | $509.37 | 39% |
| Middletown Township | 10 | $5,208 | $392.83 | 53% |
| Lower Windsor Township | 15 | $5,190 | $348.51 | 45% |
| Cape May Point | 25 | $5,145 | $509.59 | 48% |