Meredith Airbnb Market Analysis 2025: Short Term Rental Data & Vacation Rental Statistics in Colorado, United States
Is Airbnb profitable in Meredith in 2025? Explore comprehensive Airbnb analytics for Meredith, Colorado, United States to uncover income potential. This 2025 STR market report for Meredith, based on AirROI data from April 2024 to March 2025, reveals key trends in the niche market of 17 active listings.
Whether you're considering an Airbnb investment in Meredith, optimizing your existing vacation rental, or exploring rental arbitrage opportunities, understanding the Meredith Airbnb data is crucial. Leveraging the low regulation environment is key to maximizing your short term rental income potential. Let's dive into the specifics.
Key Meredith Airbnb Performance Metrics Overview
Monthly Airbnb Revenue Variations & Income Potential in Meredith (2025)
Understanding the monthly revenue variations for Airbnb listings in Meredith is key to maximizing your short term rental income potential. Seasonality significantly impacts earnings. Our analysis, based on data from the past 12 months, shows that the peak revenue month for STRs in Meredith is typically July, while March often presents the lowest earnings, highlighting opportunities for strategic pricing adjustments during shoulder and low seasons. Explore the typical Airbnb income in Meredith across different performance tiers:
- Best-in-class properties (Top 10%) achieve $6,939+ monthly, often utilizing dynamic pricing and superior guest experiences.
- Strong performing properties (Top 25%) earn $4,531 or more, indicating effective management and desirable locations/amenities.
- Typical properties (Median) generate around $3,122 per month, representing the average market performance.
- Entry-level properties (Bottom 25%) see earnings around $1,994, often with potential for optimization.
Average Monthly Airbnb Earnings Trend in Meredith
Meredith Airbnb Occupancy Rate Trends (2025)
Maximize your bookings by understanding the Meredith STR occupancy trends. Seasonal demand shifts significantly influence how often properties are booked. Typically, Julysees the highest demand (peak season occupancy), while March experiences the lowest (low season). Effective strategies, like adjusting minimum stays or offering promotions, can boost occupancy during slower periods. Here's how different property tiers perform in Meredith:
- Best-in-class properties (Top 10%) achieve 65%+ occupancy, indicating high desirability and potentially optimized availability.
- Strong performing properties (Top 25%) maintain 49% or higher occupancy, suggesting good market fit and guest satisfaction.
- Typical properties (Median) have an occupancy rate around 37%.
- Entry-level properties (Bottom 25%) average 25% occupancy, potentially facing higher vacancy.
Average Monthly Occupancy Rate Trend in Meredith
Average Daily Rate (ADR) Airbnb Trends in Meredith (2025)
Effective short term rental pricing strategy in Meredith involves understanding monthly ADR fluctuations. The Average Daily Rate (ADR) for Airbnb in Meredith typically peaks in May and dips lowest during November. Leveraging Airbnb dynamic pricing tools or strategies based on this seasonality can significantly boost revenue. Here's a look at the typical nightly rates achieved:
- Best-in-class properties (Top 10%) command rates of $619+ per night, often due to premium features or locations.
- Strong performing properties (Top 25%) achieve nightly rates of $356 or more.
- Typical properties (Median) charge around $253 per night.
- Entry-level properties (Bottom 25%) earn around $206 per night.
Average Daily Rate (ADR) Trend by Month in Meredith
Get Live Meredith Market Intelligence 👇

Explore Real-time Analytics
Airbnb Seasonality Analysis & Trends in Meredith (2025)
Peak Season (July, October, August)
- Revenue averages $5,837 per month
- Occupancy rates average 60.8%
- Daily rates average $337
Shoulder Season
- Revenue averages $3,562 per month
- Occupancy maintains around 35.9%
- Daily rates hold near $338
Low Season (February, March, November)
- Revenue drops to average $2,125 per month
- Occupancy decreases to average 25.2%
- Daily rates adjust to average $291
Seasonality Insights for Meredith
- The Airbnb seasonality in Meredith shows highly seasonal trends requiring careful strategy. While the sections above show seasonal averages, it's also insightful to look at the extremes:
- During the high season, the absolute peak month showcases Meredith's highest earning potential, with monthly revenues capable of climbing to $7,110, occupancy reaching a high of 69.5%, and ADRs peaking at $368.
- Conversely, the slowest single month of the year, typically falling within the low season, marks the market's lowest point. In this month, revenue might dip to $1,682, occupancy could drop to 19.9%, and ADRs may adjust down to $286.
- Understanding both the seasonal averages and these monthly peaks and troughs in revenue, occupancy, and ADR is crucial for maximizing your Airbnb profit potential in Meredith.
Seasonal Strategies for Maximizing Profit
- Peak Season: Maximize revenue through premium pricing and potentially longer minimum stays. Ensure high availability.
- Low Season: Offer competitive pricing, special promotions (e.g., extended stay discounts), and flexible cancellation policies. Target off-season travelers like remote workers or budget-conscious guests.
- Shoulder Seasons: Implement dynamic pricing that balances peak and low rates. Target weekend travelers or specific events. Offer slightly more flexible terms than peak season.
- Regularly analyze your own performance against these Meredith seasonality benchmarks and adjust your pricing and availability strategy accordingly.
Best Areas for Airbnb Investment in Meredith (2025)
Exploring the top neighborhoods for short-term rentals in Meredith? This section highlights key areas, outlining why they are attractive for hosts and guests, along with notable local attractions. Consider these locations based on your target guest profile and investment strategy.
| Neighborhood / Area | Why Host Here? (Target Guests & Appeal) | Key Attractions & Landmarks |
|---|---|---|
| Lakeview | Picturesque lake views and outdoor recreational opportunities make this area perfect for nature lovers. It's ideal for families and those looking to escape to the mountains with access to activities like fishing, hiking, and boating. | Lake Dillon, Dillon Marina, Gore Range, Dillon Amphitheater, White River National Forest |
| Main Street | Quaint and lively, the Main Street area offers unique shops, dining options, and a charming atmosphere. Its central location makes it a popular spot for visitors who want to explore the local culture. | Meredith Historical Society, Local boutiques, Art galleries, Cafes and restaurants |
| Mountain Peak | Perfect for those seeking adventure, this area is close to numerous outdoor activities, including skiing and snowboarding in the winter, as well as mountain biking and hiking in the summer. | Copper Mountain Resort, Summerwood Trail, Meredith Loop Trail, Skiing and Snowboarding spots |
| Riverfront | With beautiful views of rivers and trails, this area offers a peaceful retreat for guests who enjoy fishing or kayaking. It's an excellent location for rentals that cater to outdoor enthusiasts. | Eagle River, Kayaking spots, Fishing locations, Scenic trails |
| Woodlands | Surrounded by nature, this area provides a serene environment for guests looking to relax. Ideal for year-round visitors who appreciate the tranquility of woodlands while being close to town. | National Forests, Hiking Trails, Nature reserves, Wildlife watching spots |
| Hillside | The hillside area offers breathtaking views and proximity to hiking trails, making it an attractive place for guests who appreciate scenic beauty and outdoor activities. | Viewpoints, Scenic hiking trails, Piknik Area, Nature observation spots |
| Cedar Heights | This residential neighborhood combines the comfort of home with the convenience of nearby amenities. Great for families and longer stays. | Community parks, Playgrounds, Recreational facilities |
| Summit Ridge | Ideal for visitors who want luxury and comfort, this area features high-end rentals with stunning mountain views, making it attractive for those looking for a premium experience. | Luxury cabins, Spa options, Fine dining, Ski resorts nearby |
Understanding Airbnb License Requirements & STR Laws in Meredith (2025)
While Meredith, Colorado, United States currently shows low STR regulations, specific Airbnb license requirements might still exist or change. Always verify the latest short term rental regulations and Airbnb license requirements directly with local government authorities for Meredith to ensure full compliance before hosting.
(Source: AirROI data, 2025, finding no licensed listings among those analyzed)
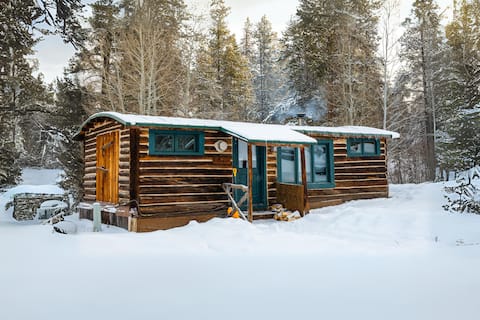
Top Performing Airbnb Properties in Meredith (2025)
Benchmark your potential! Explore examples of top-performing Airbnb properties in Meredithbased on Trailing Twelve Month (TTM) revenue. Analyze their characteristics, revenue, occupancy rate, and ADR to understand what drives success in this market.
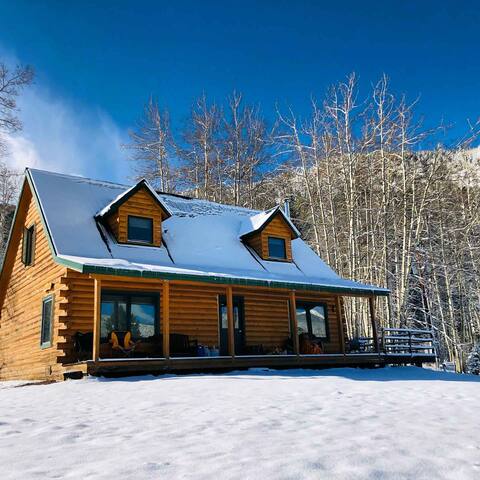
Mountain Lodge at Dreamy Art & Nature Retreat
Entire Place • 4 bedrooms
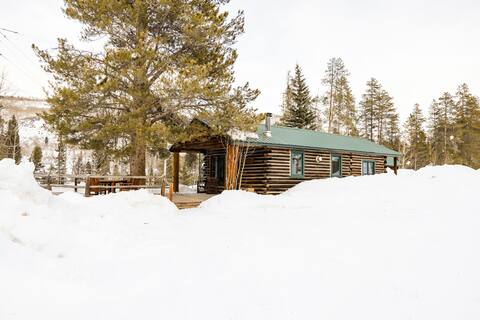
Beyul Retreat - Valley View
Entire Place • 1 bedroom

Beyul Retreat - McGee
Entire Place • N/A

Historic Cabin Sleeps 7 at Art & Nature Retreat
Entire Place • 2 bedrooms
Larkspur Cabin - Beyul Retreat
Entire Place • 1 bedroom
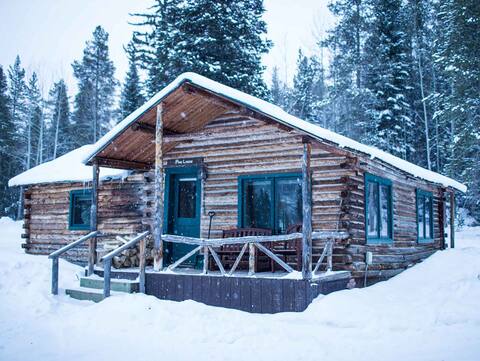
Pine Lodge at Beyul Retreat
Entire Place • 1 bedroom
Note: Performance varies based on location, size, amenities, seasonality, and management quality. Data reflects the past 12 months.
Top Performing Airbnb Hosts in Meredith (2025)
Learn from the best! This table showcases top-performing Airbnb hosts in Meredith based on the number of properties managed and estimated total revenue over the past year. Analyze their scale and performance metrics.
| Host Name | Properties | Grossing Revenue | Stay Reviews | Avg Rating |
|---|---|---|---|---|
| Abby | 13 | $483,015 | 290 | 4.80/5.0 |
| Judy | 1 | $32,851 | 73 | 4.88/5.0 |
| Cullen | 1 | $30,553 | 8 | 5.00/5.0 |
| Jennifer | 1 | $27,909 | 55 | 4.95/5.0 |
| Cash | 1 | $5,189 | 35 | 5.00/5.0 |
Analyzing the strategies of top hosts, such as their property selection, pricing, and guest communication, can offer valuable lessons for optimizing your own Airbnb operations in Meredith.
Dive Deeper: Advanced Meredith STR Market Data (2025)
Ready to unlock more insights? AirROI provides access to advanced metrics and comprehensive Airbnb data for Meredith. Explore detailed analytics beyond this report to refine your investment strategy, optimize pricing, and maximize your vacation rental profits.
Explore Advanced MetricsMeredith Short-Term Rental Market Composition (2025): Property & Room Types
Room Type Distribution
Property Type Distribution
Market Composition Insights for Meredith
- The Meredith Airbnb market composition is heavily skewed towards Entire Home/Apt listings, which make up 82.4% of the 17 active rentals. This indicates strong guest preference for privacy and space.
- Looking at the property type distribution in Meredith, Outdoor/Unique properties are the most common (100%), reflecting the local real estate landscape.
Meredith Airbnb Room Capacity Analysis (2025): Bedroom Distribution
Distribution of Listings by Number of Bedrooms
Room Capacity Insights for Meredith
- The dominant room capacity in Meredith is 1 bedroom listings, making up 41.2% of the market. This suggests a strong demand for properties suitable for couples or solo travelers.
- Together, 1 bedroom and 2 bedrooms properties represent 58.8% of the active Airbnb listings in Meredith, indicating a high concentration in these sizes.
- A significant 23.6% of listings offer 3+ bedrooms, catering to larger groups and families seeking more space in Meredith.
Meredith Vacation Rental Guest Capacity Trends (2025)
Distribution of Listings by Guest Capacity
Guest Capacity Insights for Meredith
- The most common guest capacity trend in Meredith vacation rentals is listings accommodating 2 guests (35.3%). This suggests the primary traveler segment is likely couples or solo travelers.
- Properties designed for 2 guests and 8+ guests dominate the Meredith STR market, accounting for 64.7% of listings.
- 35.3% of properties accommodate 6+ guests, serving the market segment for larger families or group travel in Meredith.
- On average, properties in Meredith are equipped to host 4.7 guests.
Meredith Airbnb Booking Patterns (2025): Available vs. Booked Days
Available Days Distribution
Booked Days Distribution
Booking Pattern Insights for Meredith
- The most common availability pattern in Meredith falls within the 181-270 days range, representing 52.9% of listings. This suggests many properties have significant open periods on their calendars.
- Approximately 88.2% of listings show high availability (181+ days open annually), indicating potential for increased bookings or specific owner usage patterns.
- For booked days, the 91-180 days range is most frequent in Meredith (58.8%), reflecting common guest stay durations or potential owner blocking patterns.
- A notable 11.8% of properties secure long booking periods (181+ days booked per year), highlighting successful long-term rental strategies or significant owner usage.
Meredith Airbnb Minimum Stay Requirements Analysis
Distribution of Listings by Minimum Night Requirement
1 Night
3 listings
17.6% of total
2 Nights
12 listings
70.6% of total
3 Nights
2 listings
11.8% of total
Key Insights
- The most prevalent minimum stay requirement in Meredith is 2 Nights, adopted by 70.6% of listings. This highlights the market's preference for shorter, flexible bookings.
- A strong majority (88.2%) of the Meredith Airbnb data shows acceptance of very short stays (1-2 nights), indicating a dynamic, high-turnover market.
Recommendations
- Align with the market by considering a 2 Nights minimum stay, as 70.6% of Meredith hosts use this setting.
- If feasible, allowing 1-night stays, especially midweek or during low season, could capture last-minute bookings, as only 17.6% currently do.
- A 2-night minimum appears standard (70.6%). Consider this for weekends or peak periods.
- Adjust minimum nights based on seasonality – potentially shorter during low season and longer during peak demand periods in Meredith.
Meredith Airbnb Cancellation Policy Trends Analysis (2025)
Flexible
1 listings
5.9% of total
Moderate
14 listings
82.4% of total
Firm
1 listings
5.9% of total
Strict
1 listings
5.9% of total
Cancellation Policy Insights for Meredith
- The prevailing Airbnb cancellation policy trend in Meredith is Moderate, used by 82.4% of listings.
- The market strongly favors guest-friendly terms, with 88.3% of listings offering Flexible or Moderate policies. This suggests guests in Meredith may expect booking flexibility.
- Strict cancellation policies are quite rare (5.9%), potentially making listings with this policy less competitive unless justified by high demand or property type.
Recommendations for Hosts
- Consider adopting a Moderate policy to align with the 82.4% market standard in Meredith.
- Using a Strict policy might deter some guests, as only 5.9% of listings use it. Evaluate if potential revenue protection outweighs possible lower booking rates.
- Regularly review your cancellation policy against competitors and market demand shifts in Meredith.
Meredith STR Booking Lead Time Analysis (2025)
Average Booking Lead Time by Month
Booking Lead Time Insights for Meredith
- The overall average booking lead time for vacation rentals in Meredith is 106 days.
- Guests book furthest in advance for stays during October (average 181 days), likely coinciding with peak travel demand or local events.
- The shortest booking windows occur for stays in February (average 43 days), indicating more last-minute travel plans during this time.
- Seasonally, Fall (143 days avg.) sees the longest lead times, while Winter (83 days avg.) has the shortest, reflecting typical travel planning cycles.
Recommendations for Hosts
- Use the overall average lead time (106 days) as a baseline for your pricing and availability strategy in Meredith.
- For October stays, consider implementing length-of-stay discounts or slightly higher rates for bookings made less than 181 days out to capitalize on advance planning.
- Target marketing efforts for the Fall season well in advance (at least 143 days) to capture early planners.
- Monitor your own booking lead times against these Meredith averages to identify opportunities for dynamic pricing adjustments.
Popular & Essential Airbnb Amenities in Meredith (2025)
Amenity Prevalence
Amenity Insights for Meredith
- Essential amenities in Meredith that guests expect include: Free parking on premises. Lacking these (this) could significantly impact bookings.
- Popular amenities like Dishes and silverware, Heating, Hot water are common but not universal. Offering these can provide a competitive edge.
Recommendations for Hosts
- Ensure your listing includes all essential amenities for Meredith: Free parking on premises.
- Consider adding popular differentiators like Dishes and silverware or Heating to increase appeal.
- Highlight unique or less common amenities you offer (e.g., hot tub, dedicated workspace, EV charger) in your listing description and photos.
- Regularly check competitor amenities in Meredith to stay competitive.
Meredith Airbnb Guest Demographics & Profile Analysis (2025)
Guest Profile Summary for Meredith
- The typical guest profile for Airbnb in Meredith consists of primarily domestic travelers (94%), often arriving from nearby Denver, typically belonging to the Post-2000s (Gen Z/Alpha) group (50%), primarily speaking English or Spanish.
- Domestic travelers account for 93.8% of guests.
- Key international markets include United States (93.8%) and Brazil (2.5%).
- Top languages spoken are English (67.3%) followed by Spanish (16.4%).
- A significant demographic segment is the Post-2000s (Gen Z/Alpha) group, representing 50% of guests.
Recommendations for Hosts
- Target domestic marketing efforts towards travelers from Denver and Chicago.
- Tailor amenities and listing descriptions to appeal to the dominant Post-2000s (Gen Z/Alpha) demographic (e.g., highlight fast WiFi, smart home features, local guides).
- Highlight unique local experiences or amenities relevant to the primary guest profile.
- Consider seasonal promotions aligned with peak travel times for key origin markets.
Nearby Short-Term Rental Market Comparison
How does the Meredith Airbnb market stack up against its neighbors? Compare key performance metrics like average monthly revenue, ADR, and occupancy rates in surrounding areas to understand the broader regional STR landscape.
| Market | Active Properties | Monthly Revenue | Daily Rate | Avg. Occupancy |
|---|---|---|---|---|
| Aspen Park | 10 | $7,088 | $438.39 | 55% |
| Aspen | 547 | $7,044 | $1057.50 | 37% |
| Blue River | 197 | $6,903 | $523.87 | 48% |
| El Jebel | 30 | $6,432 | $433.35 | 52% |
| Snowmass | 17 | $6,424 | $664.24 | 43% |
| Grand County | 11 | $5,754 | $516.53 | 48% |
| Clear Creek County | 11 | $5,644 | $343.75 | 53% |
| Black Hawk | 120 | $5,331 | $299.77 | 57% |
| Crested Butte | 235 | $5,141 | $504.30 | 43% |
| Indian Hills | 11 | $5,056 | $349.42 | 52% |